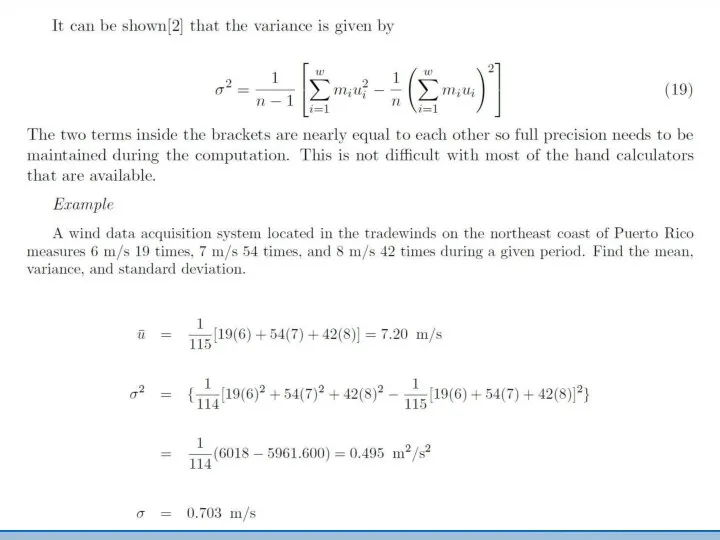
- Wind Energy Technology. (Lecture 8)

Содержание
- 4. National Wind Technology Center Jim Johnson August 27, 2008 Arvada Rotary Meeting
- 5. Wind Energy Technology At it’s simplest, the wind turns the turbine’s blades, which spin a shaft
- 9. Growing to Support the Needs of Industry Wind Resource Maps for North and South Dakota 1987
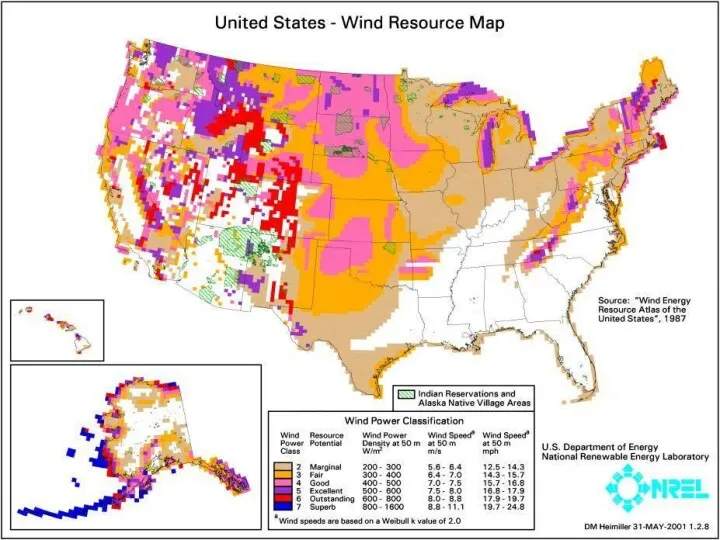
- 10. Wind Resource Mapping Identifies most promising areas for wind energy development Employs geographic information system technology
- 11. Conceptual Transmission Overlay
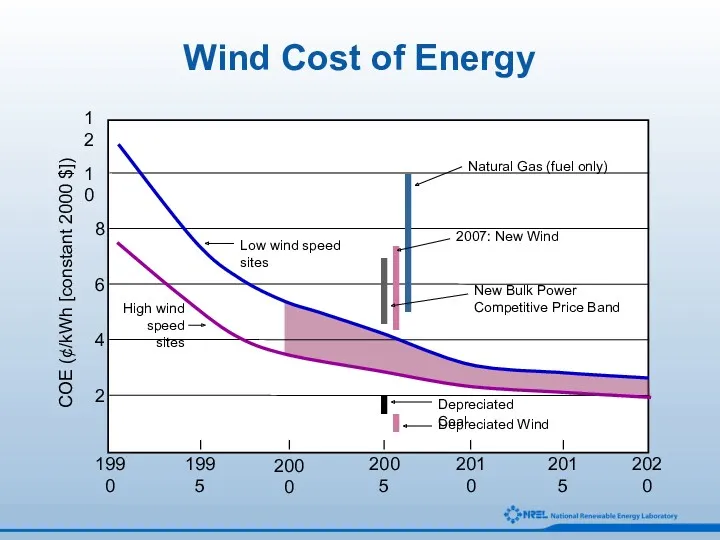
- 13. 2 4 6 8 10 12 1990 COE (¢/kWh [constant 2000 $]) Low wind speed sites
- 14. Clipper LWST Prototype 2.5 MW with 93 m Rotor
- 15. Industry’s Growing Needs A new 45-meter wind turbine blade was shipped to the NWTC for testing
- 16. Wind field = U (y,z,t) Steady wind shear superimposed Rotational sampling effect increases effective wind fluctuations
- 17. Advanced Drivetrain R&D Today Tomorrow GEC NPS
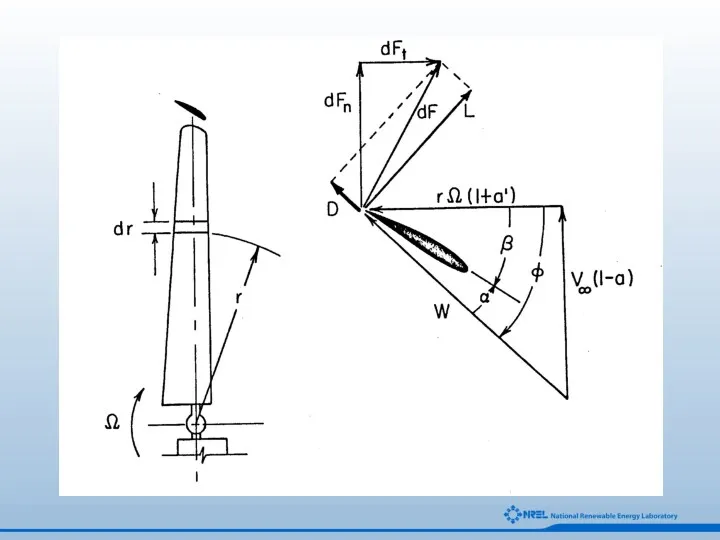
- 18. Land Based Technology Improvement Options Advanced Rotor Technology Extended rotor architectures through load control Incorporate advanced
- 19. Deep Water Wind Turbine Development Current Technology
- 20. MIT ADAMS Model P. Sclavounos, MIT 2003
- 21. Arklow Banks Windfarm The Irish Sea Photo: R. Thresher
- 22. 440 metric tonnes Enercon 4.5MW 112 meter rotor Enercon Offshore Prototype
- 23. Design concept similar to offshore GE 1.5 / 70.5 Offshore GE 3.6 MW 104 meter rotor
- 24. NREL’s National Wind Technology Center Research and Development Basic & Applied Research & World-Class Testing Facilities
- 25. Infrared Image of a Bat Flying Through a Wind Turbine Rotor Multi-Stakeholder Wildlife Research National Wind
- 26. Wildlife-Related Research Data suggest the most significant avian wind-turbine interaction problem in the U.S. is in
- 27. Low Wind Speed Technology – Significance to U.S. Wind Industry Current Status of Wind Technology: Wind
- 28. Top Ten Wind Turbine Manufacturers Installed capacity, annual market share in 2010 Vestas 14.8% Sinovel 11.1%
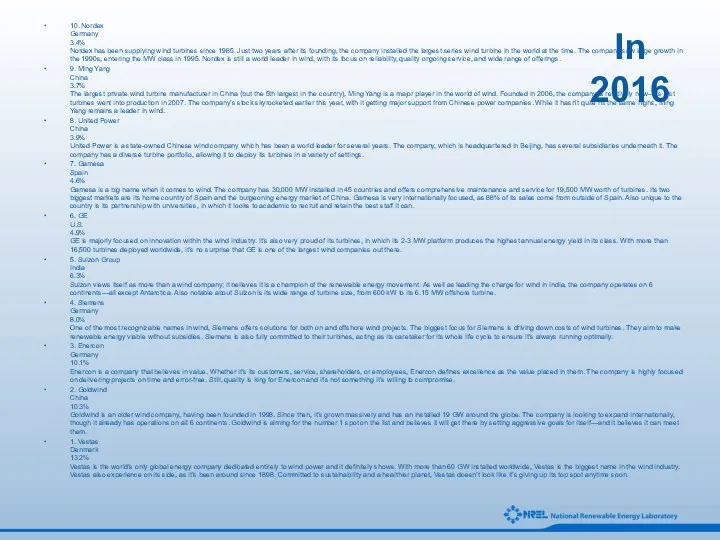
- 29. In 2016 http://www.energydigital.com/top10/3705/Top-10-Wind-Turbine-Suppliers 10. Nordex Germany 3.4% 9. Ming Yang China 3.7% 8. United Power China
- 30. In 2016 10. Nordex Germany 3.4% Nordex has been supplying wind turbines since 1985. Just two
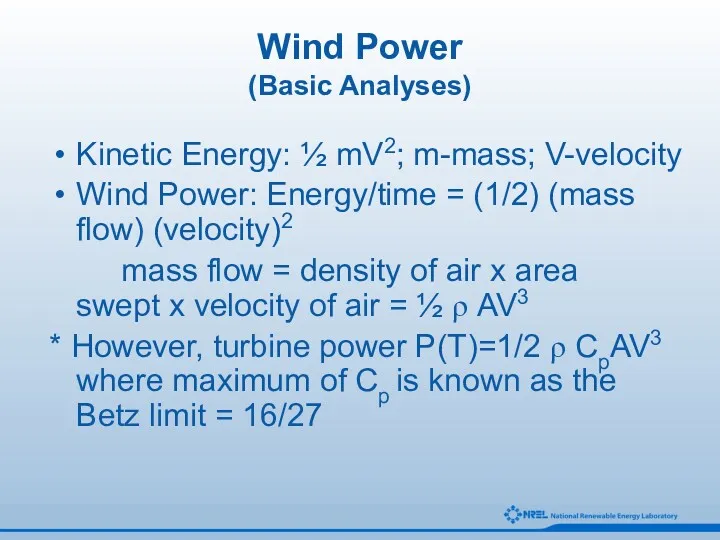
- 31. Wind Power (Basic Analyses) Kinetic Energy: ½ mV2; m-mass; V-velocity Wind Power: Energy/time = (1/2) (mass
- 32. Wind Power, cont’d. P(T) = ½ρCpA(ref)V3 ρ = air density f(z, T, humidity) V = f(x,y,z,t)
- 33. Wind Power, cont’d. The science and technology of wind power includes: aerodynamics/fluid mechanics Material science Meteorology
- 34. Theoretical and Actual Wind Power Curves
- 36. Instantaneous Wind Speed Sketch
- 37. Instantaneous Wind Speed Sketch
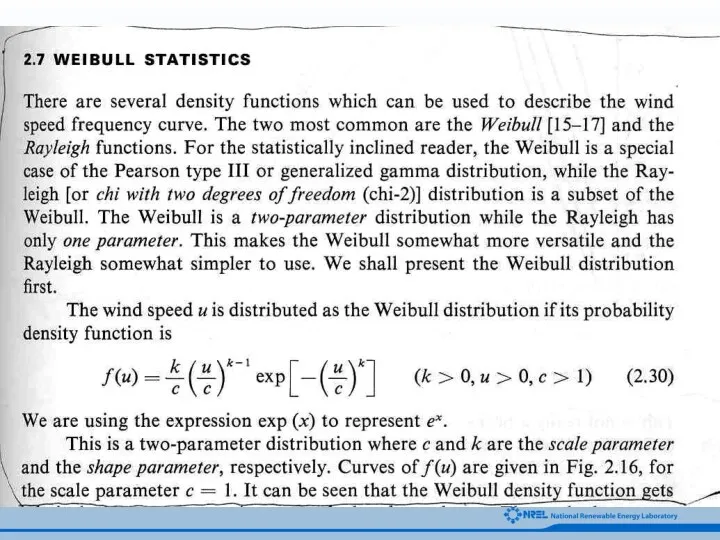
- 38. Statistical Distribution of Wind Power Weibull Statistics
- 39. Wind Energy Systems by Dr. Gary L. Johnson October 10, 2006
- 44. Weibull Density Function for Scale Parameter c = 1
- 45. Theoretical and Actual Wind Power Curves
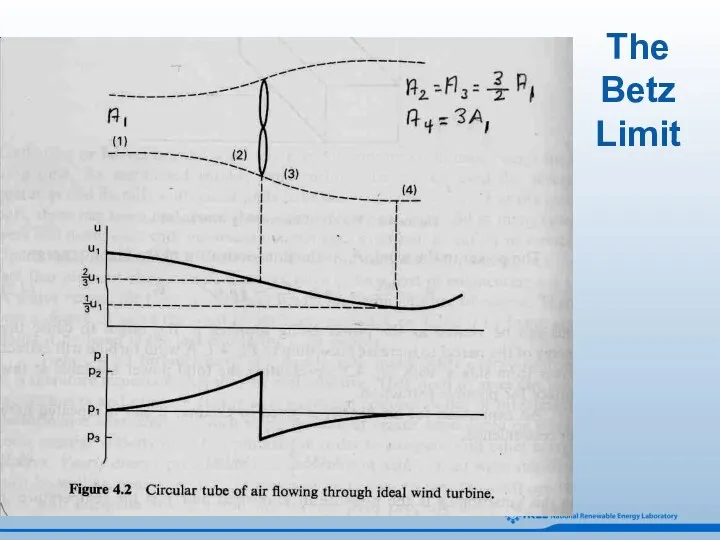
- 46. The Betz Limit
- 47. The Betz Limit
- 49. Wind Power (siting) Summary of Features of Suitable Site High annual average wind speed (consult local
- 50. The wind turbines are categorized into classes, corresponding to the average wind speed areas that they
- 51. Necessary to remember that the efficiency of the wind turbines are restricted by Betz Limit, approximately
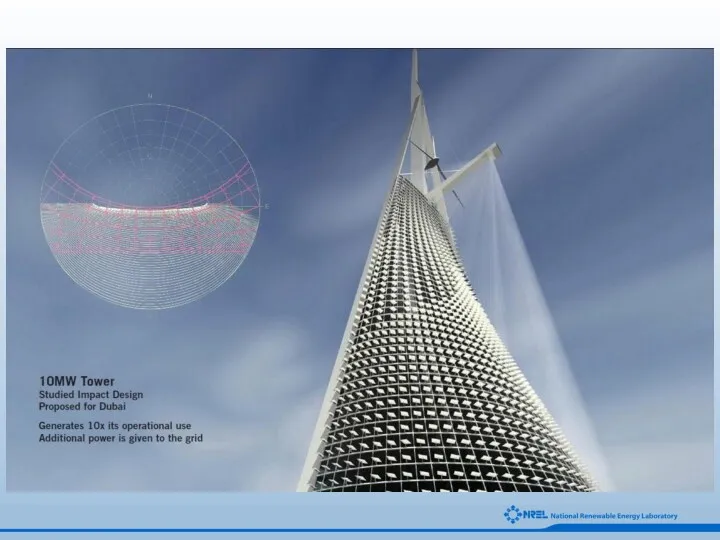
- 55. Bahrain world trade center with wind integrated turbines. Center opened in 2008, is a better example
- 56. A bridge that repurposes abandoned viaducts, produces energy AND looks futuristically sleek? Yes, it can be
- 61. An interesting work by Robert Ferry, founding partner of Studied Impact Design. The building combines a
- 63. Скачать презентацию
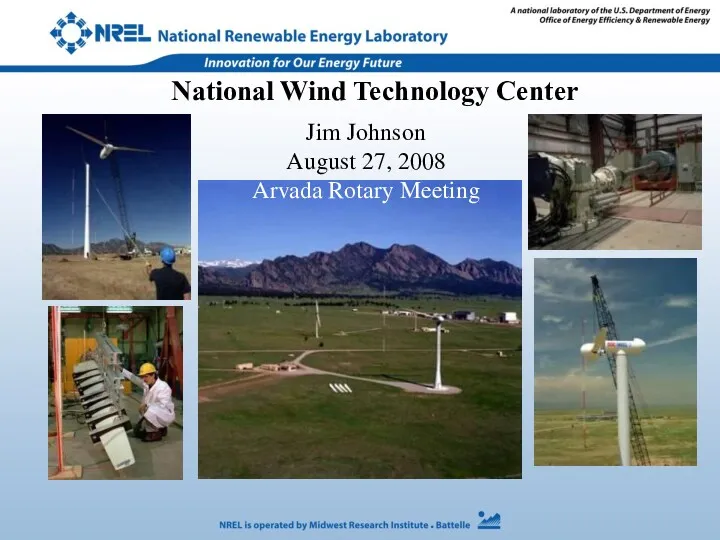
National Wind Technology Center
Jim Johnson
August 27, 2008
Arvada Rotary Meeting
National Wind Technology Center
Jim Johnson
August 27, 2008
Arvada Rotary Meeting
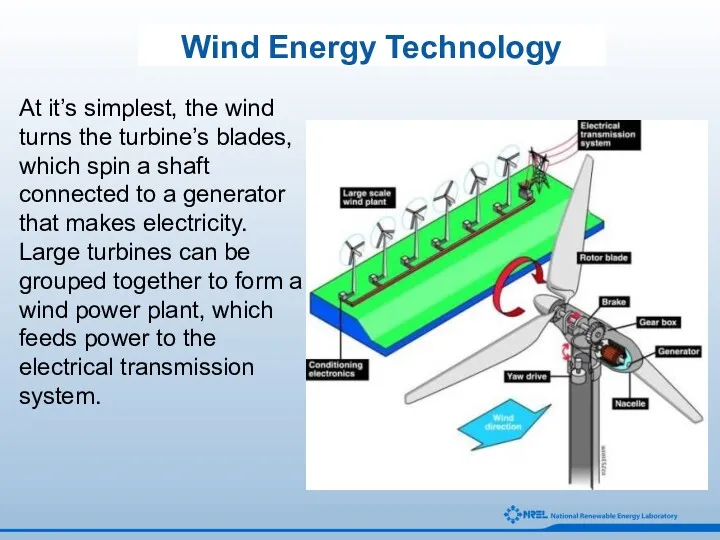
Wind Energy Technology
At it’s simplest, the wind turns the turbine’s blades,
Wind Energy Technology
At it’s simplest, the wind turns the turbine’s blades,
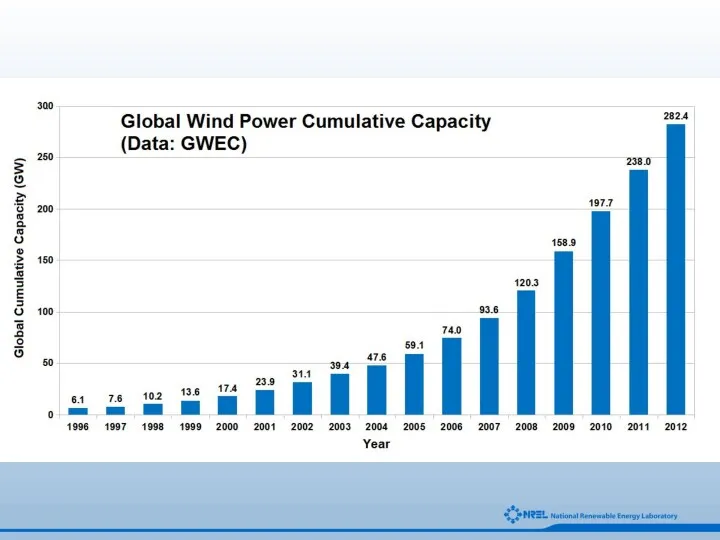
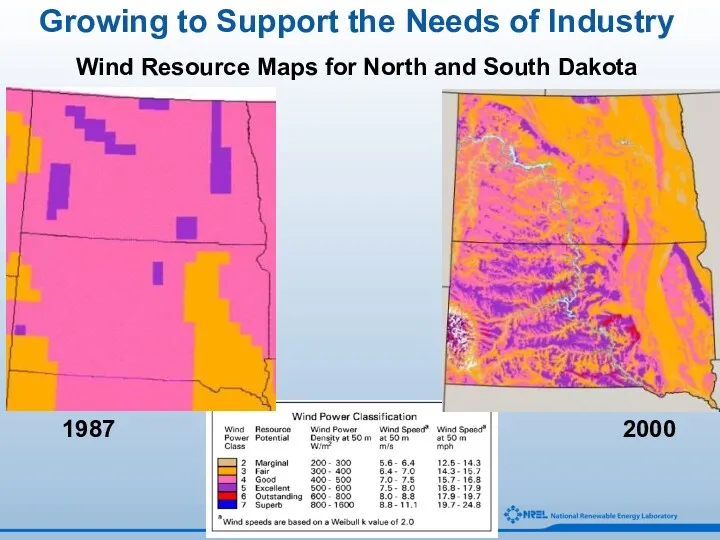
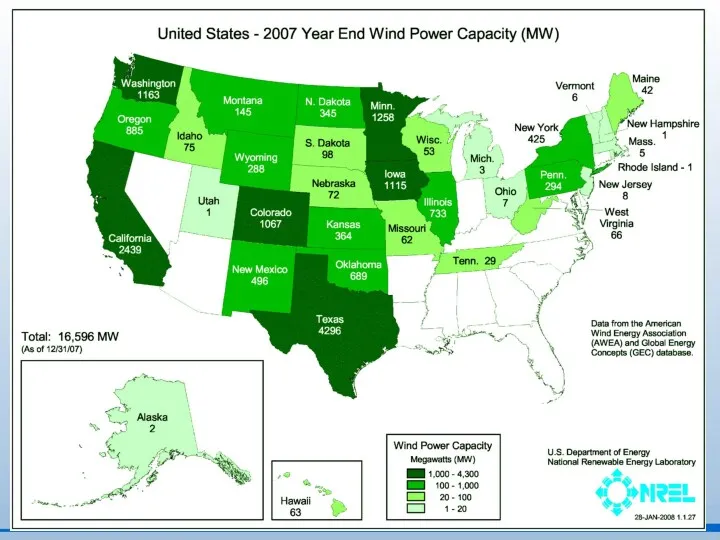
Growing to Support the Needs of Industry
Wind Resource Maps for North
Growing to Support the Needs of Industry
Wind Resource Maps for North
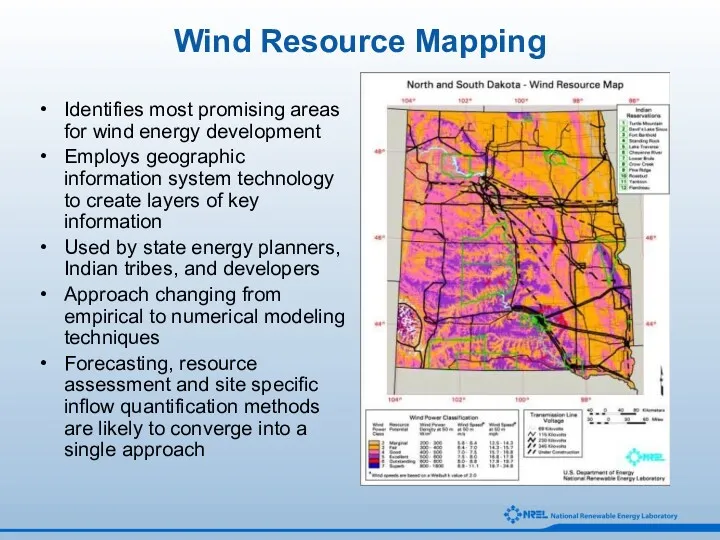
Wind Resource Mapping
Identifies most promising areas for wind energy development
Employs geographic
Wind Resource Mapping
Identifies most promising areas for wind energy development
Employs geographic
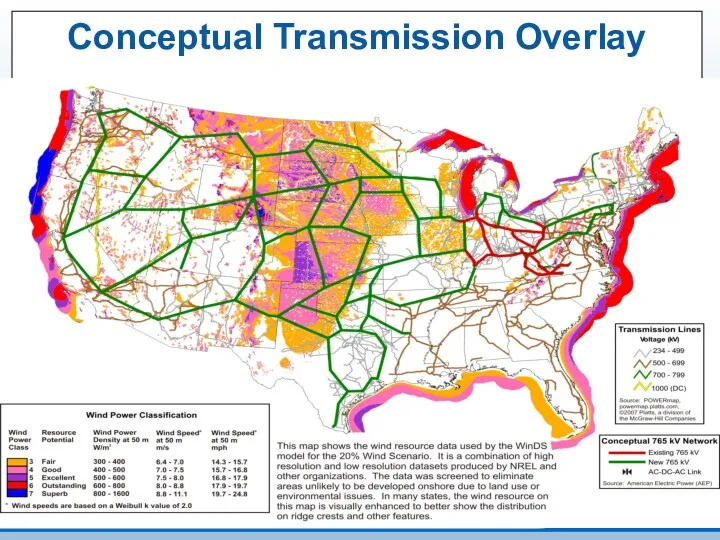
Conceptual Transmission Overlay
Conceptual Transmission Overlay
2
4
6
8
10
12
1990
COE (¢/kWh [constant 2000 $])
Low wind speed sites
1995
2000
2005
2010
2015
2020
High wind
speed sites
New Bulk
2
4
6
8
10
12
1990
COE (¢/kWh [constant 2000 $])
Low wind speed sites
1995
2000
2005
2010
2015
2020
High wind
speed sites
New Bulk
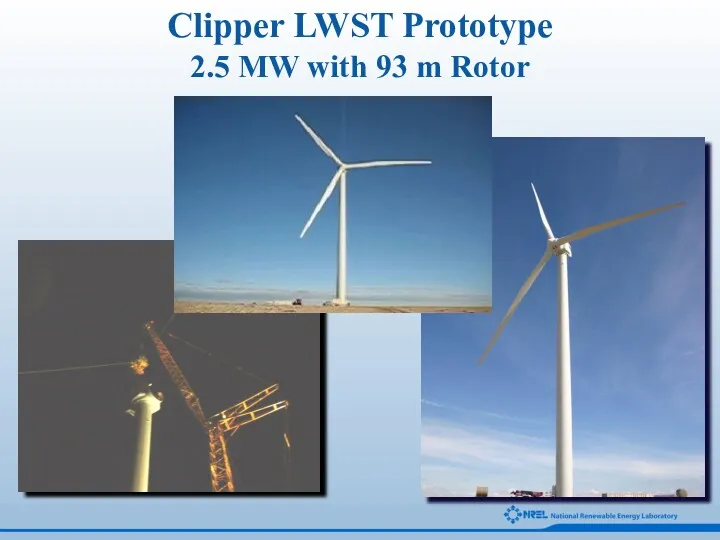
Clipper LWST Prototype
2.5 MW with 93 m Rotor
Clipper LWST Prototype
2.5 MW with 93 m Rotor
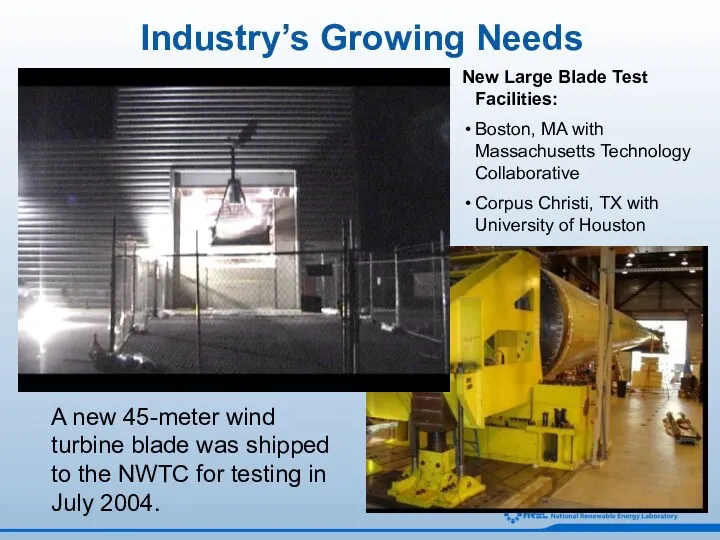
Industry’s Growing Needs
A new 45-meter wind turbine blade was shipped to
Industry’s Growing Needs
A new 45-meter wind turbine blade was shipped to
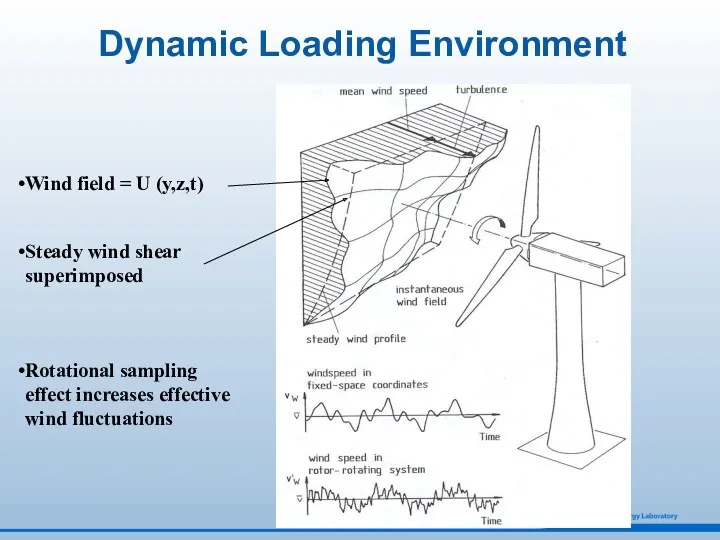
Wind field = U (y,z,t)
Steady wind shear superimposed
Rotational sampling effect increases
Wind field = U (y,z,t)
Steady wind shear superimposed
Rotational sampling effect increases
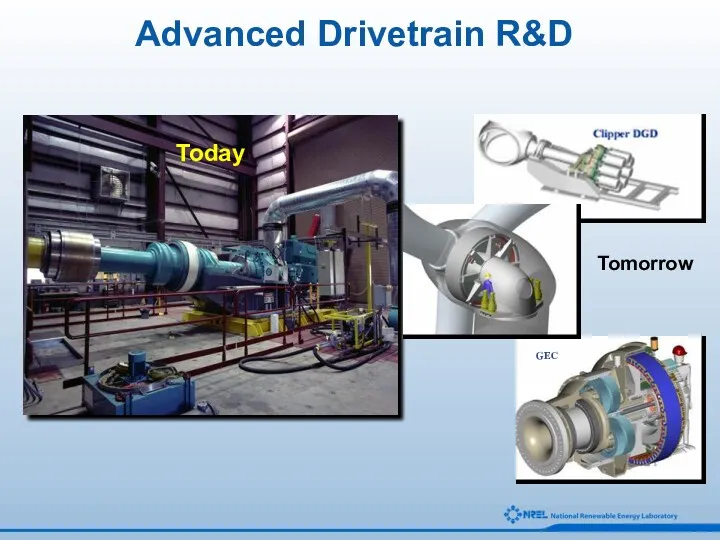
Advanced Drivetrain R&D
Today
Tomorrow
GEC
NPS
Advanced Drivetrain R&D
Today
Tomorrow
GEC
NPS
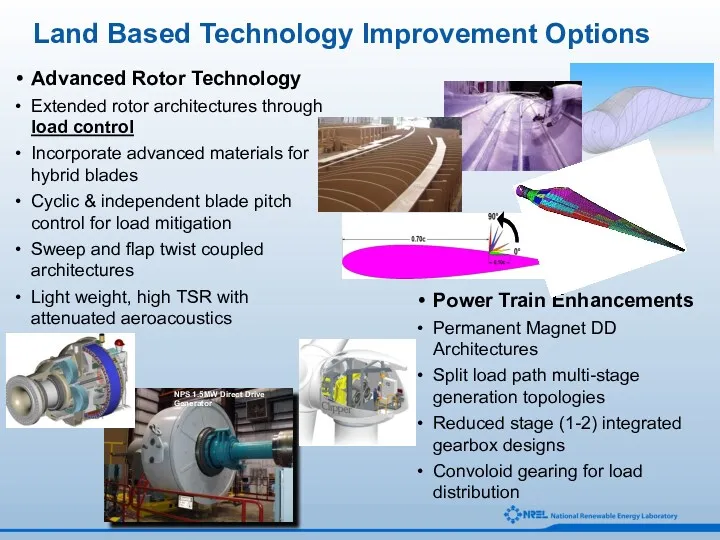
Land Based Technology Improvement Options
Advanced Rotor Technology
Extended rotor architectures through
Land Based Technology Improvement Options
Advanced Rotor Technology
Extended rotor architectures through
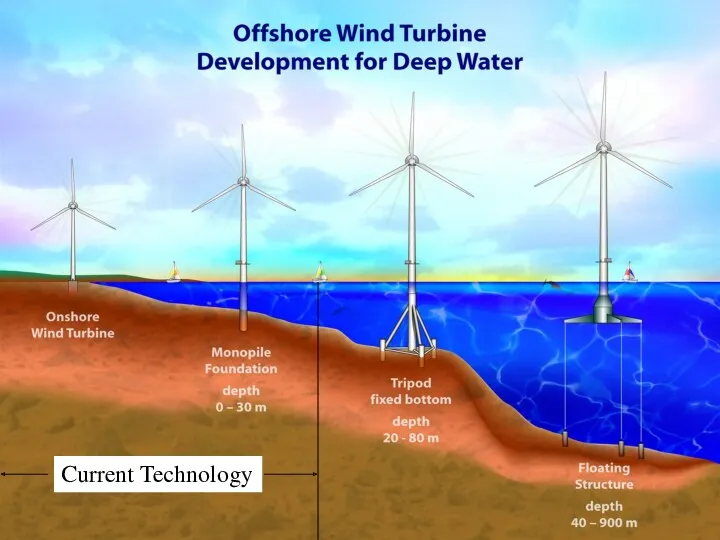
Deep Water Wind Turbine Development
Current Technology
Deep Water Wind Turbine Development
Current Technology
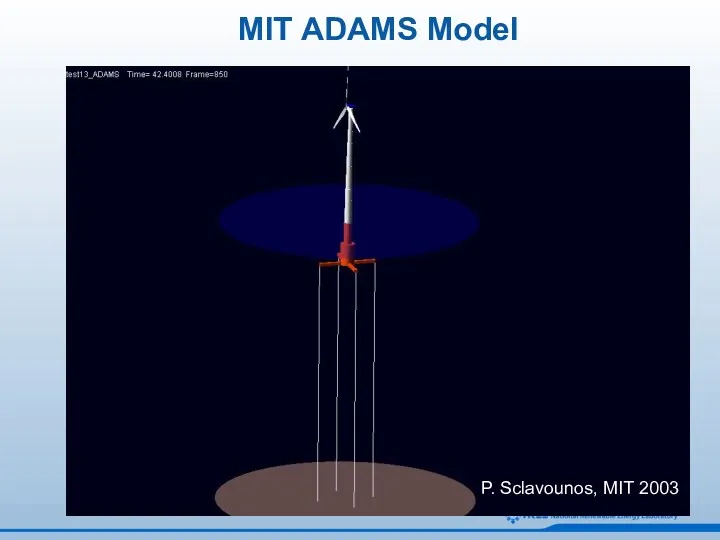
MIT ADAMS Model
P. Sclavounos, MIT 2003
MIT ADAMS Model
P. Sclavounos, MIT 2003
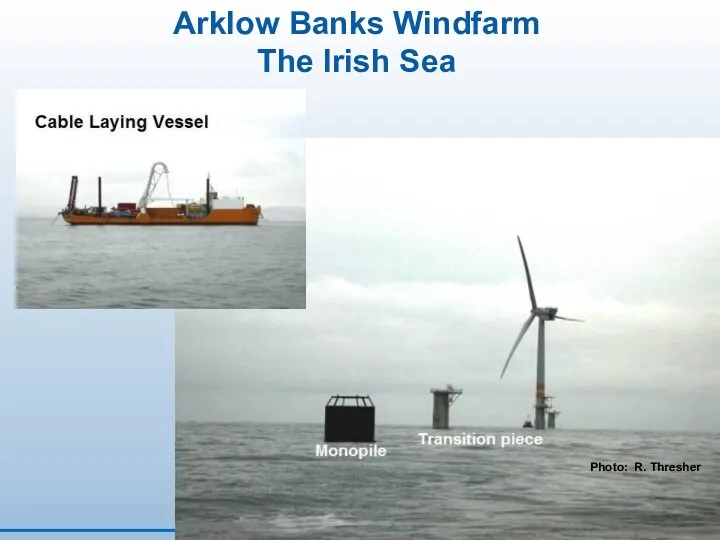
Arklow Banks Windfarm
The Irish Sea
Photo: R. Thresher
Arklow Banks Windfarm
The Irish Sea
Photo: R. Thresher
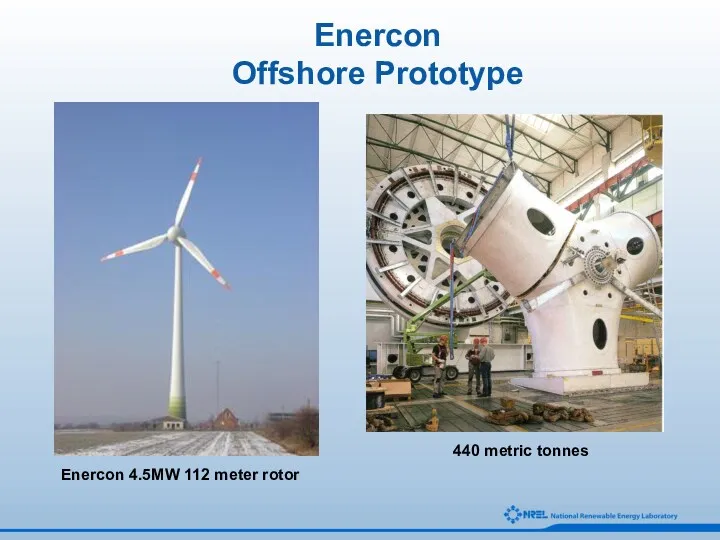
440 metric tonnes
Enercon 4.5MW 112 meter rotor
Enercon
Offshore Prototype
440 metric tonnes
Enercon 4.5MW 112 meter rotor
Enercon
Offshore Prototype
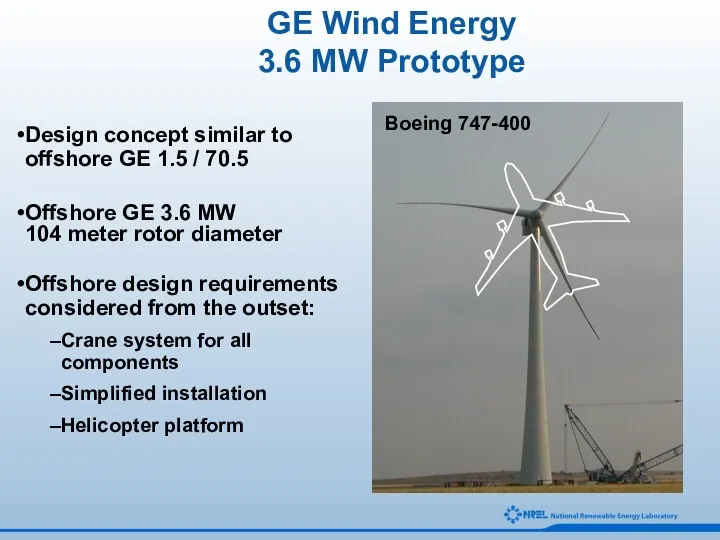
Design concept similar to
offshore GE 1.5 / 70.5
Offshore GE 3.6 MW
Design concept similar to
offshore GE 1.5 / 70.5
Offshore GE 3.6 MW
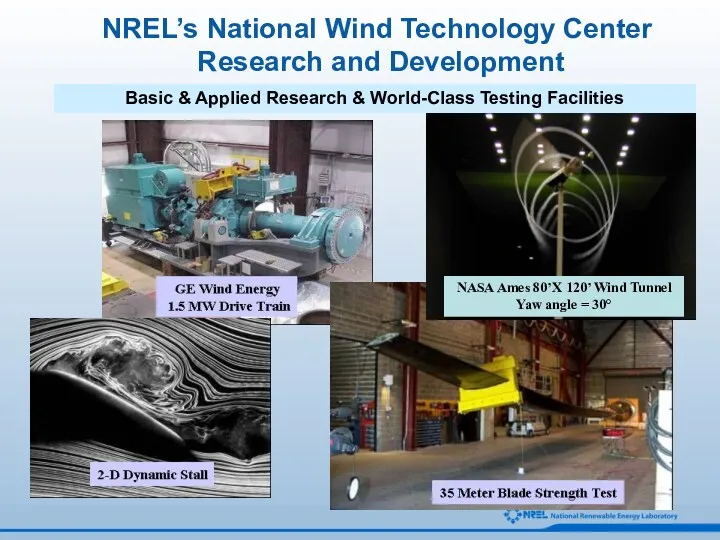
NREL’s National Wind Technology Center
Research and Development
Basic & Applied Research
NREL’s National Wind Technology Center
Research and Development
Basic & Applied Research
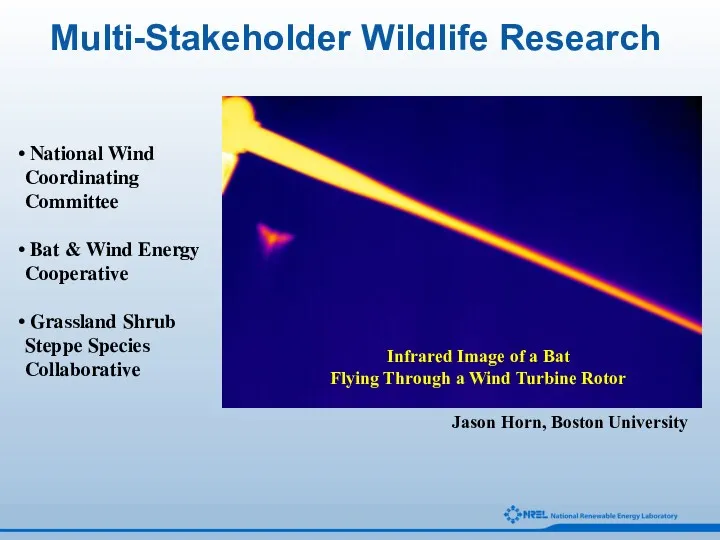
Infrared Image of a Bat
Flying Through a Wind Turbine Rotor
Multi-Stakeholder
Infrared Image of a Bat
Flying Through a Wind Turbine Rotor
Multi-Stakeholder
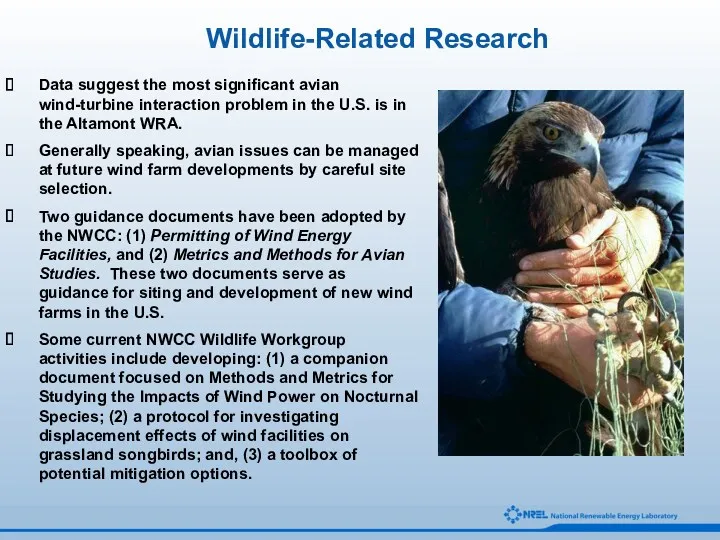
Wildlife-Related Research
Data suggest the most significant avian wind-turbine interaction problem in
Wildlife-Related Research
Data suggest the most significant avian wind-turbine interaction problem in
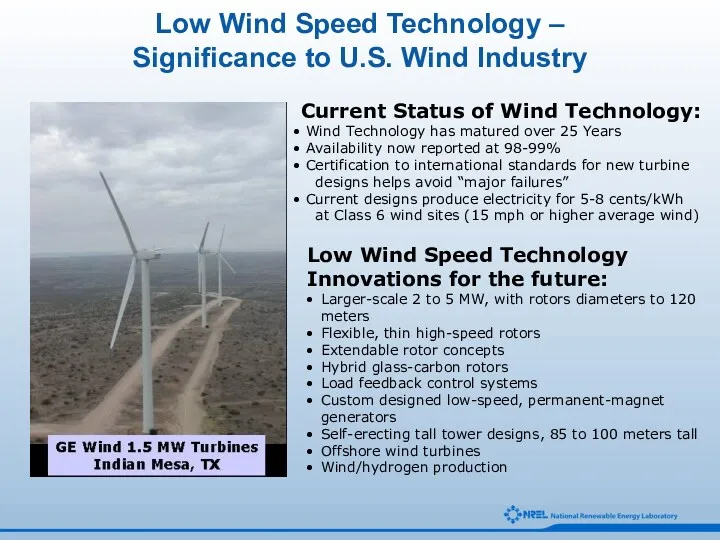
Low Wind Speed Technology –
Significance to U.S. Wind Industry
Current Status
Low Wind Speed Technology –
Significance to U.S. Wind Industry
Current Status
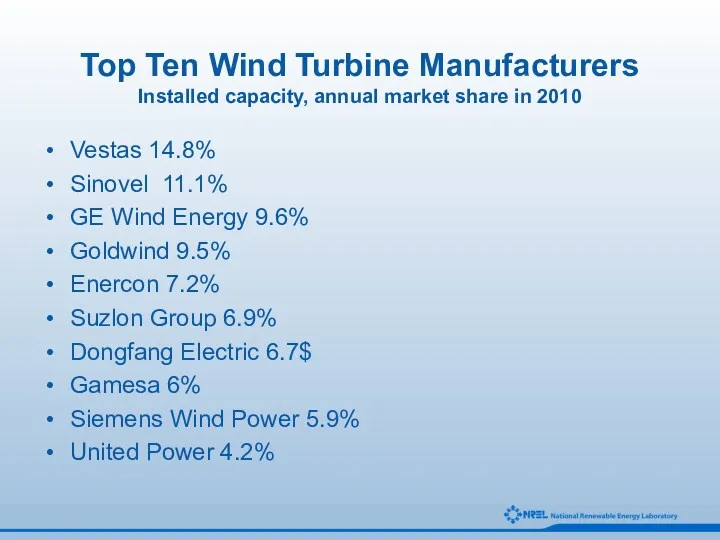
Top Ten Wind Turbine Manufacturers
Installed capacity, annual market share in 2010
Vestas
Top Ten Wind Turbine Manufacturers
Installed capacity, annual market share in 2010
Vestas
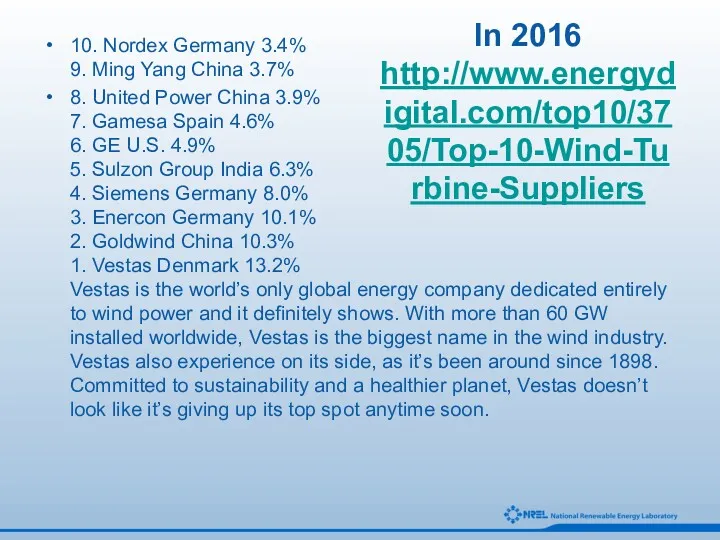
In 2016
http://www.energydigital.com/top10/3705/Top-10-Wind-Turbine-Suppliers
10. Nordex Germany 3.4%
9. Ming Yang China 3.7%
8. United
In 2016
http://www.energydigital.com/top10/3705/Top-10-Wind-Turbine-Suppliers
10. Nordex Germany 3.4%
9. Ming Yang China 3.7%
8. United
In 2016
10. Nordex
Germany
3.4%
Nordex has been supplying wind turbines since 1985. Just
In 2016
10. Nordex Germany 3.4% Nordex has been supplying wind turbines since 1985. Just
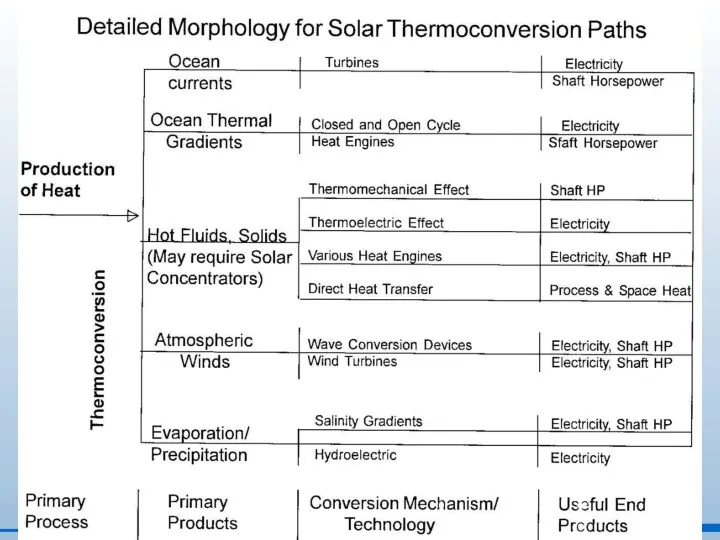
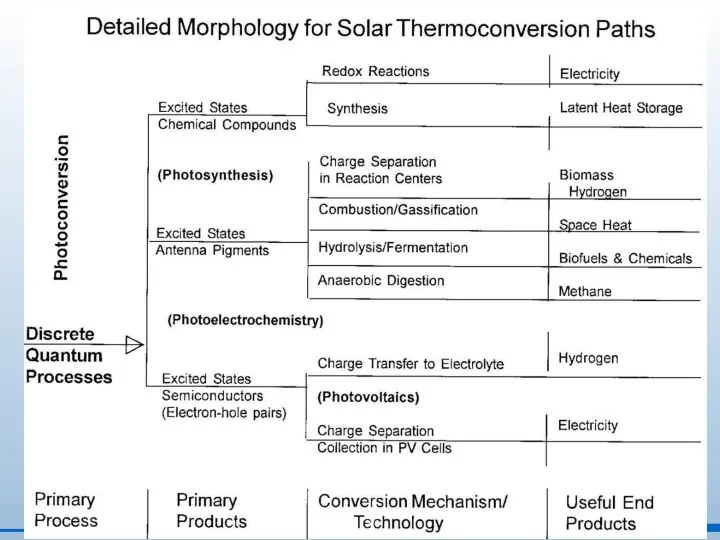
Wind Power
(Basic Analyses)
Kinetic Energy: ½ mV2; m-mass; V-velocity
Wind Power: Energy/time =
Wind Power
(Basic Analyses)
Kinetic Energy: ½ mV2; m-mass; V-velocity
Wind Power: Energy/time =
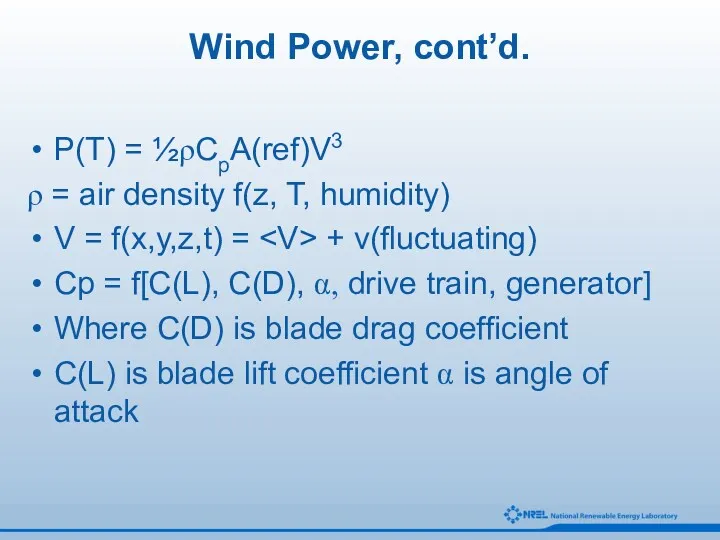
Wind Power, cont’d.
P(T) = ½ρCpA(ref)V3
ρ = air density f(z, T, humidity)
V
Wind Power, cont’d.
P(T) = ½ρCpA(ref)V3
ρ = air density f(z, T, humidity)
V
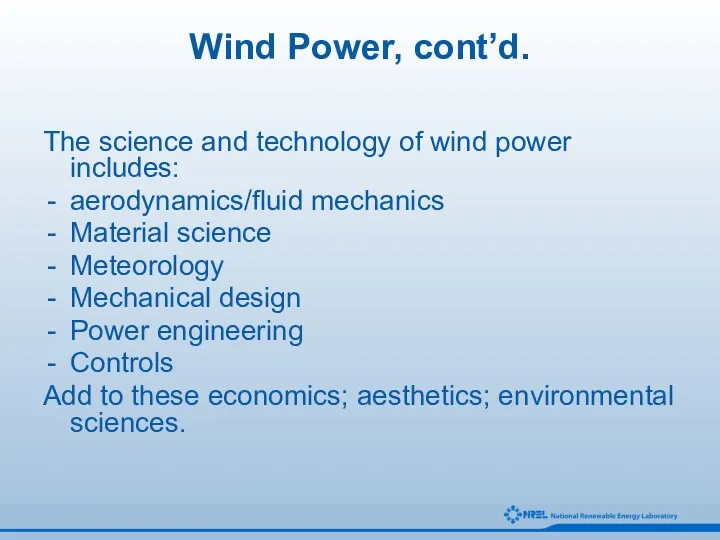
Wind Power, cont’d.
The science and technology of wind power includes:
aerodynamics/fluid mechanics
Material
Wind Power, cont’d.
The science and technology of wind power includes:
aerodynamics/fluid mechanics
Material
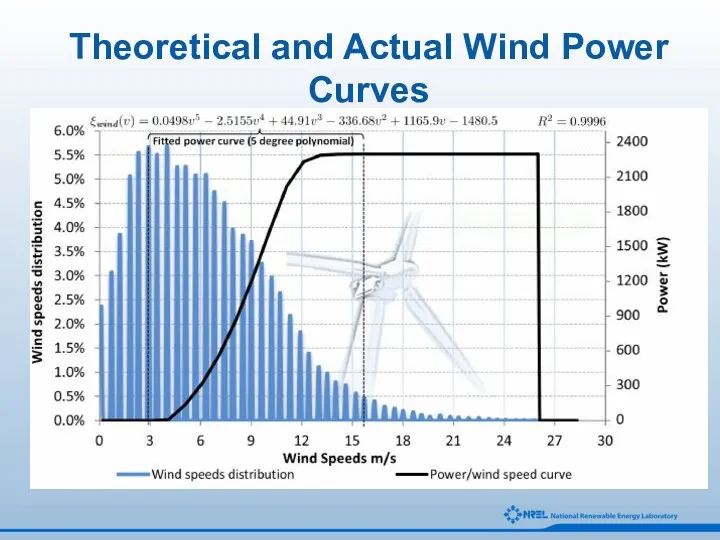
Theoretical and Actual Wind Power Curves
Theoretical and Actual Wind Power Curves
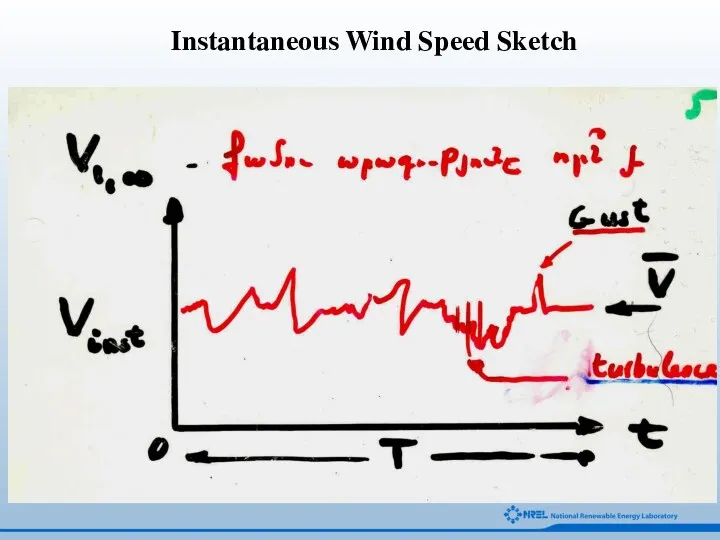
Instantaneous Wind Speed Sketch
Instantaneous Wind Speed Sketch
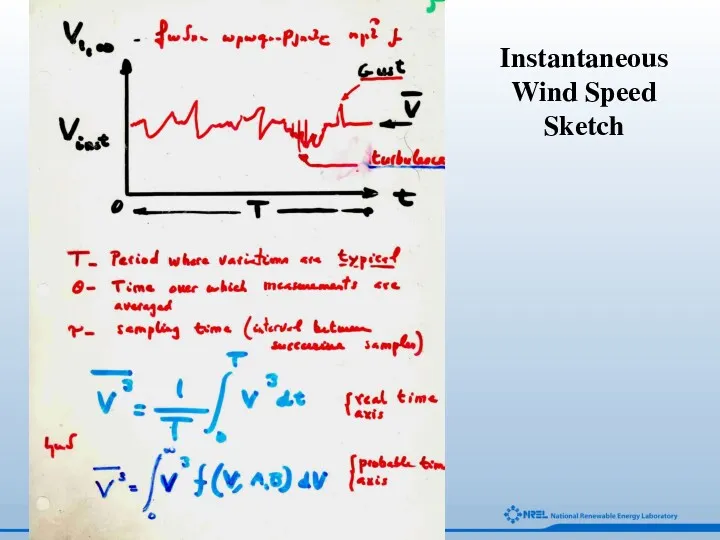
Instantaneous Wind Speed Sketch
Instantaneous Wind Speed Sketch
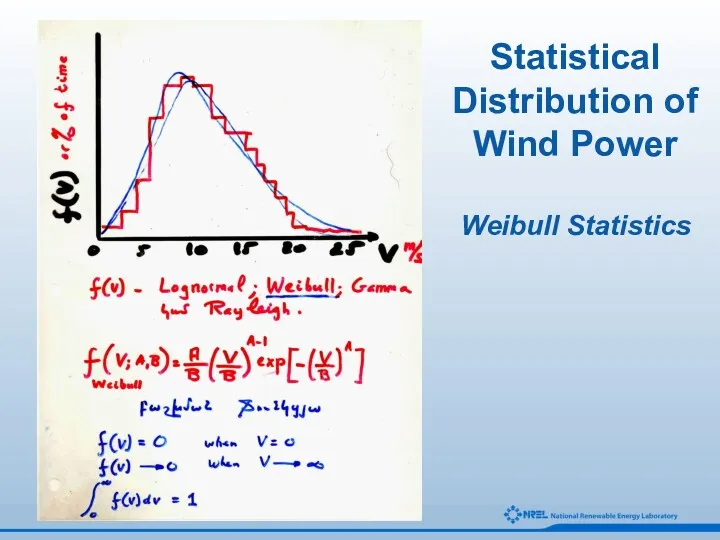
Statistical Distribution of Wind Power
Weibull Statistics
Statistical Distribution of Wind Power
Weibull Statistics
Wind Energy Systems by Dr. Gary L. Johnson October 10, 2006
Wind Energy Systems by Dr. Gary L. Johnson October 10, 2006
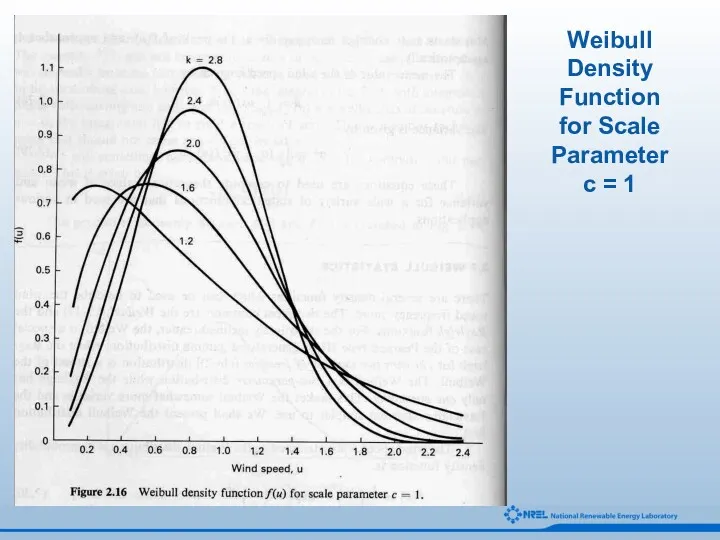
Weibull Density Function for Scale Parameter c = 1
Weibull Density Function for Scale Parameter c = 1
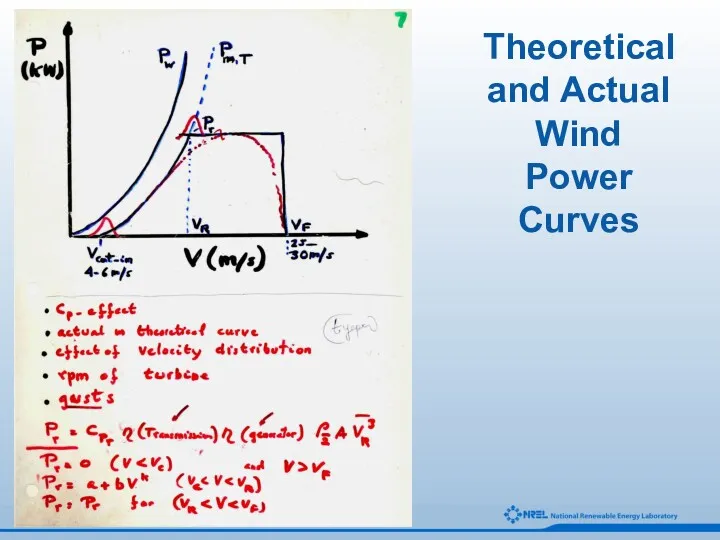
Theoretical and Actual Wind Power Curves
Theoretical and Actual Wind Power Curves

The Betz Limit
The Betz Limit
The Betz Limit
The Betz Limit
Wind Power (siting)
Summary of Features of Suitable Site
High annual average wind
Wind Power (siting)
Summary of Features of Suitable Site
High annual average wind
The wind turbines are categorized into classes, corresponding to the average
The wind turbines are categorized into classes, corresponding to the average
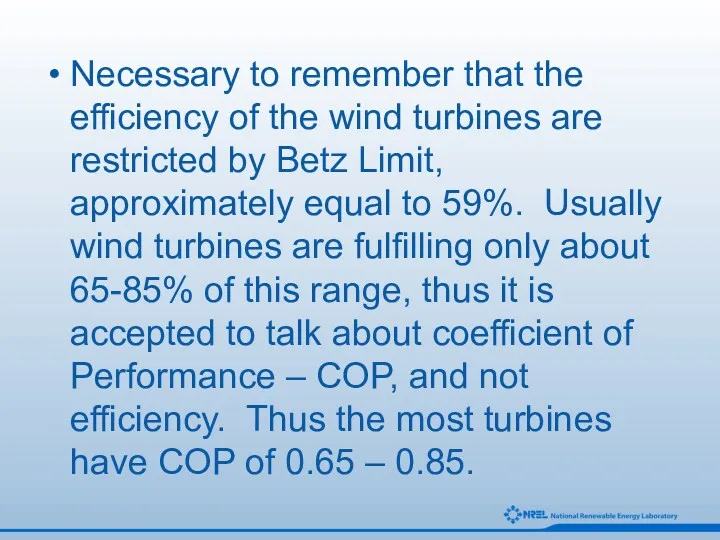
Necessary to remember that the efficiency of the wind turbines are
Necessary to remember that the efficiency of the wind turbines are
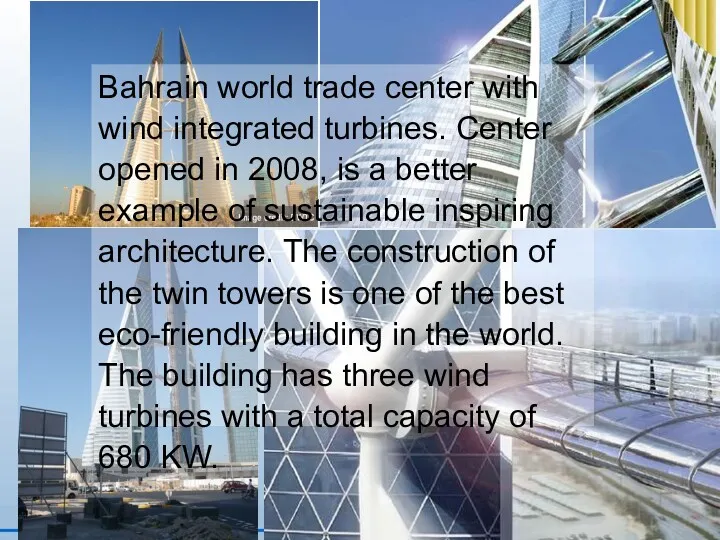
Bahrain world trade center with wind integrated turbines. Center opened in
Bahrain world trade center with wind integrated turbines. Center opened in
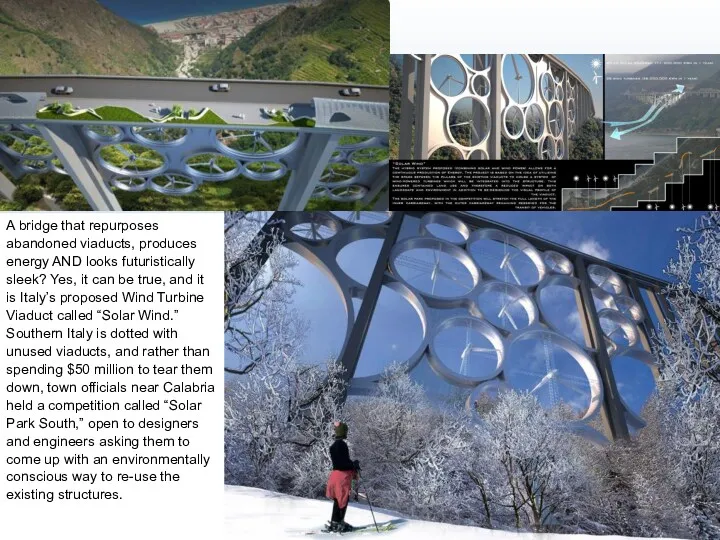
A bridge that repurposes abandoned viaducts, produces energy AND looks futuristically
A bridge that repurposes abandoned viaducts, produces energy AND looks futuristically

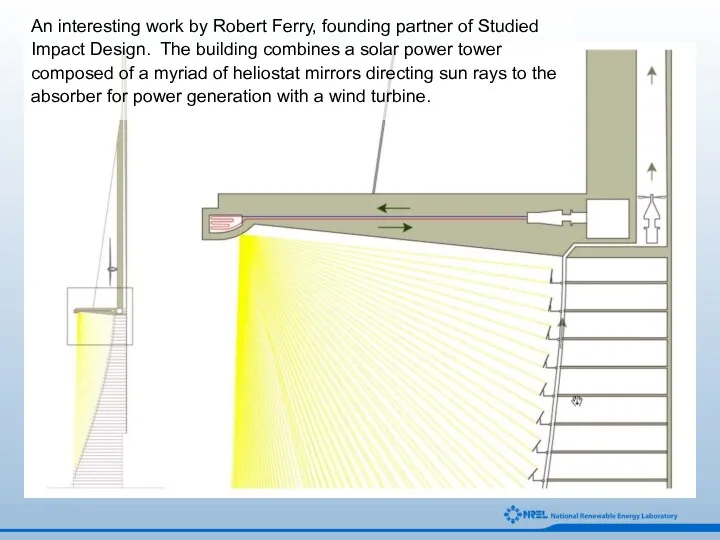
An interesting work by Robert Ferry, founding partner of Studied Impact
An interesting work by Robert Ferry, founding partner of Studied Impact
 Задачи на машины постоянного тока. Лекция 1
 Игра по физике Тайна черных ящиков для учащихся 10-11 классов
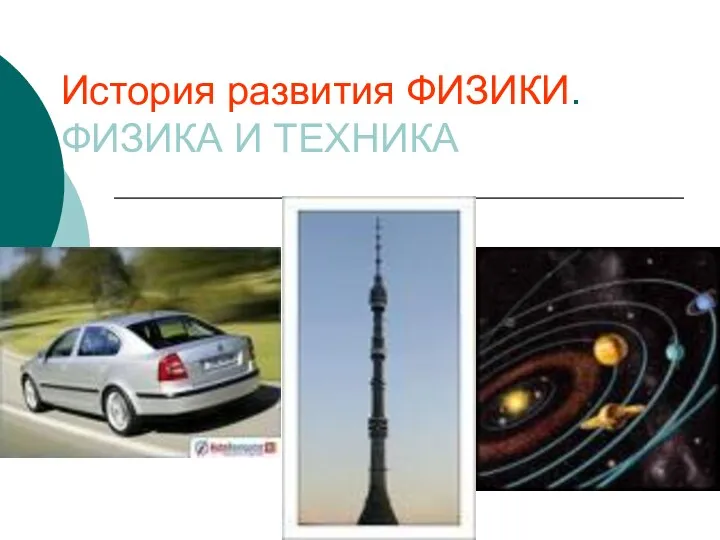 История развития физики. Физика и техника
 Познавательная викторина
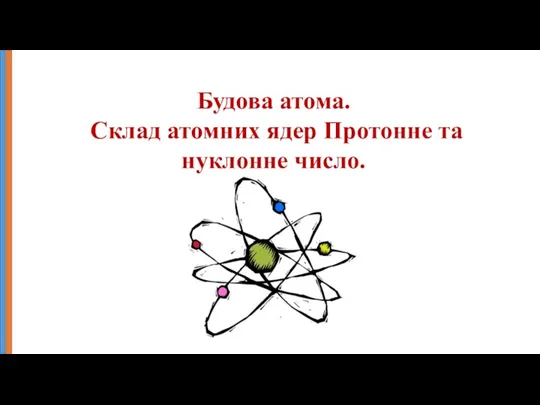 Будова атома. Склад атомних ядер. Протонне та нуклонне число
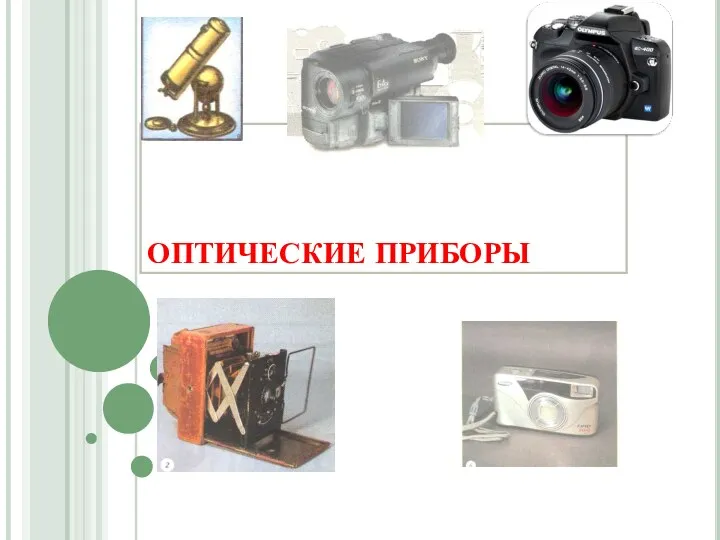 Урок Оптические приборы, физика11 класс
 БЛОКИ. «ЗОЛОТОЕ ПРАВИЛО МЕХАНИКИ»
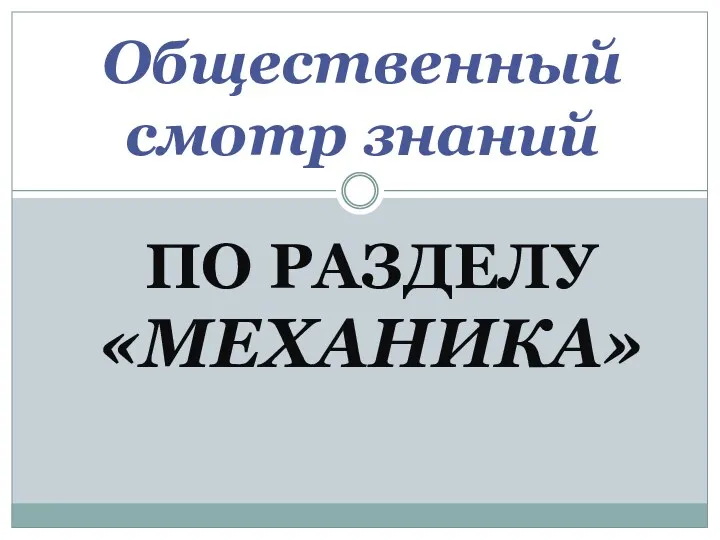 Общественному смотр знаний в 9классе по разделу Механика.
 Разработка внеклассного мероприятия Физический КВН (8 класс)
 Адсорбция изотермалары
 ФОРМИРОВАНИЕ ИНФОРМАЦИОННОЙ КОМПЕТЕНЦИИ УЧАЩИХСЯ ПРИ ИЗУЧЕНИИ ТЕМЫ ЭЛЕМЕНТЫ КВАНТОВОЙ ФИЗИКИ9 КЛАСС
 Радиоактивность, модели атомов
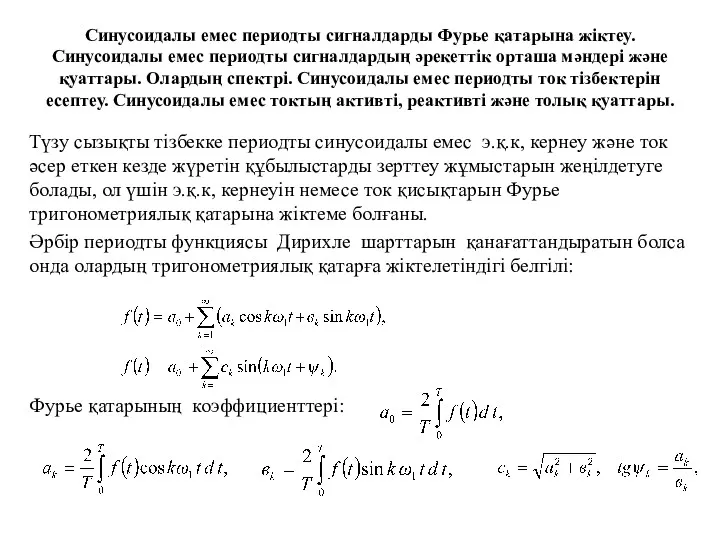 Синусоидалы емес периодты сигналдарды Фурье қатарына жіктеу. Синусоидалы емес периодты сигналдардың әрекеттік орташа мәндері
 Система живлення двигуна УТД-20С1 повітрям
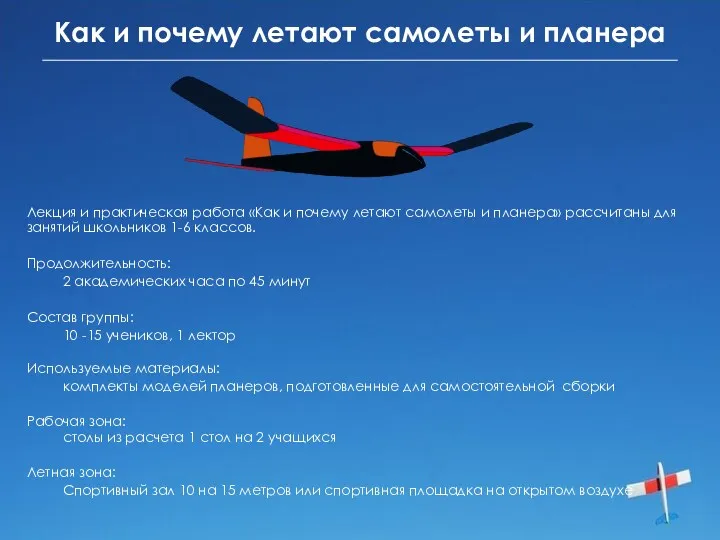 Как и почему летают самолеты и планера
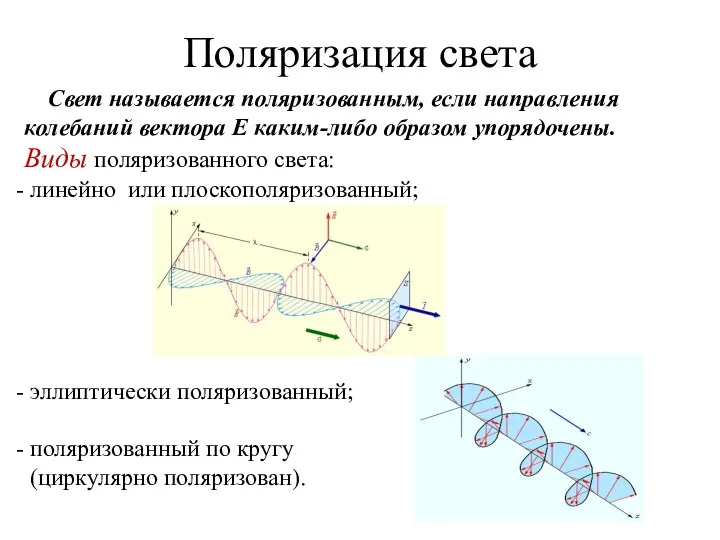 Поляризация света
 Ядерная физика. (Урок-обобщение). 9 класс
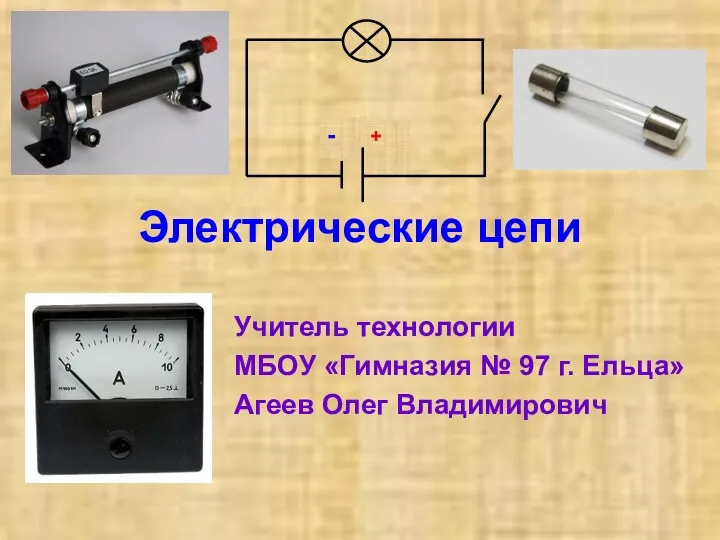 Электрические цепи
 Принцип действия тепловых двигателей
 Физика и техника
 Качественные задачи по физике
 Повышение качества образования по предмету физика через систему использования интегрированных уроков в условиях модернизации образовательной системы РФ
 Рентгеновские аппараты. Цифровые рентгенодиагностические комплексы. (Лекция 10)
 Первый закон термодинамики
 Сила упругости
 Основы триботехники. Лекция 1
 Лекция 8.2. Диэлектрические материалы. Классификация
 Анализ технико-экономической эффективности КПГУ на базе паротурбинной установки ПТ-135/165-130/15