- A Display Model and Graphics Classes

Содержание
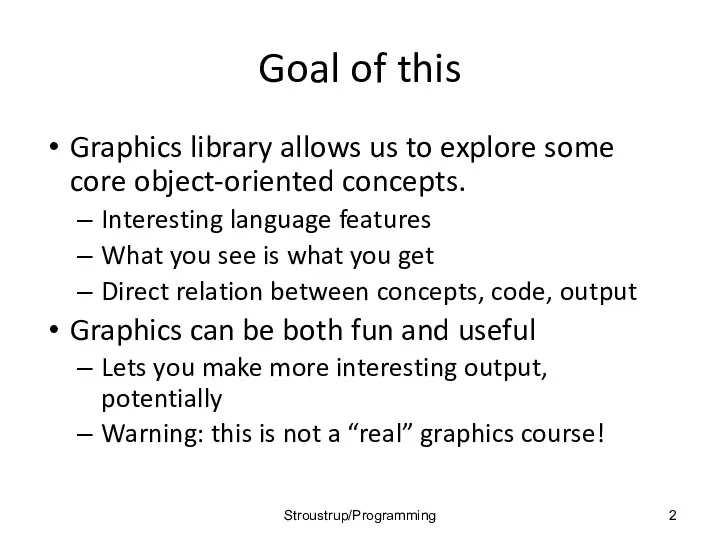
- 2. Goal of this Graphics library allows us to explore some core object-oriented concepts. Interesting language features
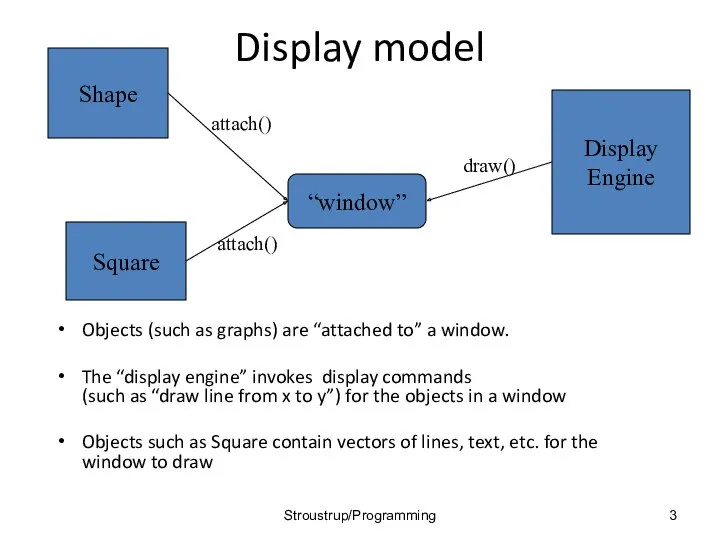
- 3. Display model Objects (such as graphs) are “attached to” a window. The “display engine” invokes display
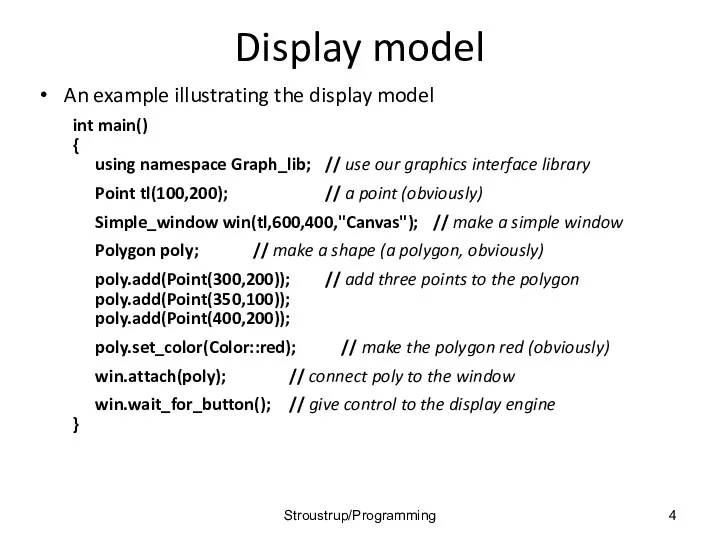
- 4. Display model An example illustrating the display model int main() { using namespace Graph_lib; // use
- 5. The resulting screen Stroustrup/Programming
- 6. Graphics/GUI libraries You’ll be using a few interface classes we wrote Interfacing to a popular GUI
- 7. Graphics/GUI libraries (cont.) The code is portable Windows, Unix, Mac, etc. This model extends to most
- 8. Graphics/GUI libraries Often called “a layered architecture” Stroustrup/Programming
- 9. Interface classes An arrow means “is a kind of” Color, Line_style, and Point are “utility classes”
- 10. Interface classes Current Color, Line_style, Font, Point, Window, Simple_window Shape, Text, Polygon, Line, Lines, Rectangle, …
- 11. Coordinates Oddly, y-coordinates “grow downwards” // right, down Coordinates identify pixels in the window on the
- 12. Demo code 1 // Getting access to the graphics system (don’t forget to install): #include "Simple_window.h"
- 13. A “blank canvas” Stroustrup/Programming
- 14. Demo code 2 Axis xa(Axis::x, Point(20,300), 280, 10, "x axis"); // make an Axis // an
- 15. Add an X-axis Stroustrup/Programming
- 16. Demo code 3 win.set_label("Canvas #3"); Axis ya(Axis::y, Point(20,300), 280, 10, "y axis"); ya.set_color(Color::cyan); // choose a
- 17. Add a Y-axis (colored) Yes, it’s ugly, but this is a programming course, not a graphics
- 18. Demo code 4 win.set_label("Canvas #4"); Function sine(sin,0,100,Point(20,150),1000,50,50); // sine curve // plot sin() in the range
- 19. Add a sine curve Stroustrup/Programming
- 20. Demo code 5 win.set_label("Canvas #5"); sine.set_color(Color::blue); // I changed my mind about sine’s color Polygon poly;
- 21. Add a triangle (and color the curve) Stroustrup/Programming
- 22. Demo code 6 win.set_label("Canvas #6"); Rectangle r(Point(200,200), 100, 50); // top left point, width, height win.attach(r);
- 23. Add a rectangle Stroustrup/Programming
- 24. Demo code 6.1 Add a shape that looks like a rectangle Closed_polyline poly_rect; poly_rect.add(Point(100,50)); poly_rect.add(Point(200,50)); poly_rect.add(Point(200,100));
- 25. Add a shape that looks like a rectangle But is it a rectangle? Stroustrup/Programming
- 26. Demo code 6.2 We can add a point poly_rect.add(Point(50,75); // now poly_rect has 5 points win.set_label("Canvas
- 27. Obviously a polygon Stroustrup/Programming
- 28. Add fill r.set_fill_color(Color::yellow); // color the inside of the rectangle poly.set_style(Line_style(Line_style::dash,4)); // make the triangle fat
- 29. Add fill Stroustrup/Programming
- 30. Demo Code 8 Text t(Point(100,100),"Hello, graphical world!"); // add text // point is lower left corner
- 31. Add text Stroustrup/Programming
- 32. Demo Code 9 Modify text font and size t.set_font(Font::times_bold); t.set_font_size(20); // height in pixels Stroustrup/Programming
- 33. Text font and size Stroustrup/Programming
- 34. Add an image Image ii(Point(100,50),"image.jpg"); // open an image file win.attach(ii); win.set_label("Canvas #10"); Stroustrup/Programming
- 35. Add an image Stroustrup/Programming
- 36. Oops! The image obscures the other shapes Move it a bit out of the way ii.move(100,200);
- 37. Move the image Note how the parts of a shape that don’t fit in the window
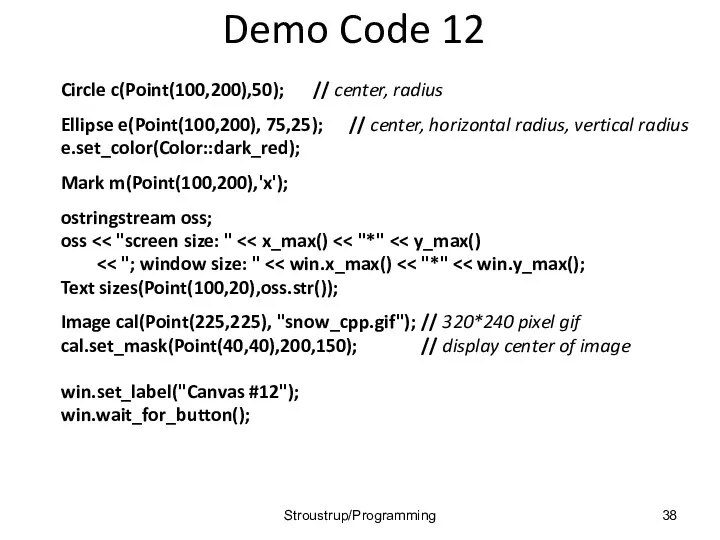
- 38. Demo Code 12 Circle c(Point(100,200),50); // center, radius Ellipse e(Point(100,200), 75,25); // center, horizontal radius, vertical
- 39. Add shapes, more text Stroustrup/Programming
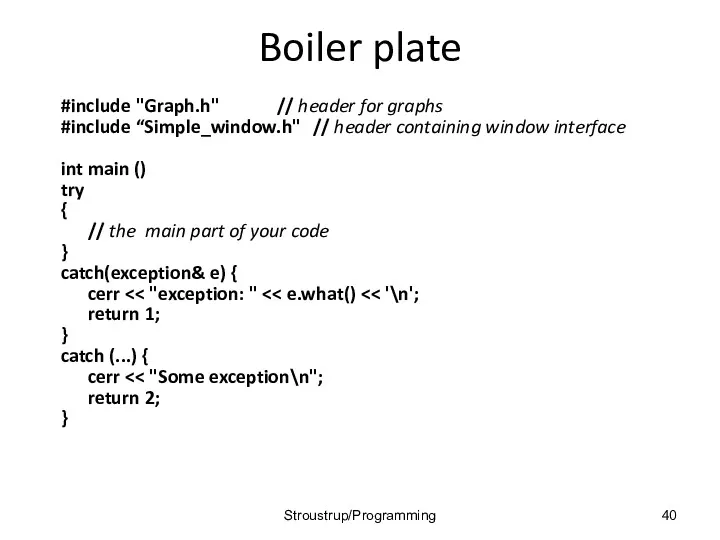
- 40. Boiler plate #include "Graph.h" // header for graphs #include “Simple_window.h" // header containing window interface int
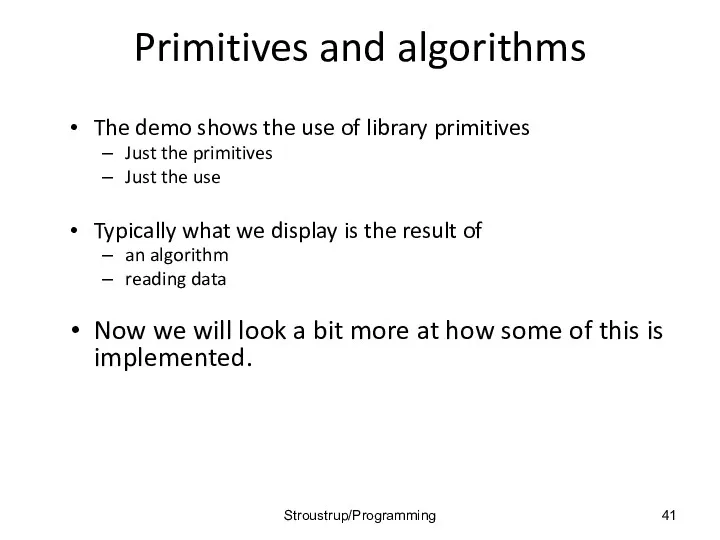
- 41. Primitives and algorithms The demo shows the use of library primitives Just the primitives Just the
- 42. Display model Objects (such as graphs) are “attached to” (“placed in”) a window. The “display engine”
- 43. Code organization GUI.h: Point.h: Stroustrup/Programming
- 44. Source files Header File that contains interface information (declarations) #include in user and implementer .cpp (“code
- 45. Design note The ideal of program design is to represent concepts directly in code We take
- 46. Point namespace Graph_lib // our graphics interface is in Graph_lib { struct Point // a Point
- 47. Line struct Shape { // hold lines represented as pairs of points // knows how to
- 48. Line example // draw two lines: using namespace Graph_lib; Simple_window win(Point(100,100),600,400,"Canvas"); // make a window Line
- 49. Line example Stroustrup/Programming
- 50. Line example Individual lines are independent horizontal.set_color(Color::red); vertical.set_color(Color::green); Stroustrup/Programming
- 51. Lines struct Lines : Shape { // a Lines object is a set of lines //
- 52. Lines Example Lines x; x.add(Point(100,100), Point(200,100)); // horizontal line x.add(Point(150,50), Point(150,150)); // vertical line win.attach(x); //
- 53. Lines example Looks exactly like the two Lines example Stroustrup/Programming
- 54. Implementation: Lines void Lines::add(Point p1, Point p2) // use Shape’s add() { Shape::add(p1); Shape::add(p2); } void
- 55. Draw Grid (Why bother with Lines when we have Line?) // A Lines object may hold
- 56. Grid Stroustrup/Programming Oops! Last column is narrow, there's a grid line on top of the Next
- 57. Color struct Color { // Map FLTK colors and scope them; // deal with visibility/transparency enum
- 58. Draw red grid grid.set_color(Color::red); Stroustrup/Programming
- 59. Line_style struct Line_style { enum Line_style_type { solid=FL_SOLID, // ------- dash=FL_DASH, // - - - -
- 60. Example: colored fat dash grid grid.set_style(Line_style(Line_style::dash,2)); Stroustrup/Programming
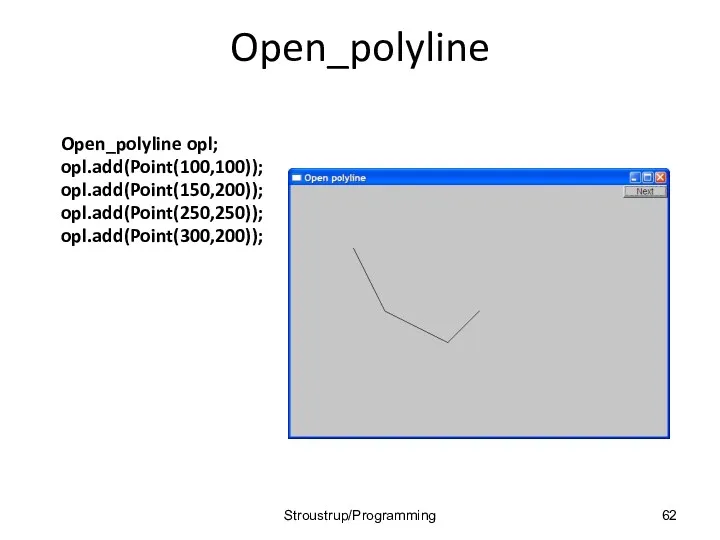
- 61. Polylines struct Open_polyline : Shape { // open sequence of lines void add(Point p) { Shape::add(p);
- 62. Open_polyline Open_polyline opl; opl.add(Point(100,100)); opl.add(Point(150,200)); opl.add(Point(250,250)); opl.add(Point(300,200)); Stroustrup/Programming
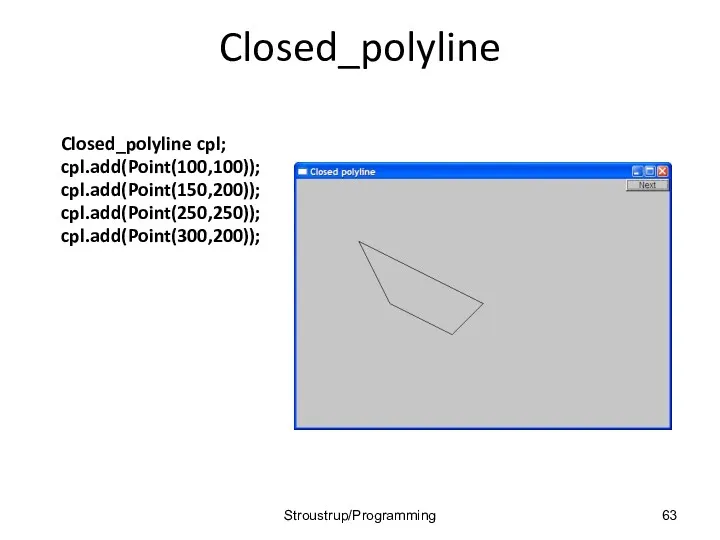
- 63. Closed_polyline Closed_polyline cpl; cpl.add(Point(100,100)); cpl.add(Point(150,200)); cpl.add(Point(250,250)); cpl.add(Point(300,200)); Stroustrup/Programming
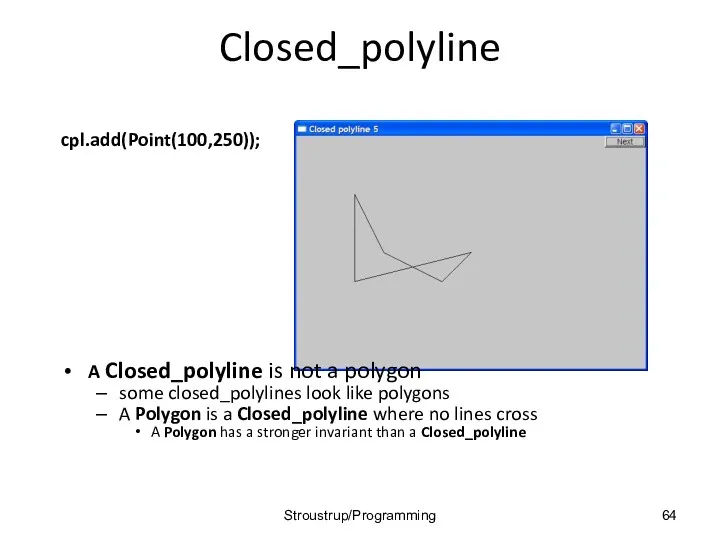
- 64. Closed_polyline cpl.add(Point(100,250)); A Closed_polyline is not a polygon some closed_polylines look like polygons A Polygon is
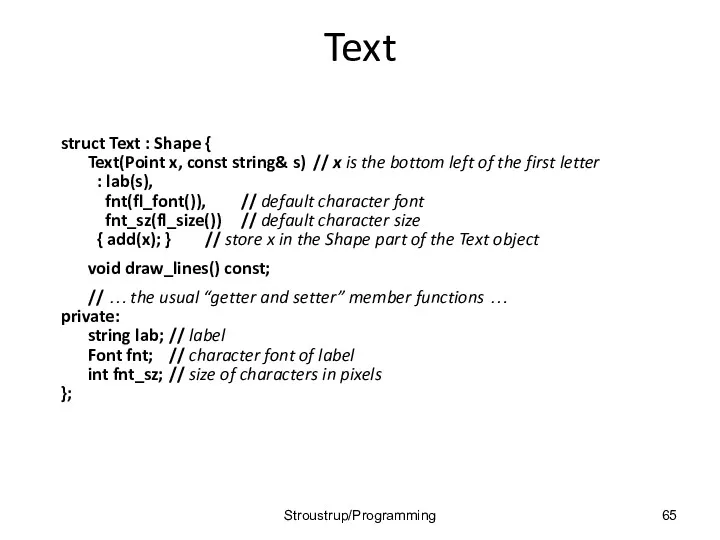
- 65. Text struct Text : Shape { Text(Point x, const string& s) // x is the bottom
- 66. Add text Text t(Point(200,200), "A closed polyline that isn’t a polygon"); t.set_color(Color::blue); Stroustrup/Programming
- 67. Implementation: Text void Text::draw_lines() const { fl_draw(lab.c_str(), point(0).x, point(0).y); } // fl_draw() is a basic text
- 68. Color matrix Let’s draw a color matrix To see some of the colors we have to
- 69. Color Matrix (16*16) Simple_window win20(pt,600,400,"16*16 color matrix"); Vector_ref vr; // use like vector // but imagine
- 70. Color matrix (16*16) More examples and graphics classes in the book (chapter 13) Stroustrup/Programming
- 72. Скачать презентацию
Goal of this
Graphics library allows us to explore some core object-oriented
Goal of this
Graphics library allows us to explore some core object-oriented
Display model
Objects (such as graphs) are “attached to” a window.
The “display
Display model
Objects (such as graphs) are “attached to” a window.
The “display
Display model
An example illustrating the display model
int main()
{
using namespace Graph_lib; // use
Display model
An example illustrating the display model
int main()
{
using namespace Graph_lib; // use
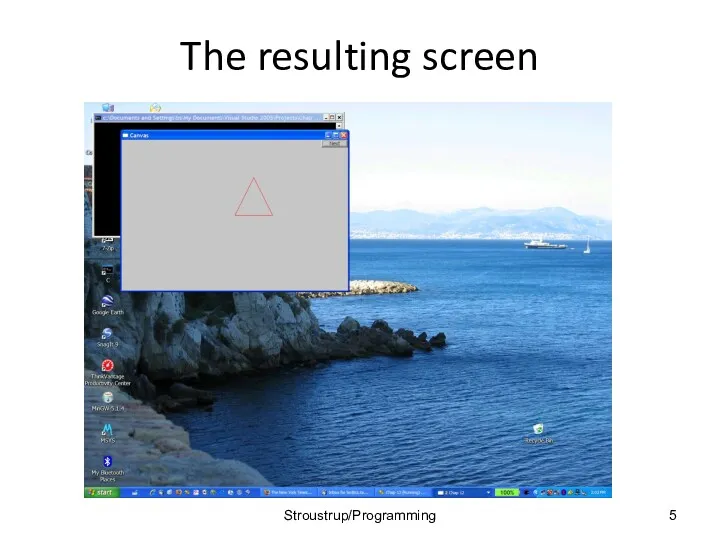
The resulting screen
Stroustrup/Programming
The resulting screen
Stroustrup/Programming
Graphics/GUI libraries
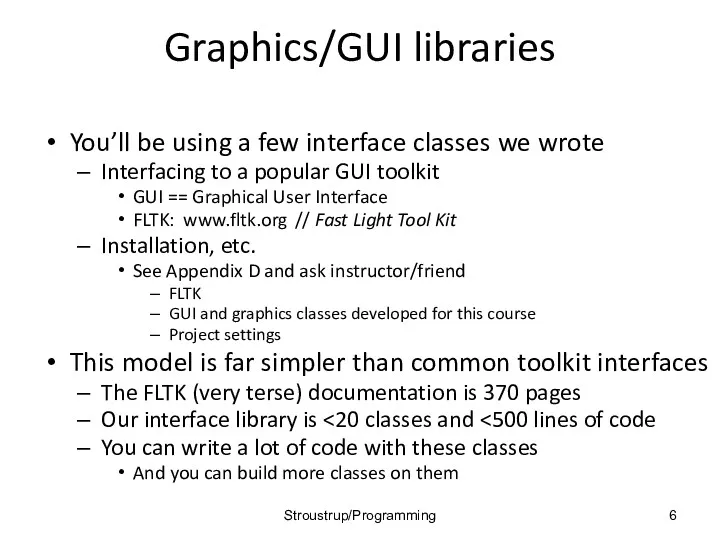
You’ll be using a few interface classes we wrote
Interfacing to
Graphics/GUI libraries
You’ll be using a few interface classes we wrote
Interfacing to
Graphics/GUI libraries (cont.)
The code is portable
Windows, Unix, Mac, etc.
This model extends
Graphics/GUI libraries (cont.)
The code is portable
Windows, Unix, Mac, etc.
This model extends
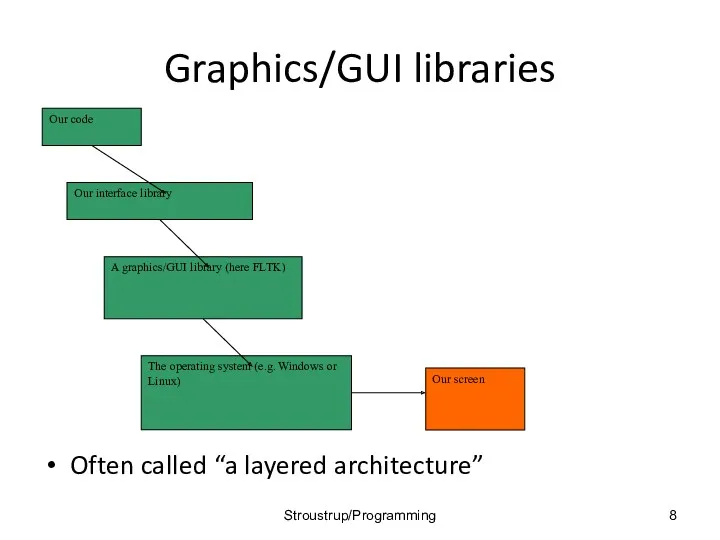
Graphics/GUI libraries
Often called “a layered architecture”
Stroustrup/Programming
Graphics/GUI libraries
Often called “a layered architecture”
Stroustrup/Programming
Interface classes
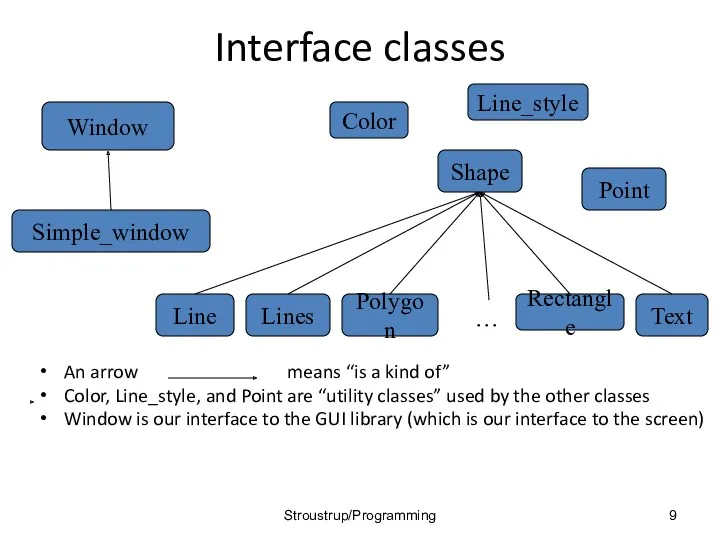
An arrow means “is a kind of”
Color, Line_style, and Point
Interface classes
An arrow means “is a kind of”
Color, Line_style, and Point
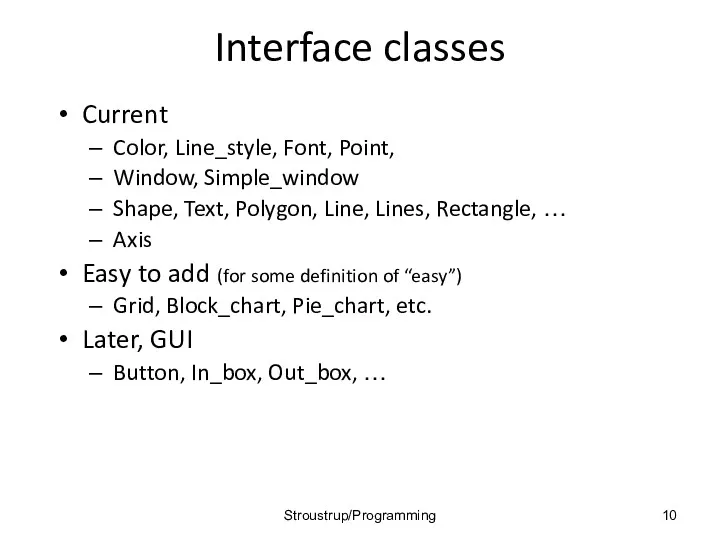
Interface classes
Current
Color, Line_style, Font, Point,
Window, Simple_window
Shape, Text, Polygon, Line, Lines, Rectangle,
Interface classes
Current
Color, Line_style, Font, Point,
Window, Simple_window
Shape, Text, Polygon, Line, Lines, Rectangle,
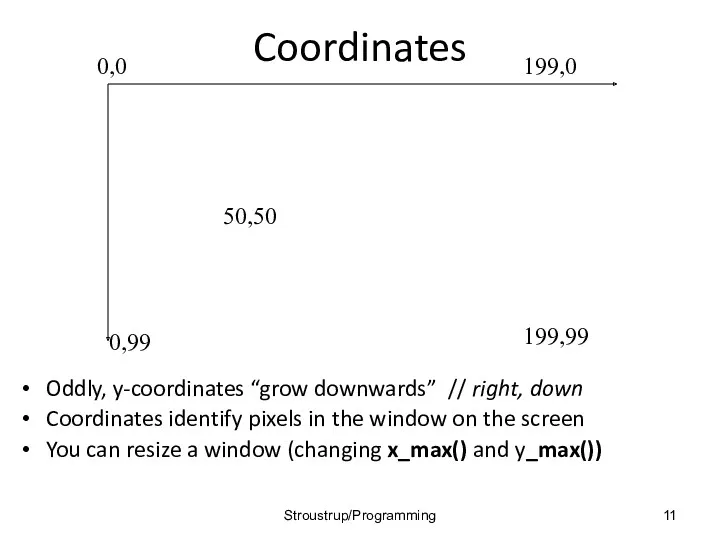
Coordinates
Oddly, y-coordinates “grow downwards” // right, down
Coordinates identify pixels in the
Coordinates
Oddly, y-coordinates “grow downwards” // right, down
Coordinates identify pixels in the
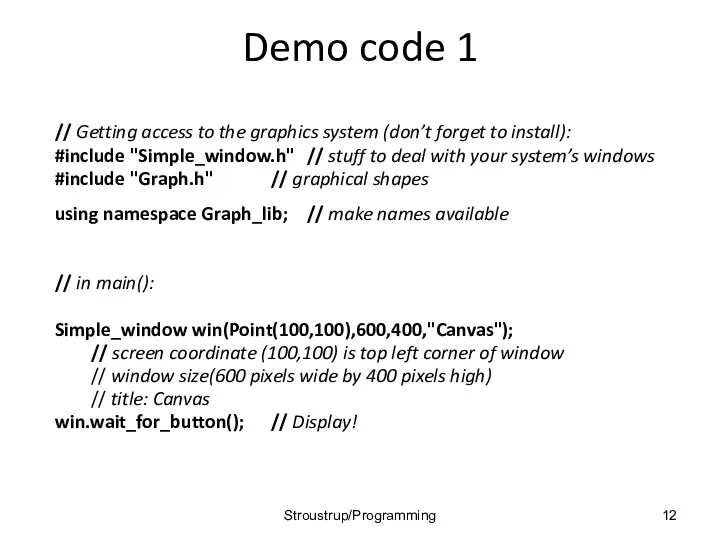
Demo code 1
// Getting access to the graphics system (don’t forget
Demo code 1
// Getting access to the graphics system (don’t forget
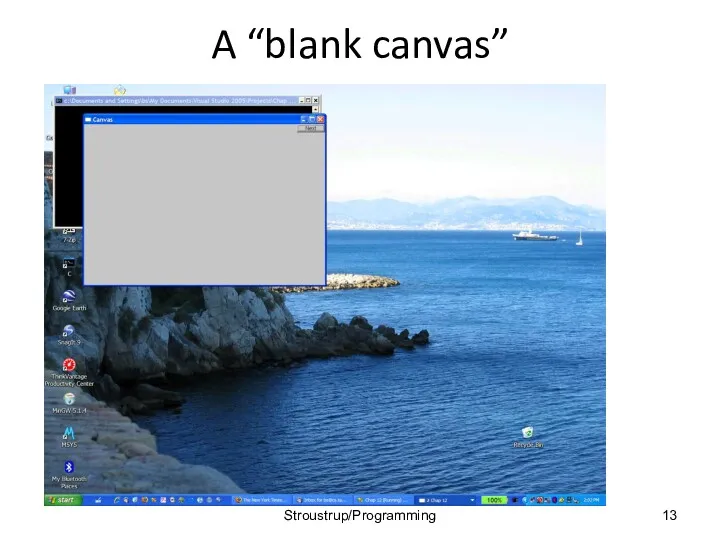
A “blank canvas”
Stroustrup/Programming
A “blank canvas”
Stroustrup/Programming
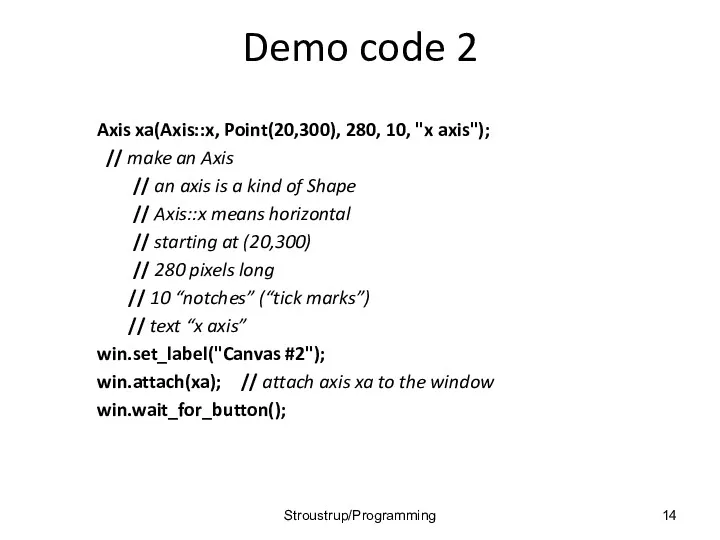
Demo code 2
Axis xa(Axis::x, Point(20,300), 280, 10, "x axis");
// make
Demo code 2
Axis xa(Axis::x, Point(20,300), 280, 10, "x axis");
// make
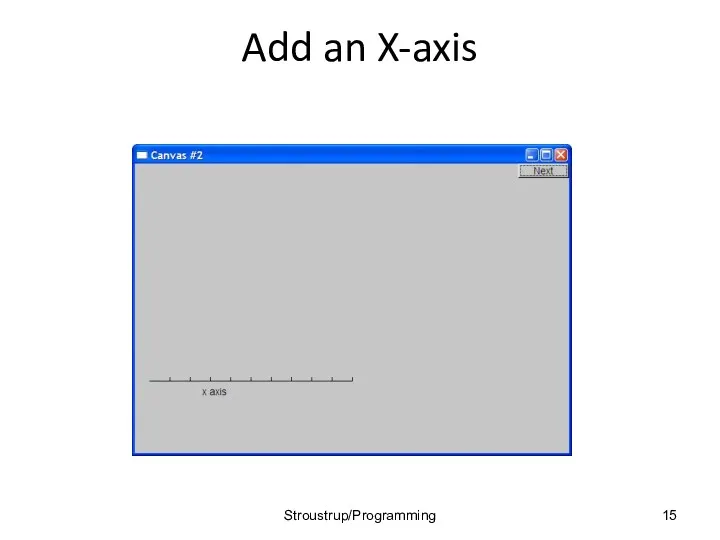
Add an X-axis
Stroustrup/Programming
Add an X-axis
Stroustrup/Programming
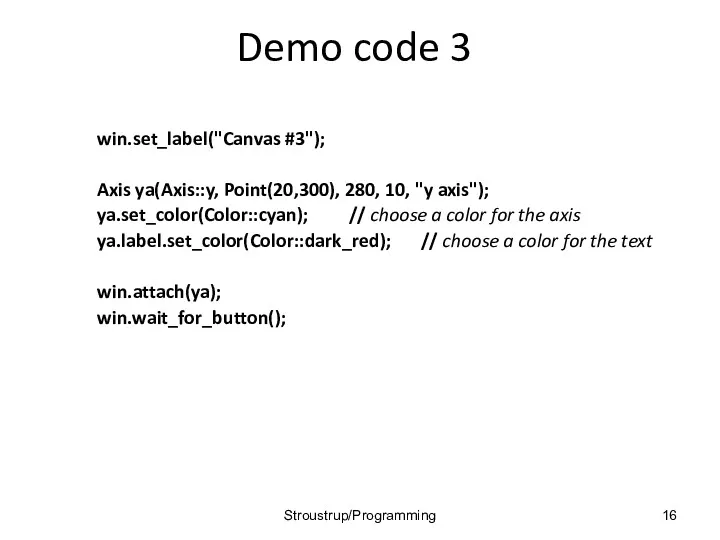
Demo code 3
win.set_label("Canvas #3");
Axis ya(Axis::y, Point(20,300), 280, 10, "y axis");
ya.set_color(Color::cyan); // choose
Demo code 3
win.set_label("Canvas #3");
Axis ya(Axis::y, Point(20,300), 280, 10, "y axis");
ya.set_color(Color::cyan); // choose
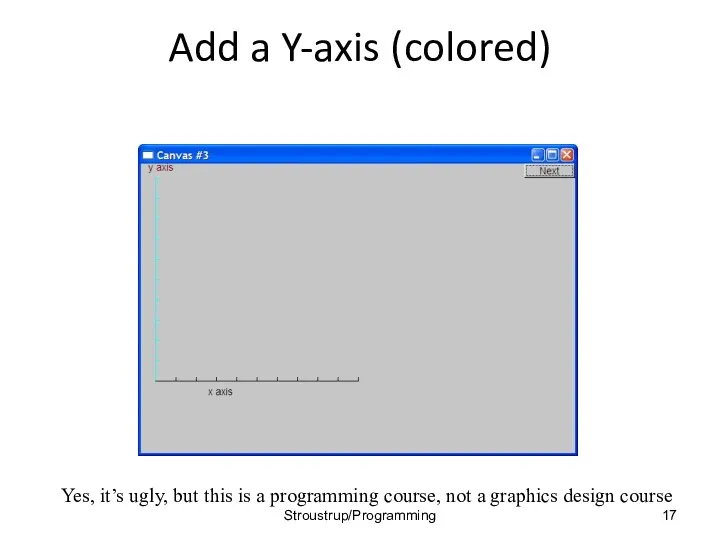
Add a Y-axis (colored)
Yes, it’s ugly, but this is a programming
Add a Y-axis (colored)
Yes, it’s ugly, but this is a programming
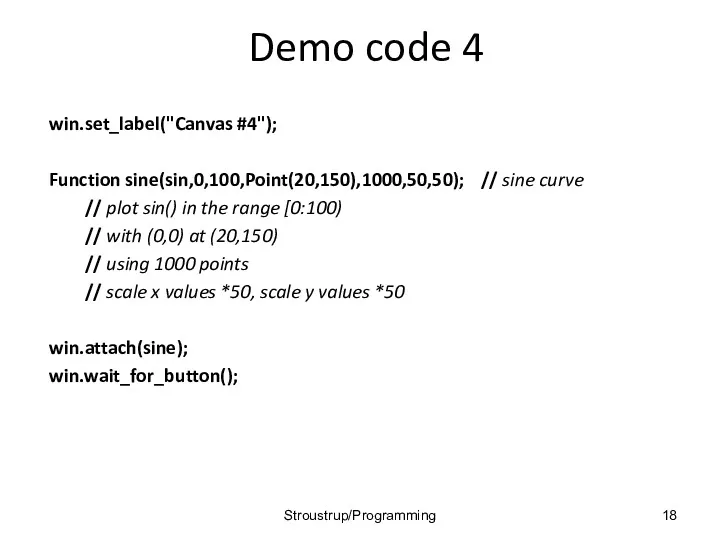
Demo code 4
win.set_label("Canvas #4");
Function sine(sin,0,100,Point(20,150),1000,50,50); // sine curve
// plot sin()
Demo code 4
win.set_label("Canvas #4");
Function sine(sin,0,100,Point(20,150),1000,50,50); // sine curve
// plot sin()
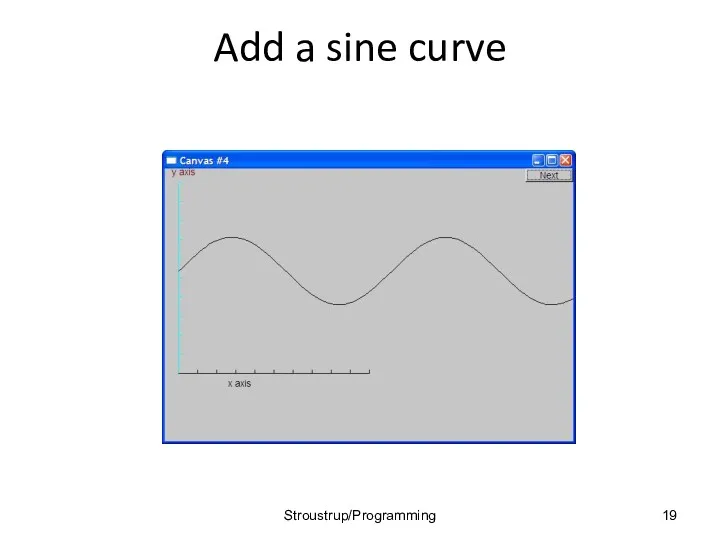
Add a sine curve
Stroustrup/Programming
Add a sine curve
Stroustrup/Programming
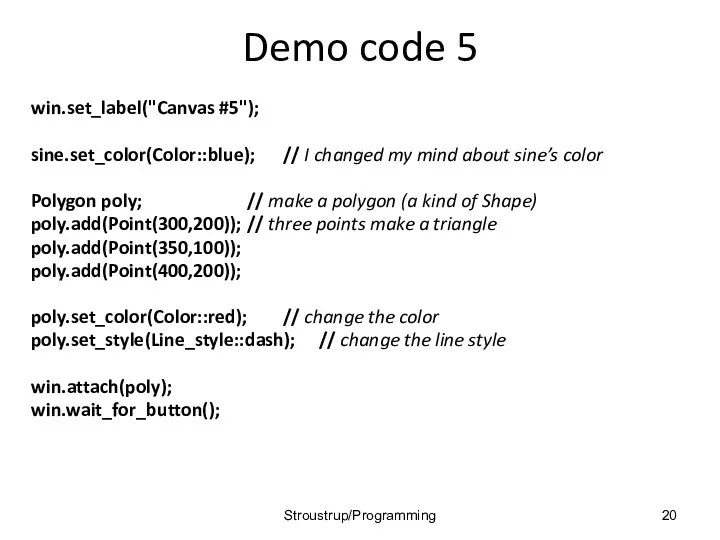
Demo code 5
win.set_label("Canvas #5");
sine.set_color(Color::blue); // I changed my mind about sine’s
Demo code 5
win.set_label("Canvas #5");
sine.set_color(Color::blue); // I changed my mind about sine’s
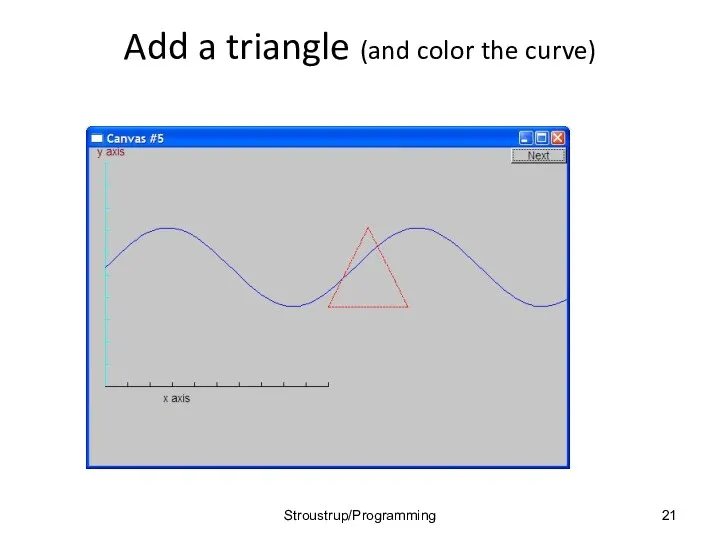
Add a triangle (and color the curve)
Stroustrup/Programming
Add a triangle (and color the curve)
Stroustrup/Programming
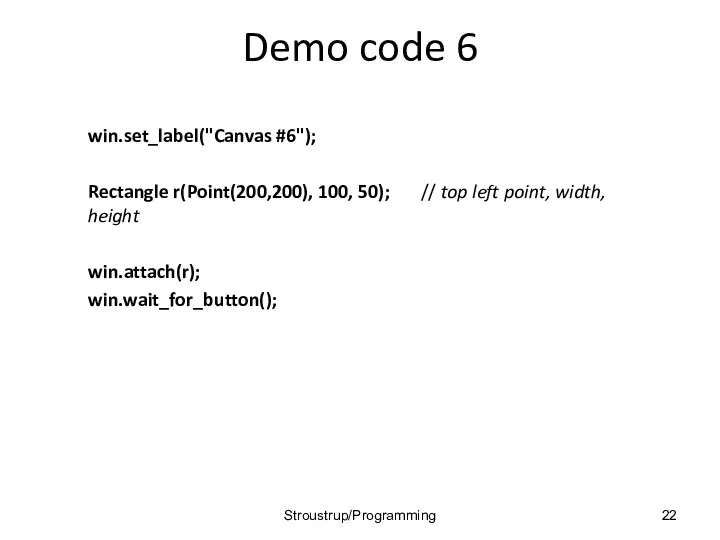
Demo code 6
win.set_label("Canvas #6");
Rectangle r(Point(200,200), 100, 50); // top left point,
Demo code 6
win.set_label("Canvas #6");
Rectangle r(Point(200,200), 100, 50); // top left point,
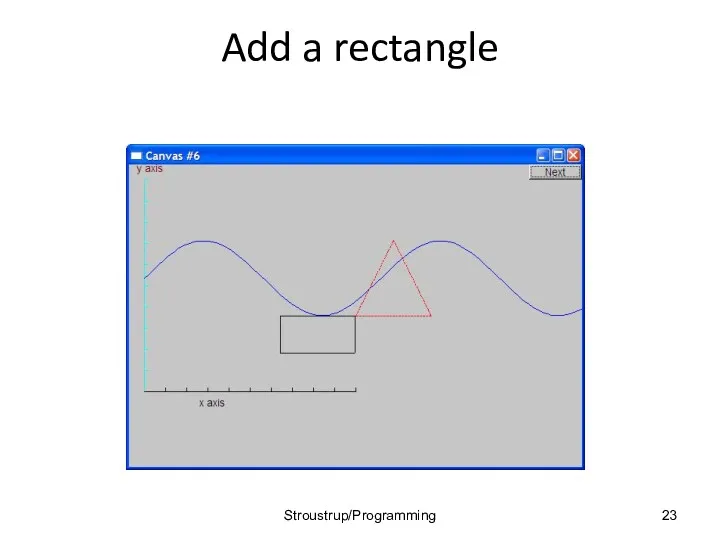
Add a rectangle
Stroustrup/Programming
Add a rectangle
Stroustrup/Programming
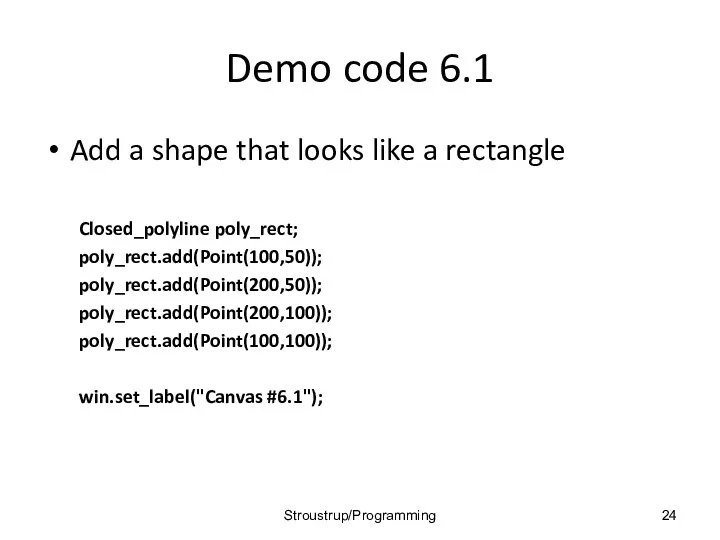
Demo code 6.1
Add a shape that looks like a rectangle
Closed_polyline poly_rect;
poly_rect.add(Point(100,50));
poly_rect.add(Point(200,50));
poly_rect.add(Point(200,100));
poly_rect.add(Point(100,100));
win.set_label("Canvas
Demo code 6.1
Add a shape that looks like a rectangle
Closed_polyline poly_rect;
poly_rect.add(Point(100,50));
poly_rect.add(Point(200,50));
poly_rect.add(Point(200,100));
poly_rect.add(Point(100,100));
win.set_label("Canvas
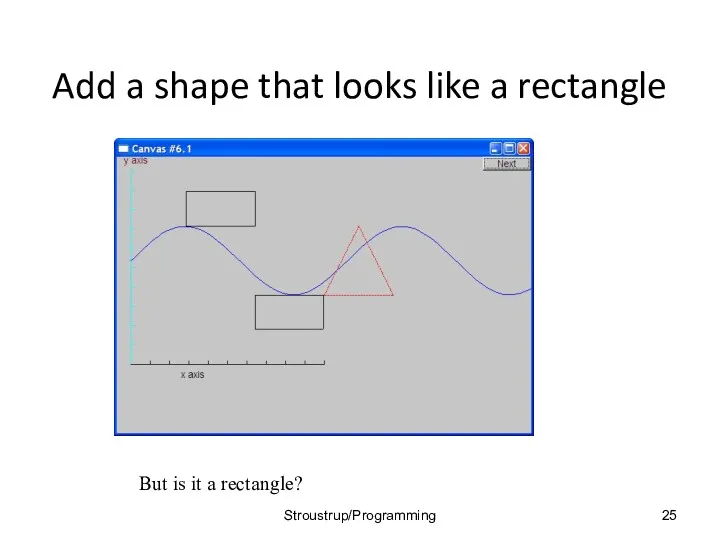
Add a shape that looks like a rectangle
But is it a
Add a shape that looks like a rectangle
But is it a
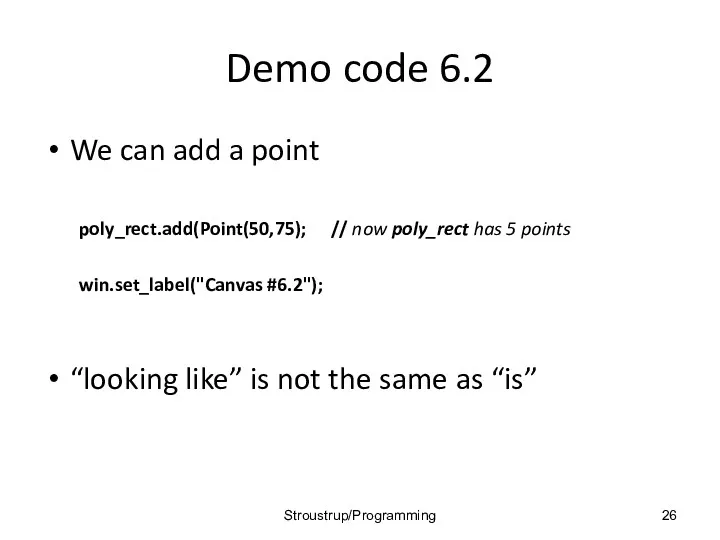
Demo code 6.2
We can add a point
poly_rect.add(Point(50,75); // now poly_rect has 5
Demo code 6.2
We can add a point
poly_rect.add(Point(50,75); // now poly_rect has 5
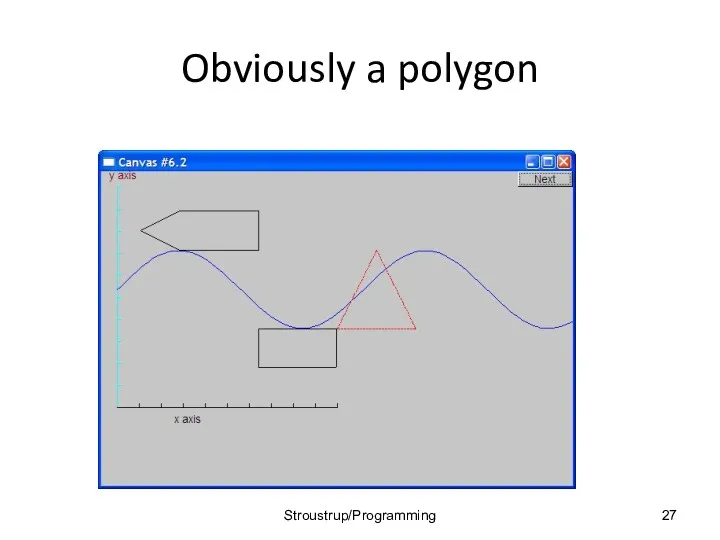
Obviously a polygon
Stroustrup/Programming
Obviously a polygon
Stroustrup/Programming
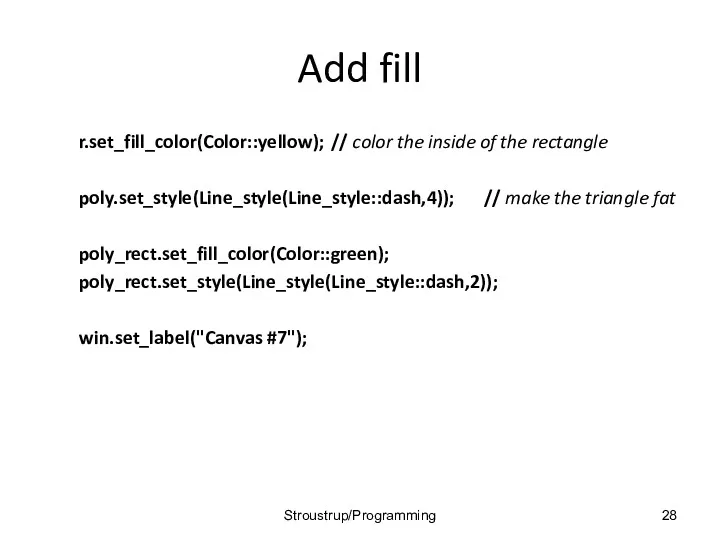
Add fill
r.set_fill_color(Color::yellow); // color the inside of the rectangle
poly.set_style(Line_style(Line_style::dash,4)); // make the
Add fill
r.set_fill_color(Color::yellow); // color the inside of the rectangle
poly.set_style(Line_style(Line_style::dash,4)); // make the
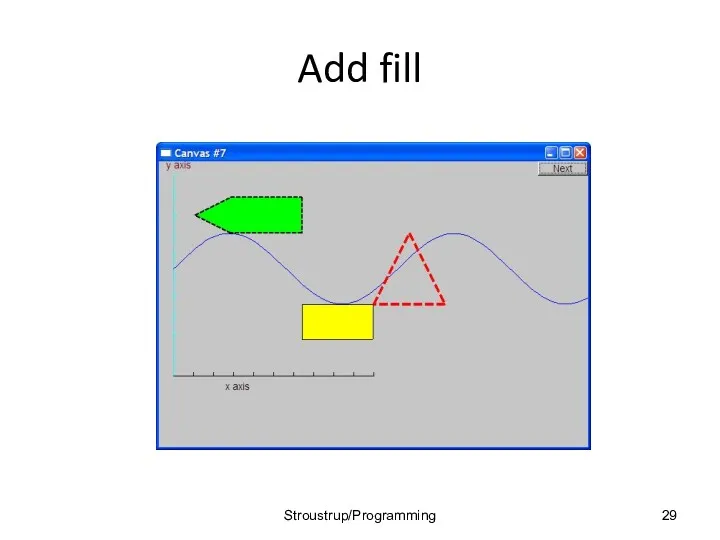
Add fill
Stroustrup/Programming
Add fill
Stroustrup/Programming
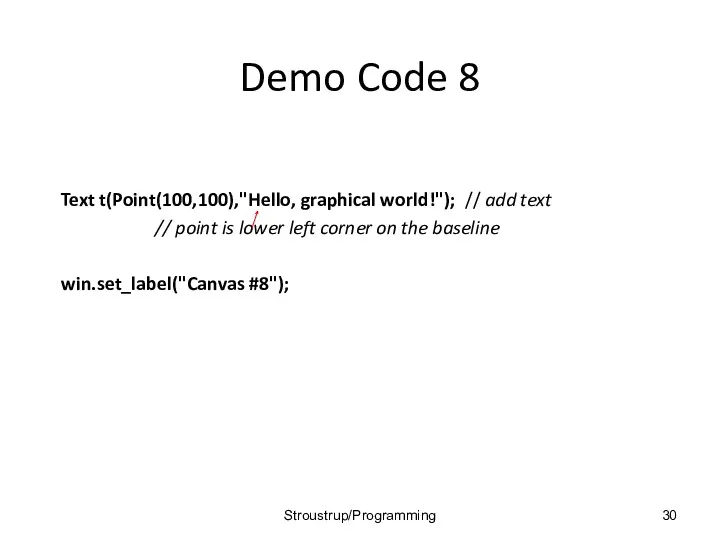
Demo Code 8
Text t(Point(100,100),"Hello, graphical world!"); // add text
// point
Demo Code 8
Text t(Point(100,100),"Hello, graphical world!"); // add text
// point
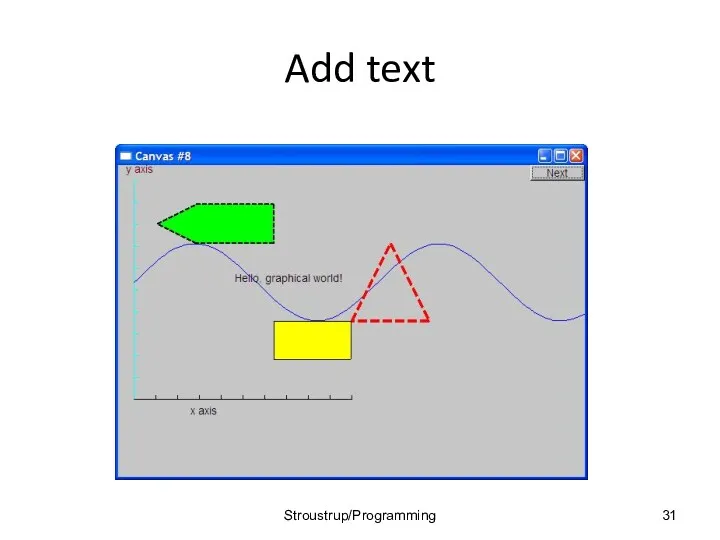
Add text
Stroustrup/Programming
Add text
Stroustrup/Programming
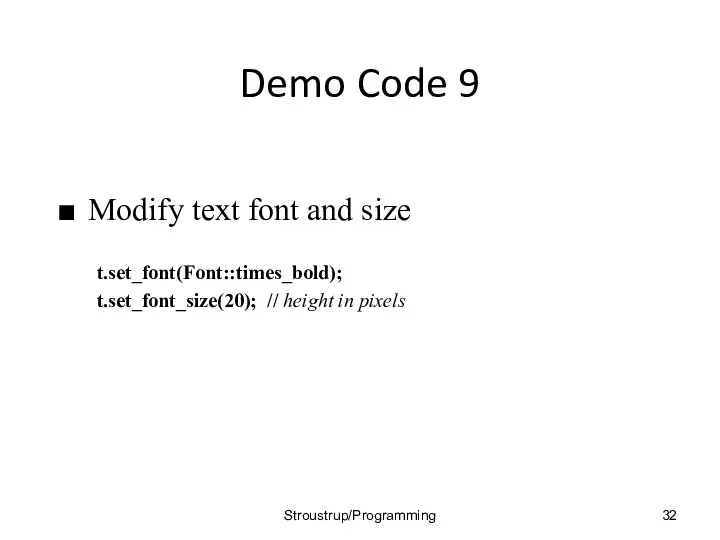
Demo Code 9
Modify text font and size
t.set_font(Font::times_bold);
t.set_font_size(20); // height in pixels
Stroustrup/Programming
Demo Code 9
Modify text font and size
t.set_font(Font::times_bold);
t.set_font_size(20); // height in pixels
Stroustrup/Programming
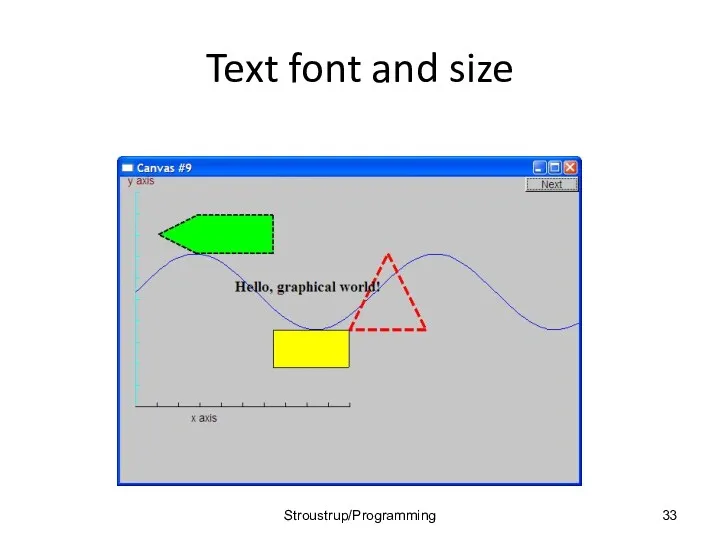
Text font and size
Stroustrup/Programming
Text font and size
Stroustrup/Programming
Add an image
Image ii(Point(100,50),"image.jpg"); // open an image file
win.attach(ii);
win.set_label("Canvas #10");
Stroustrup/Programming
Add an image
Image ii(Point(100,50),"image.jpg"); // open an image file
win.attach(ii);
win.set_label("Canvas #10");
Stroustrup/Programming
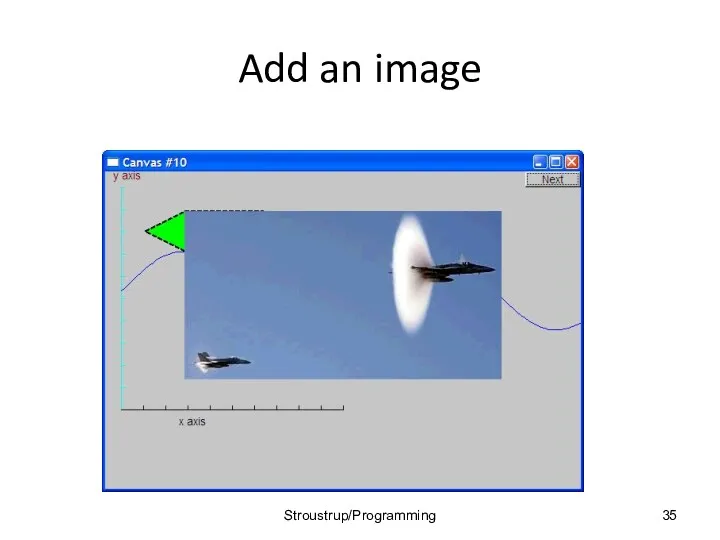
Add an image
Stroustrup/Programming
Add an image
Stroustrup/Programming
Oops!
The image obscures the other shapes
Move it a bit out of
Oops!
The image obscures the other shapes
Move it a bit out of
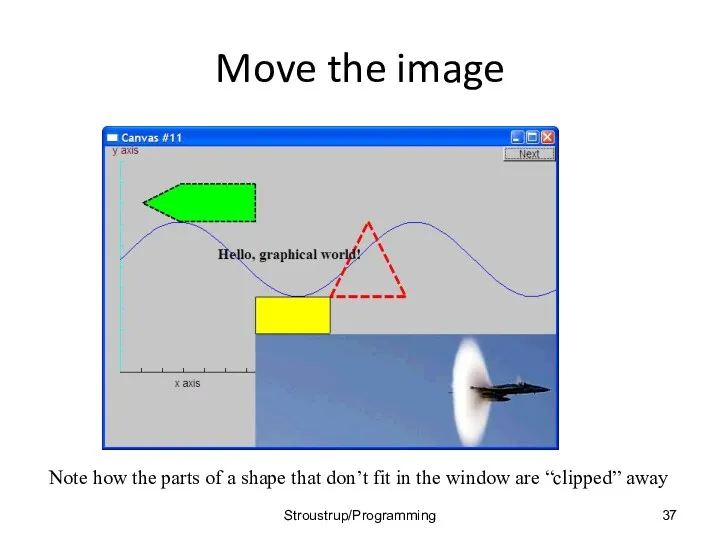
Move the image
Note how the parts of a shape that
Move the image
Note how the parts of a shape that
Demo Code 12
Circle c(Point(100,200),50); // center, radius
Ellipse e(Point(100,200), 75,25); // center, horizontal
Demo Code 12
Circle c(Point(100,200),50); // center, radius
Ellipse e(Point(100,200), 75,25); // center, horizontal
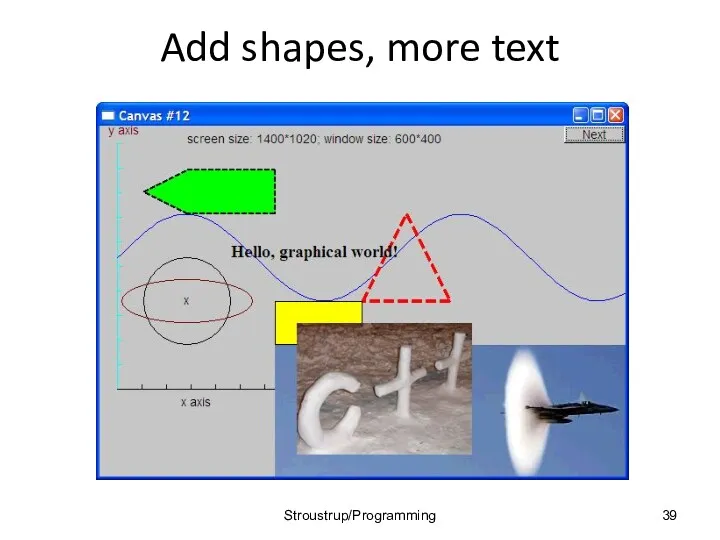
Add shapes, more text
Stroustrup/Programming
Add shapes, more text
Stroustrup/Programming
Boiler plate
#include "Graph.h" // header for graphs
#include “Simple_window.h" // header containing window interface
int
Boiler plate
#include "Graph.h" // header for graphs
#include “Simple_window.h" // header containing window interface
int
Primitives and algorithms
The demo shows the use of library primitives
Just the
Primitives and algorithms
The demo shows the use of library primitives
Just the
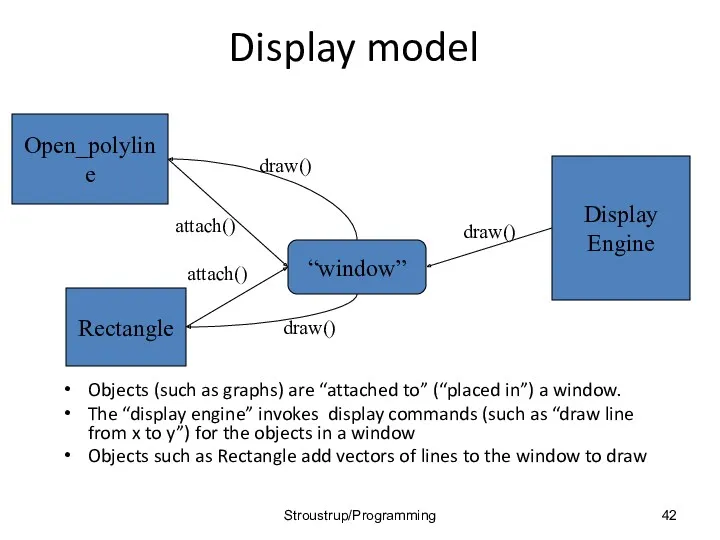
Display model
Objects (such as graphs) are “attached to” (“placed in”) a
Display model
Objects (such as graphs) are “attached to” (“placed in”) a
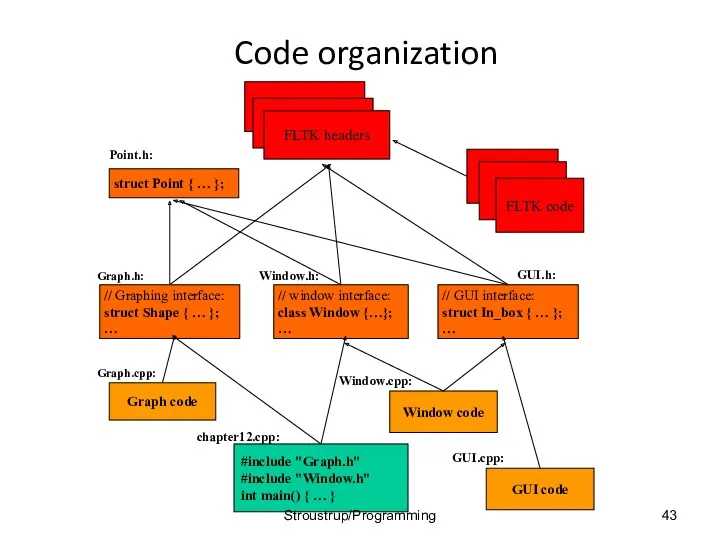
Code organization
GUI.h:
Point.h:
Stroustrup/Programming
Code organization
GUI.h:
Point.h:
Stroustrup/Programming
Source files
Header
File that contains interface information (declarations)
#include in user and implementer
.cpp
Source files
Header
File that contains interface information (declarations)
#include in user and implementer
.cpp
Design note
The ideal of program design is to represent concepts directly
Design note
The ideal of program design is to represent concepts directly
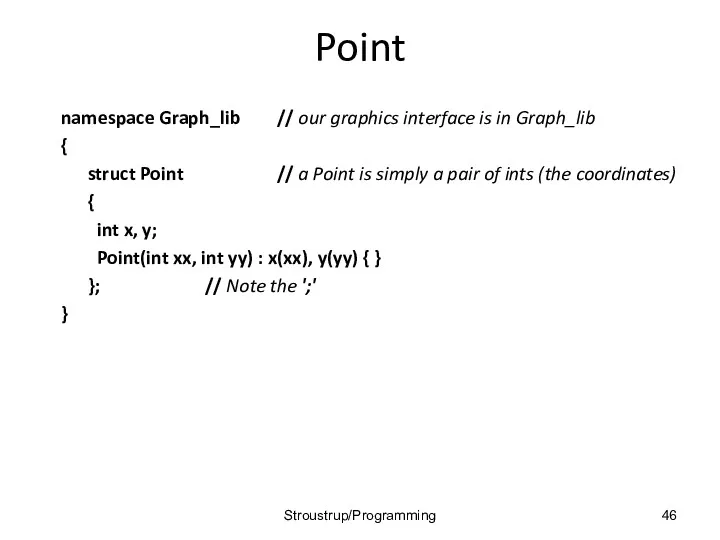
Point
namespace Graph_lib // our graphics interface is in Graph_lib
{
struct Point //
Point
namespace Graph_lib // our graphics interface is in Graph_lib
{
struct Point //
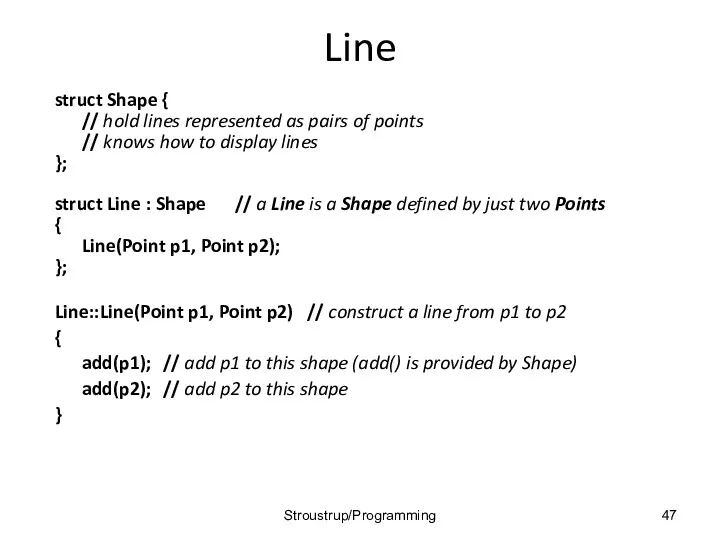
Line
struct Shape {
// hold lines represented as pairs of points
// knows
Line
struct Shape {
// hold lines represented as pairs of points
// knows
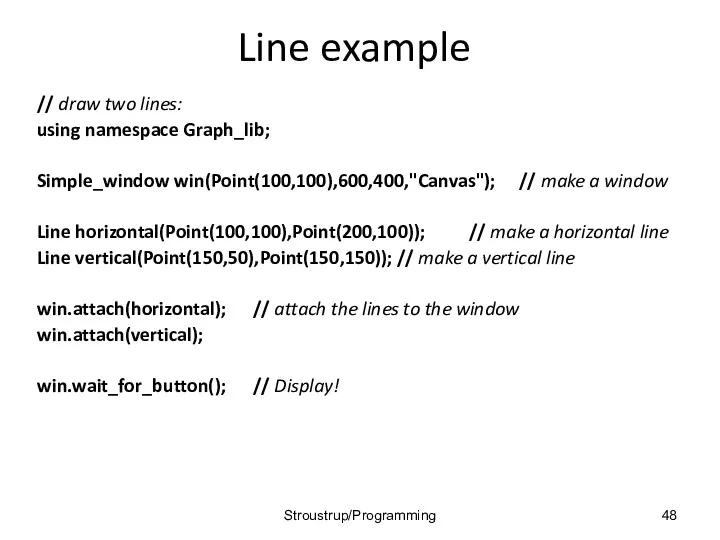
Line example
// draw two lines:
using namespace Graph_lib;
Simple_window win(Point(100,100),600,400,"Canvas"); // make a
Line example
// draw two lines:
using namespace Graph_lib;
Simple_window win(Point(100,100),600,400,"Canvas"); // make a
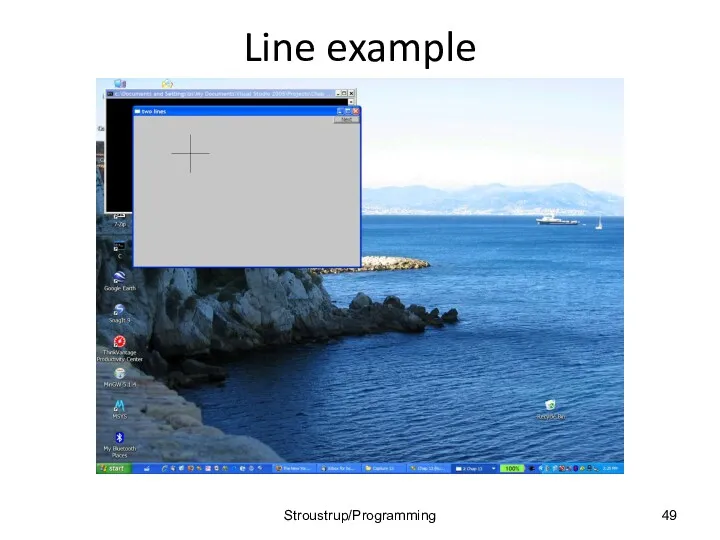
Line example
Stroustrup/Programming
Line example
Stroustrup/Programming
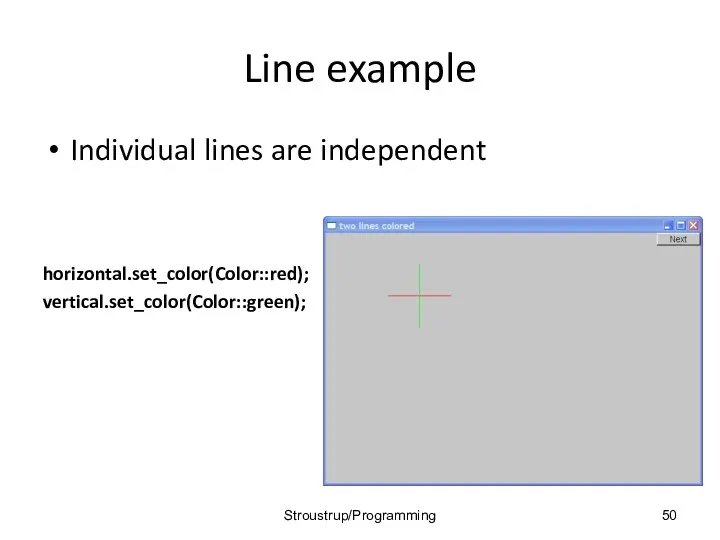
Line example
Individual lines are independent
horizontal.set_color(Color::red);
vertical.set_color(Color::green);
Stroustrup/Programming
Line example
Individual lines are independent
horizontal.set_color(Color::red);
vertical.set_color(Color::green);
Stroustrup/Programming
Lines
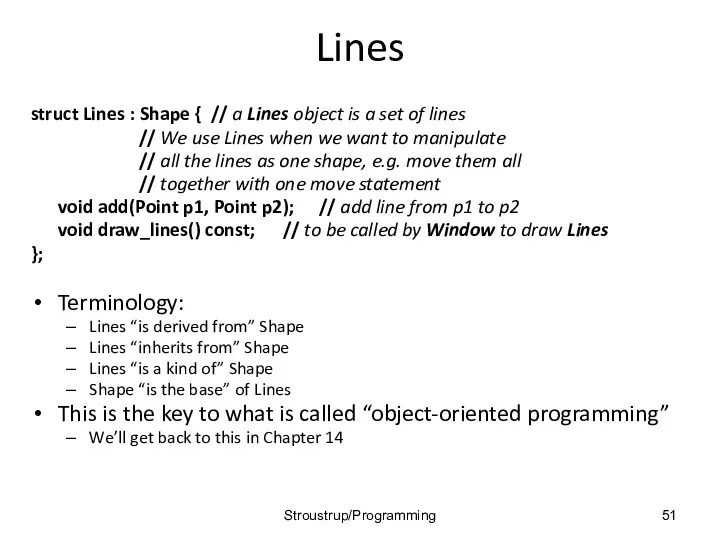
struct Lines : Shape { // a Lines object is a set
Lines
struct Lines : Shape { // a Lines object is a set
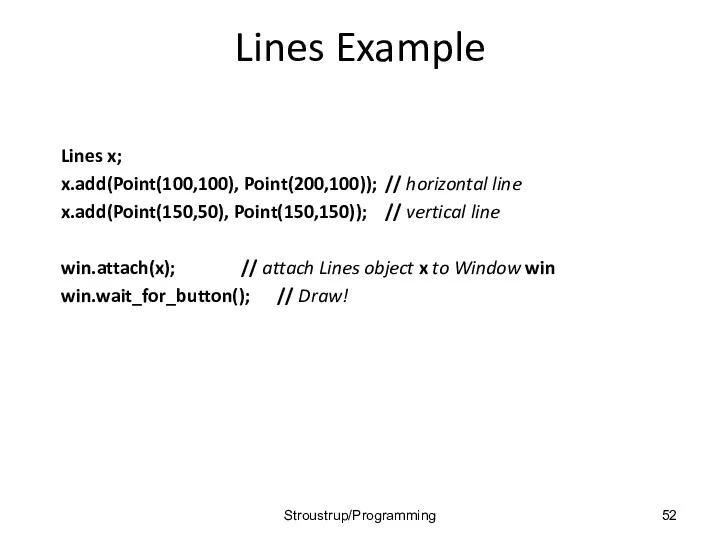
Lines Example
Lines x;
x.add(Point(100,100), Point(200,100)); // horizontal line
x.add(Point(150,50), Point(150,150)); // vertical line
win.attach(x); // attach Lines
Lines Example
Lines x;
x.add(Point(100,100), Point(200,100)); // horizontal line
x.add(Point(150,50), Point(150,150)); // vertical line
win.attach(x); // attach Lines
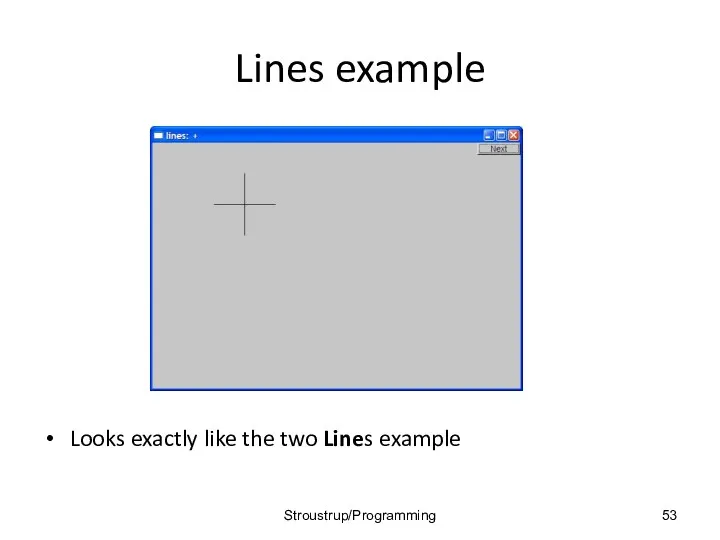
Lines example
Looks exactly like the two Lines example
Stroustrup/Programming
Lines example
Looks exactly like the two Lines example
Stroustrup/Programming
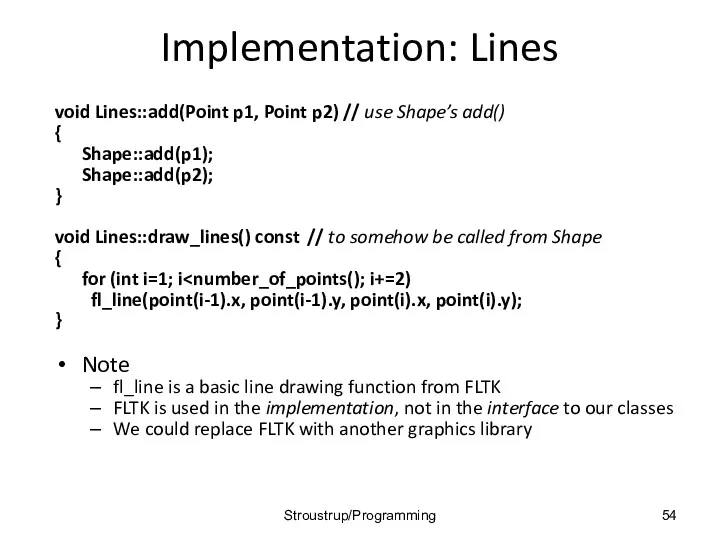
Implementation: Lines
void Lines::add(Point p1, Point p2) // use Shape’s add()
{
Shape::add(p1);
Shape::add(p2);
}
void Lines::draw_lines() const //
Implementation: Lines
void Lines::add(Point p1, Point p2) // use Shape’s add()
{
Shape::add(p1);
Shape::add(p2);
}
void Lines::draw_lines() const //
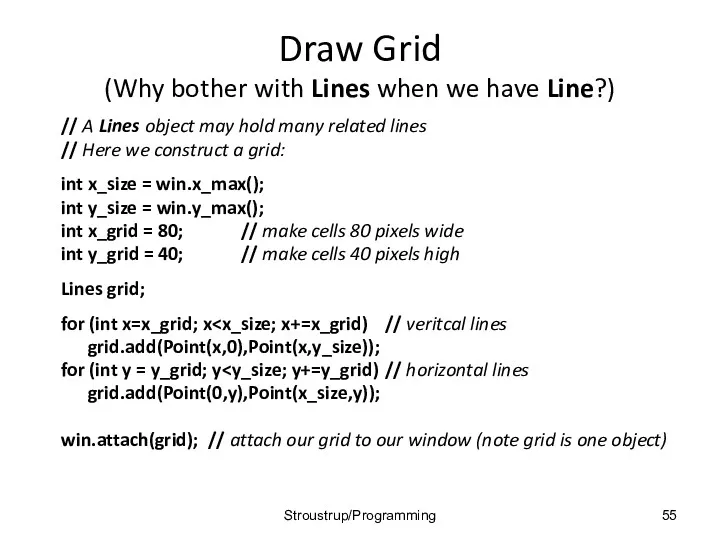
Draw Grid
(Why bother with Lines when we have Line?)
// A Lines
Draw Grid
(Why bother with Lines when we have Line?)
// A Lines
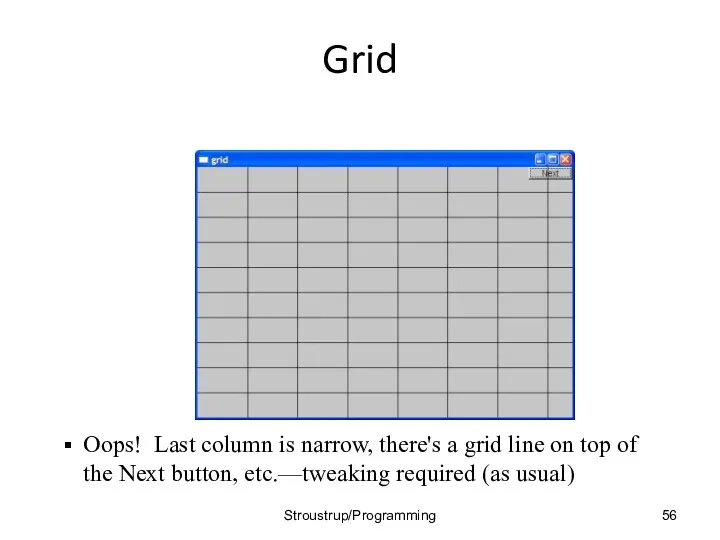
Grid
Stroustrup/Programming
Oops! Last column is narrow, there's a grid line on top
Grid
Stroustrup/Programming
Oops! Last column is narrow, there's a grid line on top
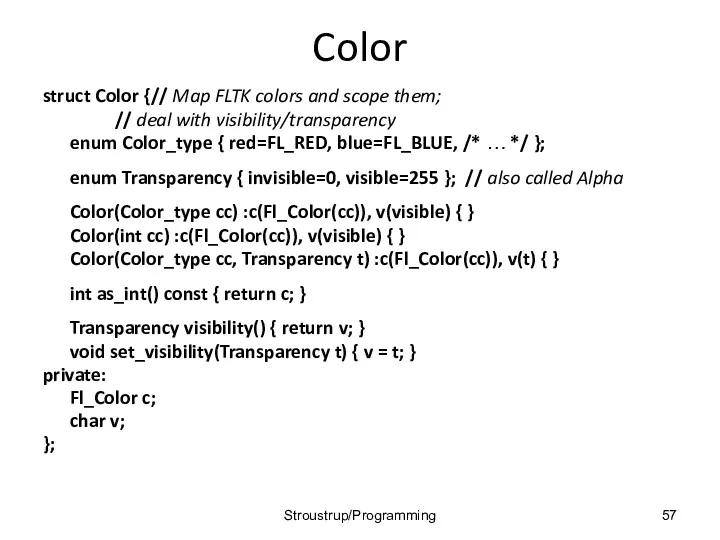
Color
struct Color { // Map FLTK colors and scope them;
// deal with
Color
struct Color { // Map FLTK colors and scope them;
// deal with
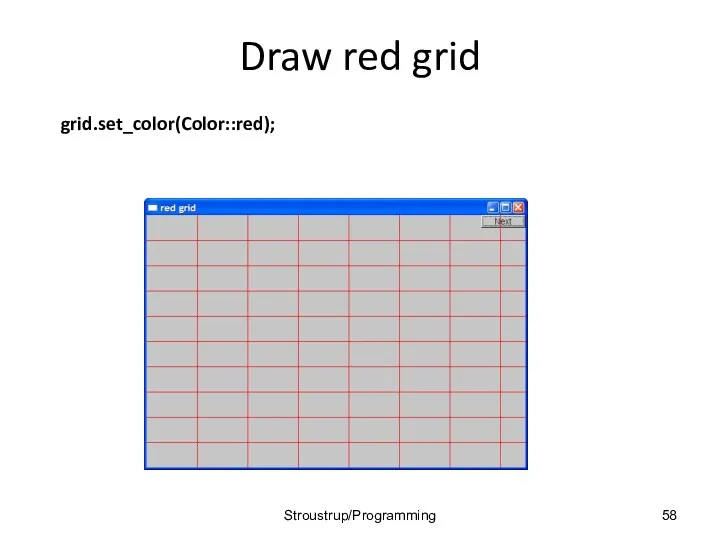
Draw red grid
grid.set_color(Color::red);
Stroustrup/Programming
Draw red grid
grid.set_color(Color::red);
Stroustrup/Programming
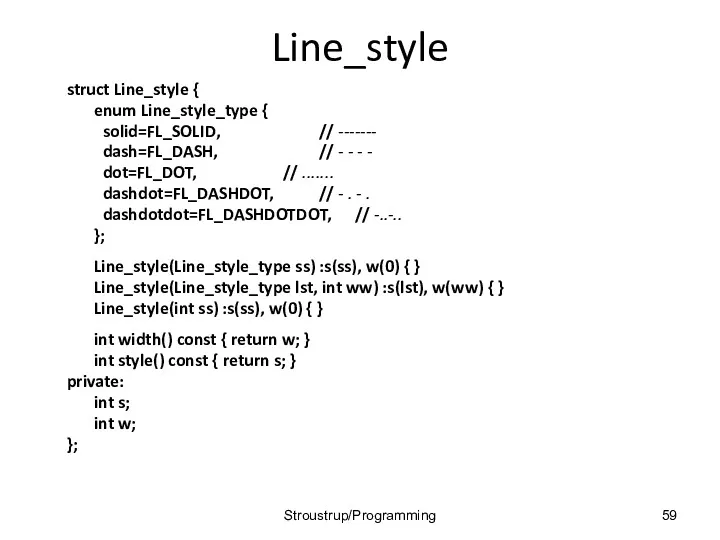
Line_style
struct Line_style {
enum Line_style_type {
solid=FL_SOLID, // -------
dash=FL_DASH, // - - - -
dot=FL_DOT, // .......
Line_style
struct Line_style {
enum Line_style_type {
solid=FL_SOLID, // -------
dash=FL_DASH, // - - - -
dot=FL_DOT, // .......
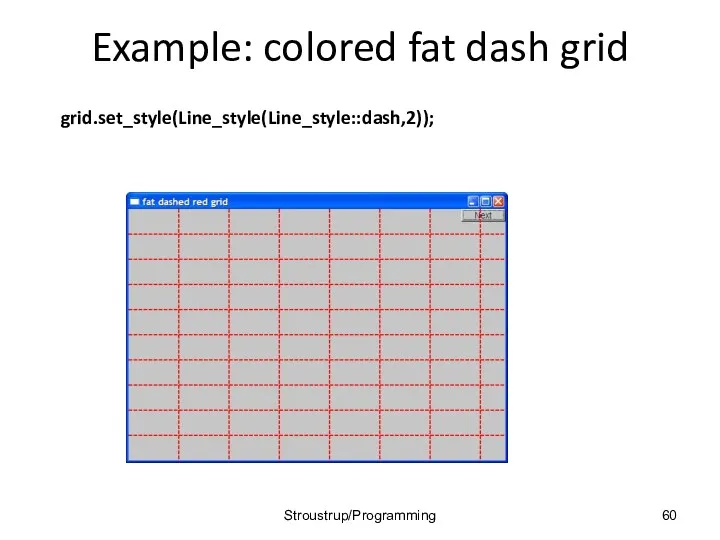
Example: colored fat dash grid
grid.set_style(Line_style(Line_style::dash,2));
Stroustrup/Programming
Example: colored fat dash grid
grid.set_style(Line_style(Line_style::dash,2));
Stroustrup/Programming
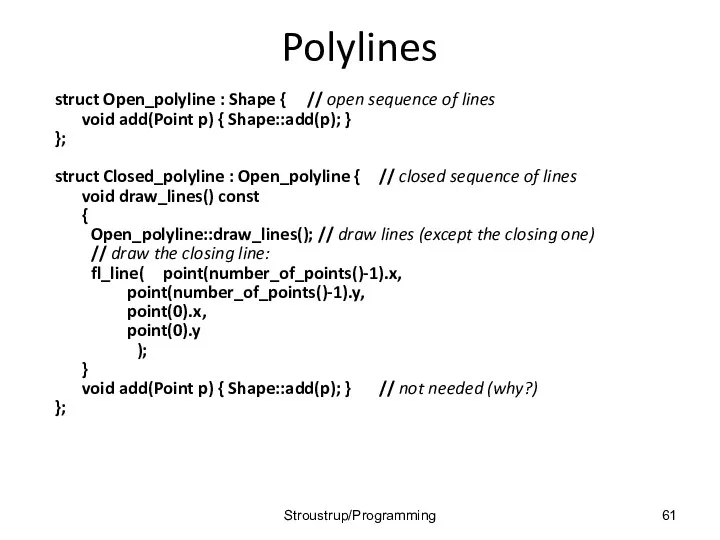
Polylines
struct Open_polyline : Shape { // open sequence of lines
void add(Point p)
Polylines
struct Open_polyline : Shape { // open sequence of lines
void add(Point p)
Open_polyline
Open_polyline opl;
opl.add(Point(100,100));
opl.add(Point(150,200));
opl.add(Point(250,250));
opl.add(Point(300,200));
Stroustrup/Programming
Open_polyline
Open_polyline opl;
opl.add(Point(100,100));
opl.add(Point(150,200));
opl.add(Point(250,250));
opl.add(Point(300,200));
Stroustrup/Programming
Closed_polyline
Closed_polyline cpl;
cpl.add(Point(100,100));
cpl.add(Point(150,200));
cpl.add(Point(250,250));
cpl.add(Point(300,200));
Stroustrup/Programming
Closed_polyline
Closed_polyline cpl;
cpl.add(Point(100,100));
cpl.add(Point(150,200));
cpl.add(Point(250,250));
cpl.add(Point(300,200));
Stroustrup/Programming
Closed_polyline
cpl.add(Point(100,250));
A Closed_polyline is not a polygon
some closed_polylines look like polygons
A Polygon
Closed_polyline
cpl.add(Point(100,250));
A Closed_polyline is not a polygon
some closed_polylines look like polygons
A Polygon
Text
struct Text : Shape {
Text(Point x, const string& s) // x
Text
struct Text : Shape {
Text(Point x, const string& s) // x
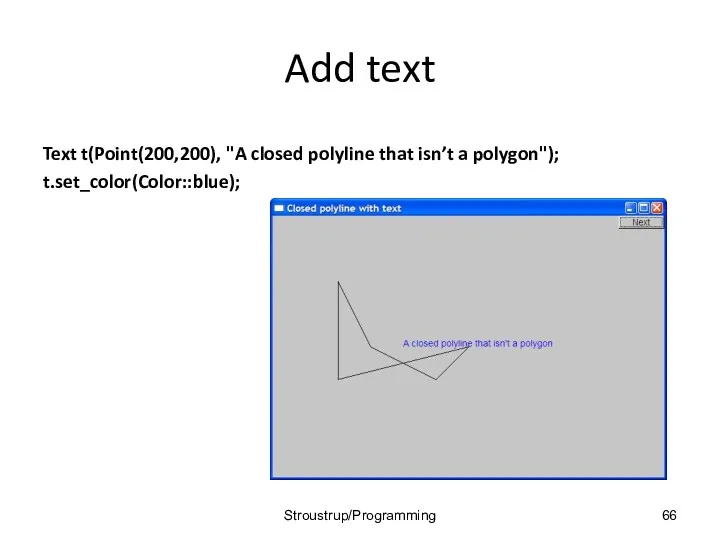
Add text
Text t(Point(200,200), "A closed polyline that isn’t a polygon");
t.set_color(Color::blue);
Stroustrup/Programming
Add text
Text t(Point(200,200), "A closed polyline that isn’t a polygon");
t.set_color(Color::blue);
Stroustrup/Programming
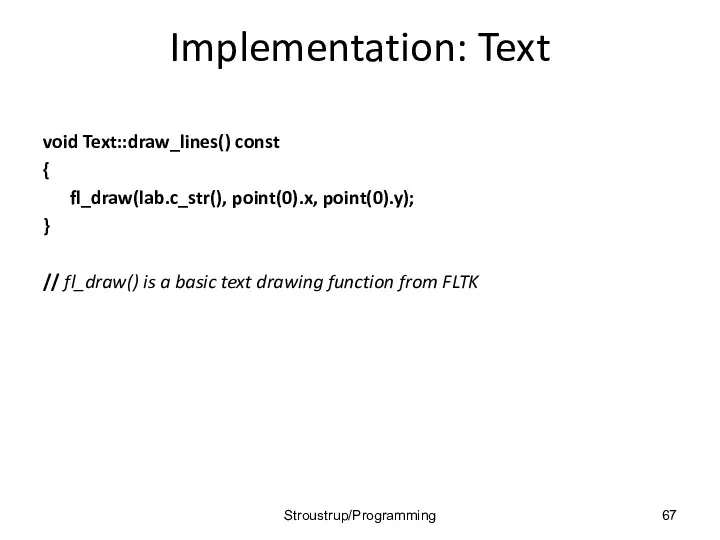
Implementation: Text
void Text::draw_lines() const
{
fl_draw(lab.c_str(), point(0).x, point(0).y);
}
// fl_draw() is a basic text
Implementation: Text
void Text::draw_lines() const
{
fl_draw(lab.c_str(), point(0).x, point(0).y);
}
// fl_draw() is a basic text
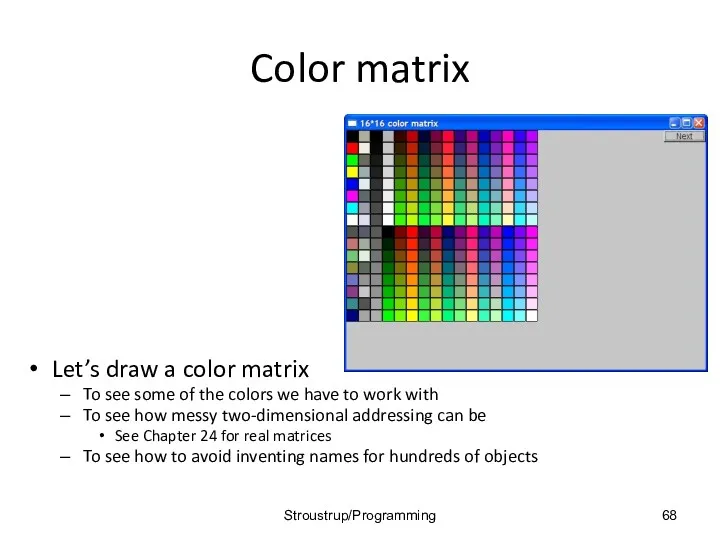
Color matrix
Let’s draw a color matrix
To see some of the colors
Color matrix
Let’s draw a color matrix
To see some of the colors
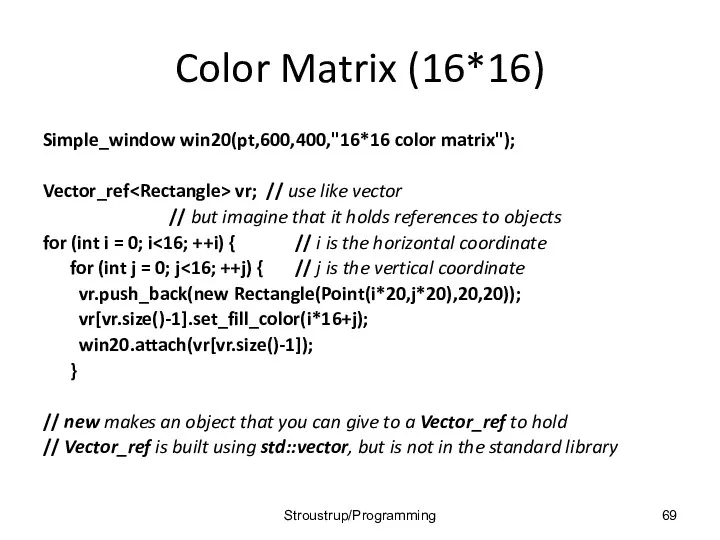
Color Matrix (16*16)
Simple_window win20(pt,600,400,"16*16 color matrix");
Vector_ref vr; // use like vector
Color Matrix (16*16)
Simple_window win20(pt,600,400,"16*16 color matrix");
Vector_ref
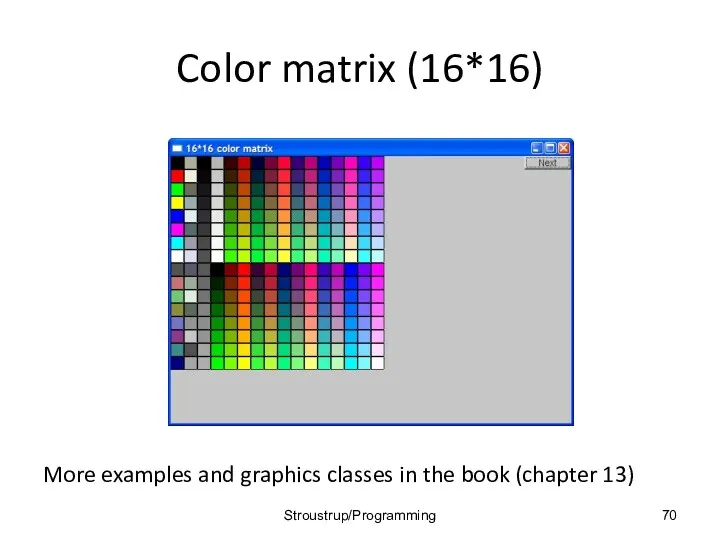
Color matrix (16*16)
More examples and graphics classes in the book (chapter
Color matrix (16*16)
More examples and graphics classes in the book (chapter
 Угадай и отгадай!
 Своя игра по информатике, 9 класс
 Организация глобальных сетей
 Компания ООО Отдел ИТ
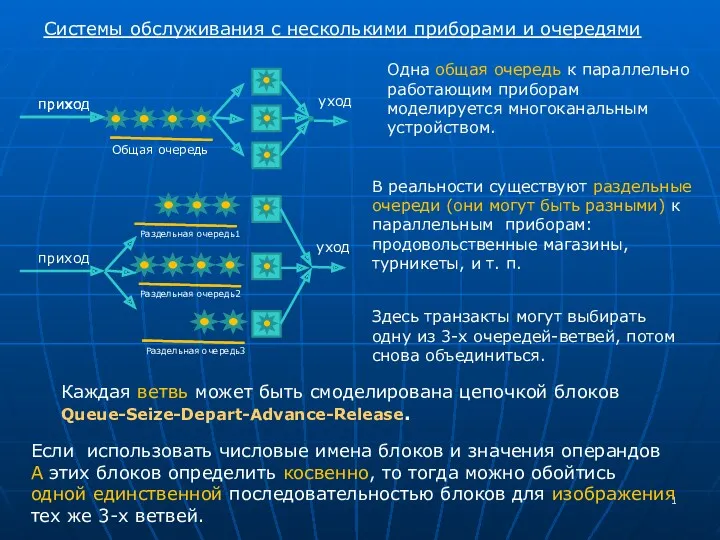 ПрезентацияПоGpss №10
 Принцип построения логической пирамиды при создании деловых документов. (Тема 9)
 Код. Кодирование.
 Операции и стандартные функции Turbo Pascal 7.0
 Формы представления чисел в ЭВМ
 Цели, задачи, этапы и объекты ревьюирования. Лекция №2
 Types and basic structures data in R
 Университет Дубна. Библиографический поиск и описание при подготовке рефератов, курсовых и дипломных работ
 Alfa Factory. Application Rulesets
 Процесс создания игры
 Правовые нормы, относящиеся к информации, правонарушения в информационной сфере, меры их предупреждения
 презентация к уроку Информационные технологии з класс
 Стан та перспективи розвитку електронної комерції у світі. Особливості інтернет-торгівлі у Китаї
 Антивирусные программы
 Вёрстка и дизайн газетной статьи
 Введение в Python. Как используется?
 MS DOS операциялық жүйесі
 Технология ATM. (Лекция 3)
 Межсетевые экраны
 Защита медицинской информации
 Методика обучения информатике в школе с использованием образовательных онлайн платформ
 Wi-Fi с авторизацией
 От скуки на все руки
 Компьютерная арифметика (§ 26 - § 30)