- Data coding and screening

Содержание
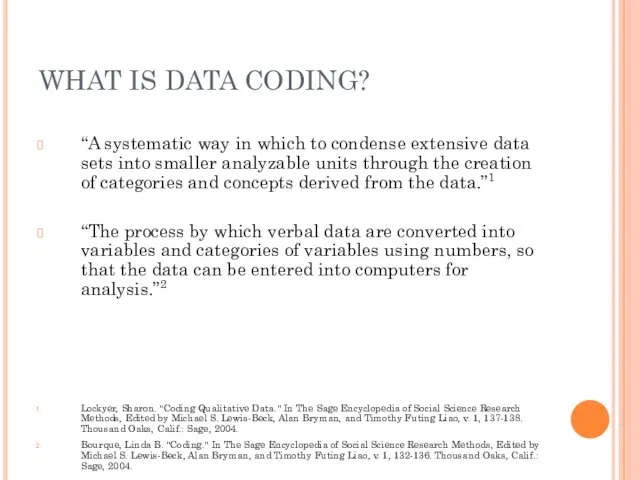
- 2. WHAT IS DATA CODING? “A systematic way in which to condense extensive data sets into smaller
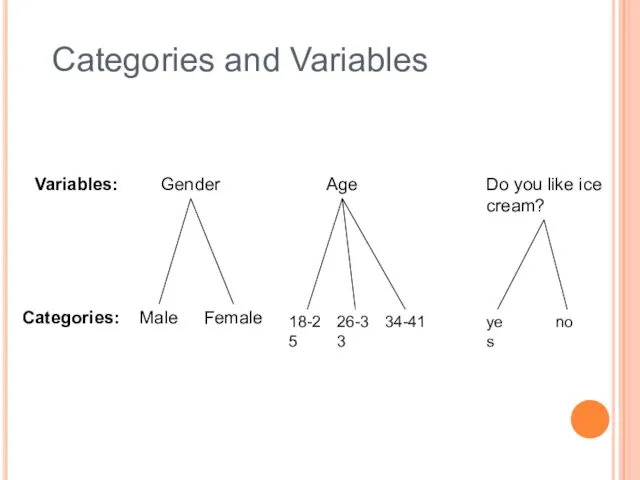
- 3. Variables: Categories: Gender Age Male Female 18-25 26-33 34-41 Do you like ice cream? yes no
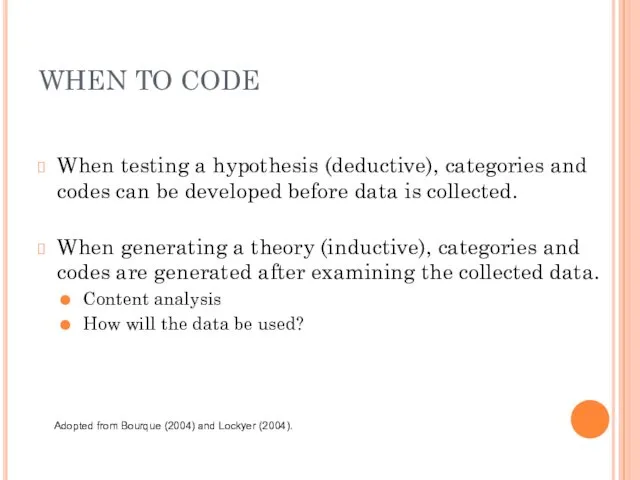
- 4. WHEN TO CODE When testing a hypothesis (deductive), categories and codes can be developed before data
- 5. LEVELS OF CODING (FOR QUALITATIVE DATA) Open Break down, compare, and categorize data Axial Make connections
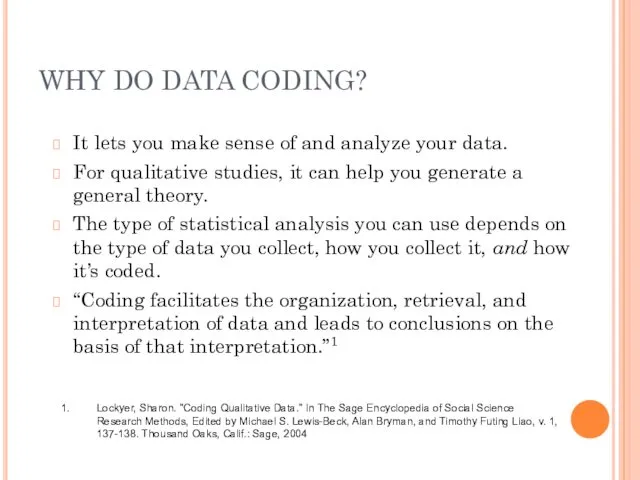
- 6. WHY DO DATA CODING? It lets you make sense of and analyze your data. For qualitative
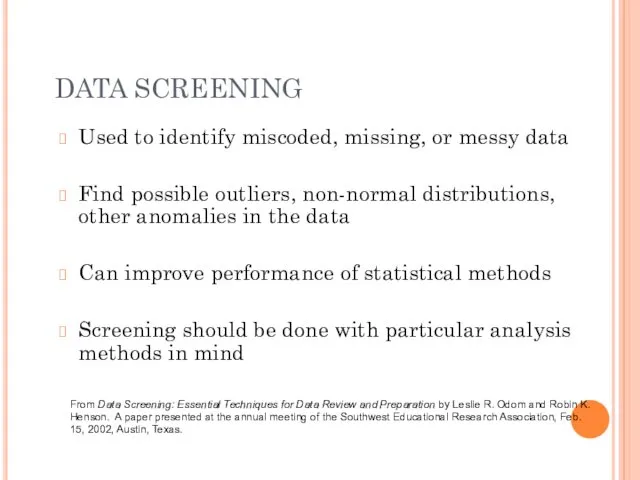
- 7. DATA SCREENING Used to identify miscoded, missing, or messy data Find possible outliers, non-normal distributions, other
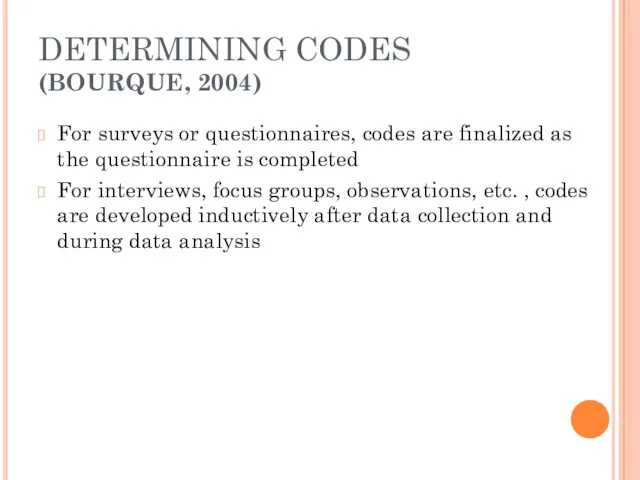
- 8. DETERMINING CODES (BOURQUE, 2004) For surveys or questionnaires, codes are finalized as the questionnaire is completed
- 9. IMPORTANCE OF CODEBOOK (SHENTON, 2004) Allows study to be repeated and validated. Makes methods transparent by
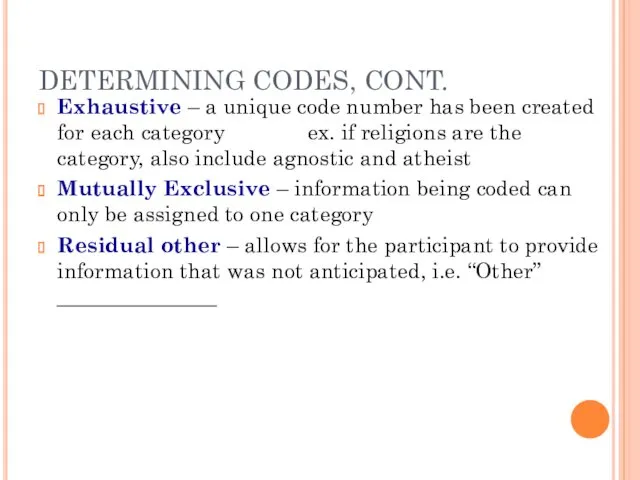
- 10. DETERMINING CODES, CONT. Exhaustive – a unique code number has been created for each category ex.
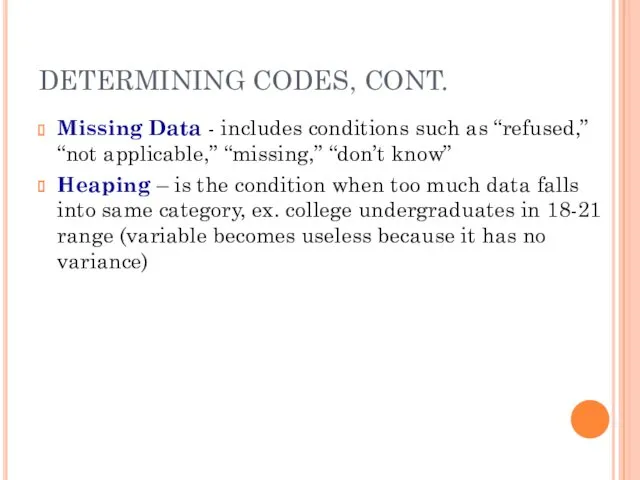
- 11. DETERMINING CODES, CONT. Missing Data - includes conditions such as “refused,” “not applicable,” “missing,” “don’t know”
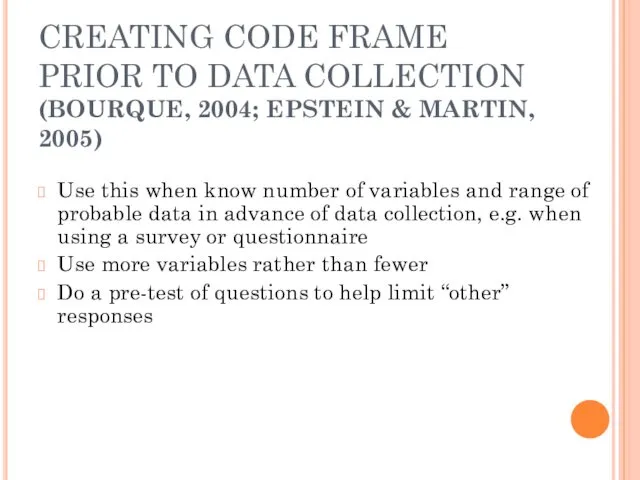
- 12. CREATING CODE FRAME PRIOR TO DATA COLLECTION (BOURQUE, 2004; EPSTEIN & MARTIN, 2005) Use this when
- 13. TABLE OF CODE VALUES (EPSTEIN & MARTIN, 2005)
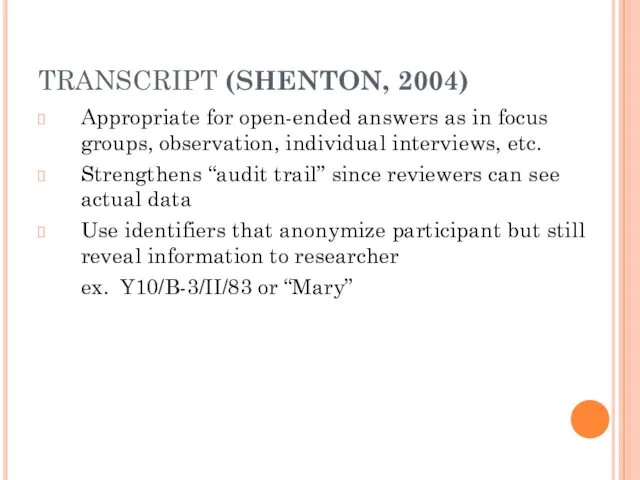
- 14. TRANSCRIPT (SHENTON, 2004) Appropriate for open-ended answers as in focus groups, observation, individual interviews, etc. Strengthens
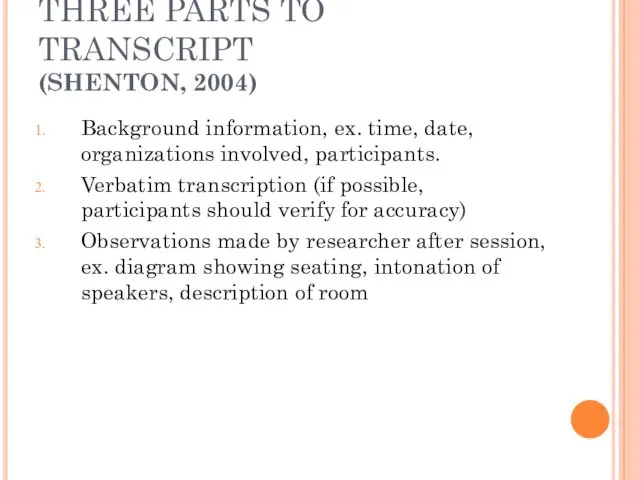
- 15. THREE PARTS TO TRANSCRIPT (SHENTON, 2004) Background information, ex. time, date, organizations involved, participants. Verbatim transcription
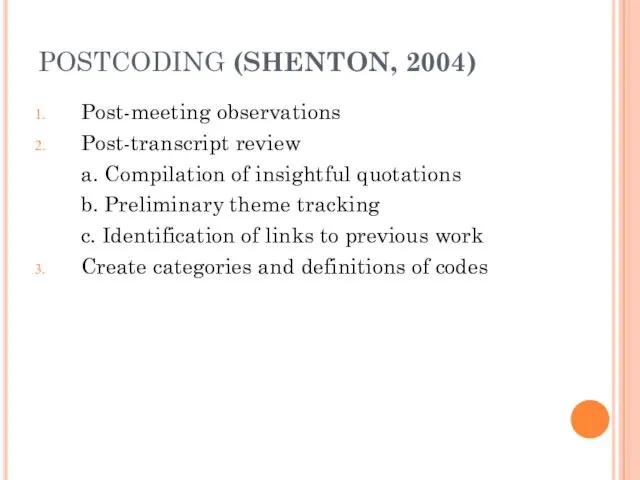
- 16. POSTCODING (SHENTON, 2004) Post-meeting observations Post-transcript review a. Compilation of insightful quotations b. Preliminary theme tracking
- 17. DATA DICTIONARY (SHENTON, 2004)
- 18. REFERENCES Bourque, Linda B. "Coding." In The Sage Encyclopedia of Social Science Research Methods. Eds. Michael
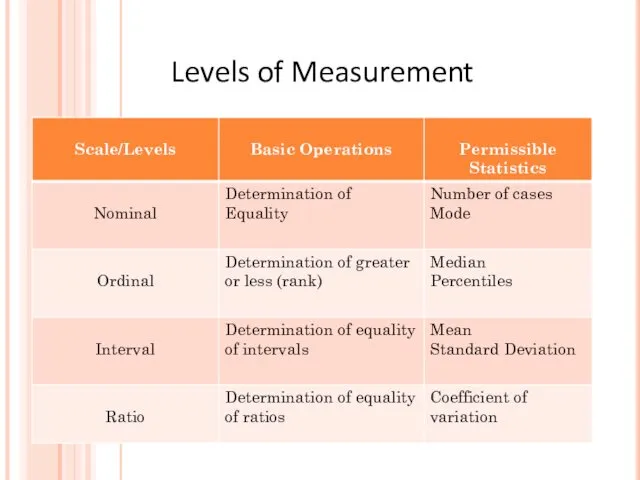
- 19. Levels of Measurement
- 20. Coding Mixed Methods: Advantages and Disadvantages
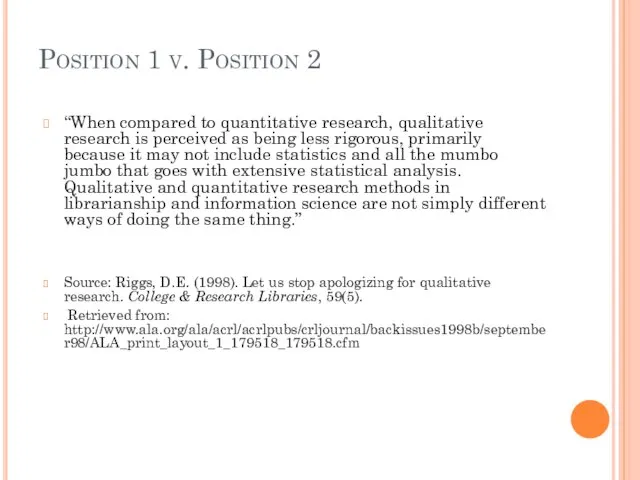
- 21. Position 1 v. Position 2 “When compared to quantitative research, qualitative research is perceived as being
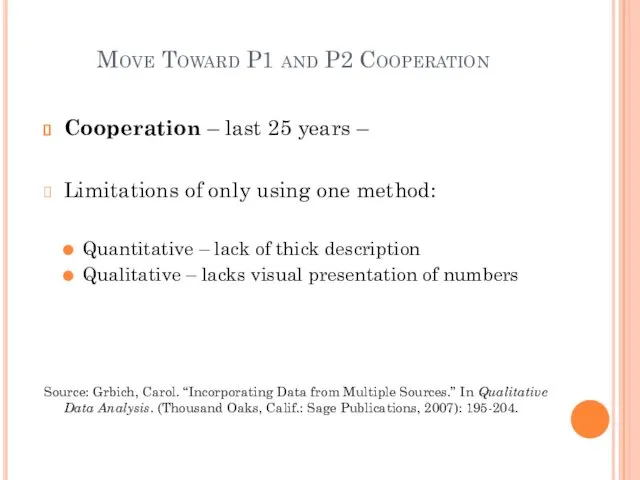
- 22. Move Toward P1 and P2 Cooperation Cooperation – last 25 years – Limitations of only using
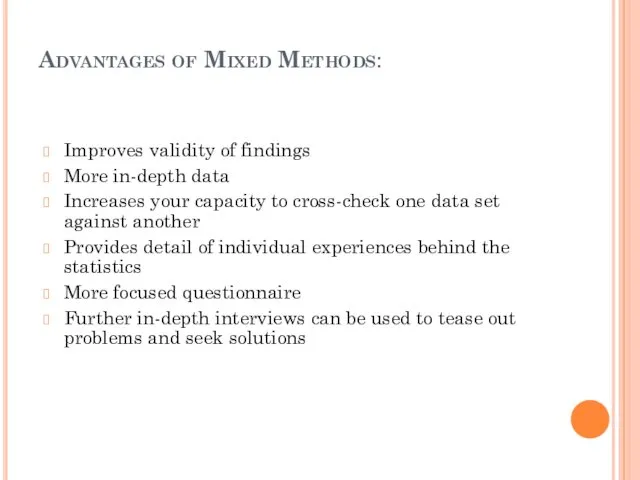
- 23. Advantages of Mixed Methods: Improves validity of findings More in-depth data Increases your capacity to cross-check
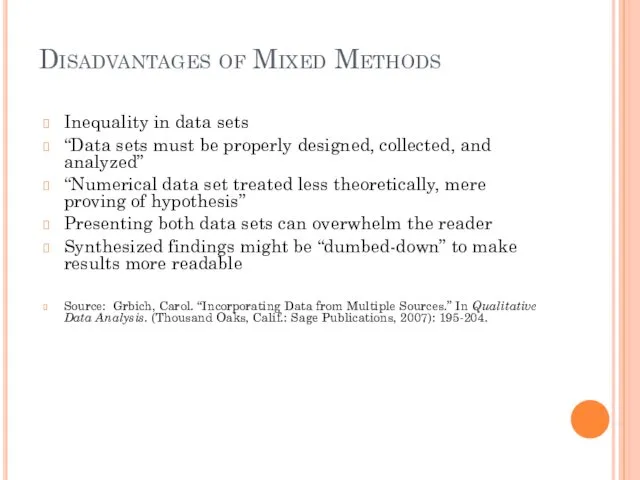
- 24. Disadvantages of Mixed Methods Inequality in data sets “Data sets must be properly designed, collected, and
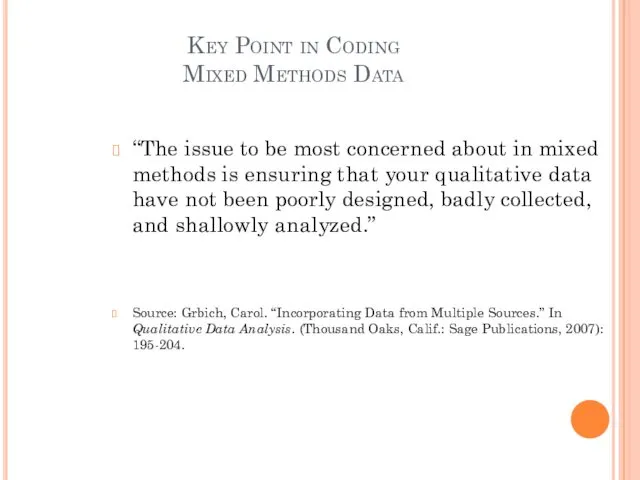
- 25. Key Point in Coding Mixed Methods Data “The issue to be most concerned about in mixed
- 26. Examining a Mixed Methods Research Study Makani, S. & Wooshue, K. (2006). Information seeking behaviors of
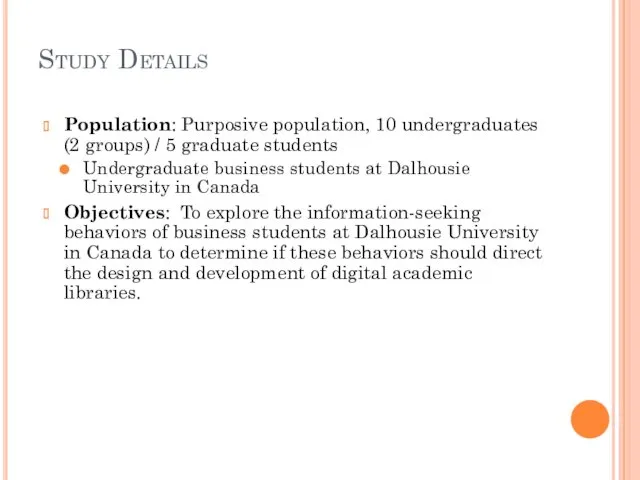
- 27. Study Details Population: Purposive population, 10 undergraduates (2 groups) / 5 graduate students Undergraduate business students
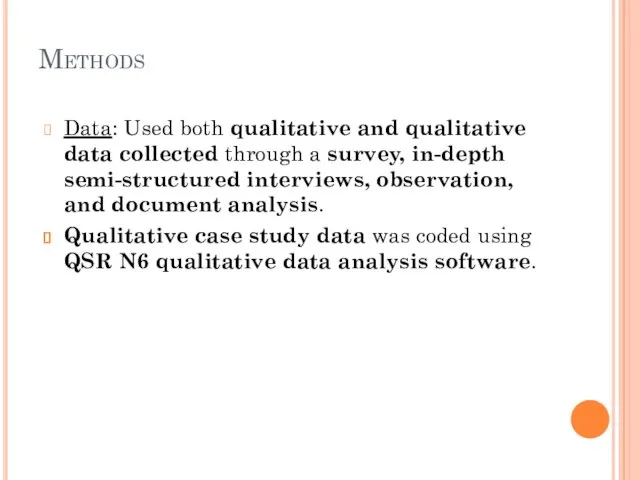
- 28. Methods Data: Used both qualitative and qualitative data collected through a survey, in-depth semi-structured interviews, observation,
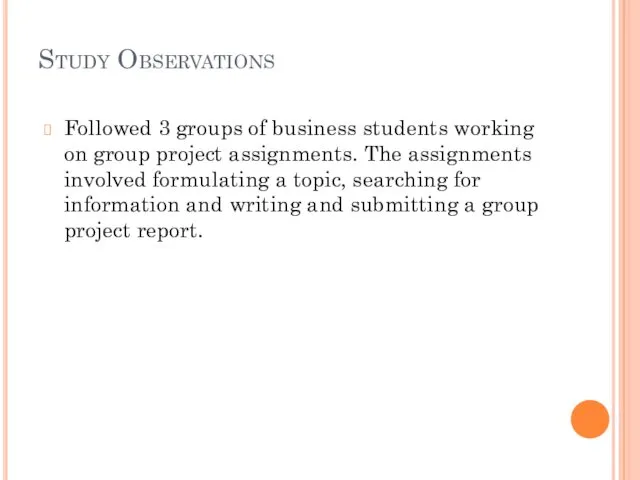
- 29. Study Observations Followed 3 groups of business students working on group project assignments. The assignments involved
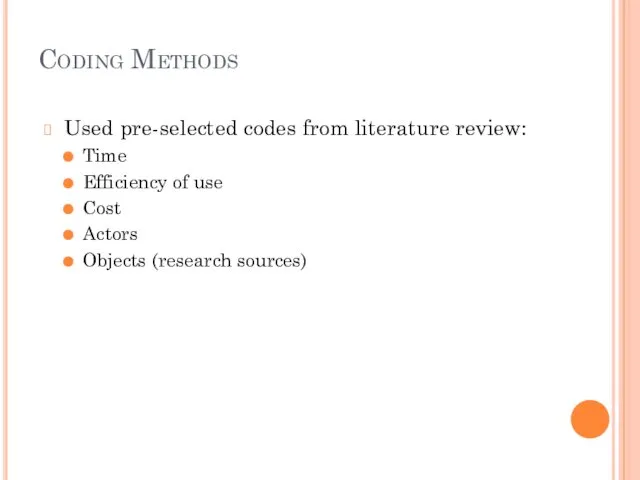
- 30. Coding Methods Used pre-selected codes from literature review: Time Efficiency of use Cost Actors Objects (research
- 31. Coding: Ordinal Measures Opinion Survey What sources do you use to get started on your research?
- 32. Examples of Ratio-Interval Coding and Level of Measurement The age of the survey participants (survey and
- 33. Study Conclusions This study reveals that in order to create an effective business digital library, an
- 34. Study Weaknesses: Use of Mixed Methods Data No discussion of how the survey was delivered electronically
- 35. Study Advantages: Use of Mixed Methods Data Numeric data helped create a clearer picture of the
- 36. OUTLIERS IN DATA ANALYSIS
- 37. WHAT IS AN OUTLIER? Miller (1981): '... An outlier is a single observation or single mean
- 38. WHY ARE OUTLIERS IMPORTANT IN DATA ANALYSIS? Outliers can influence the analysis of a set of
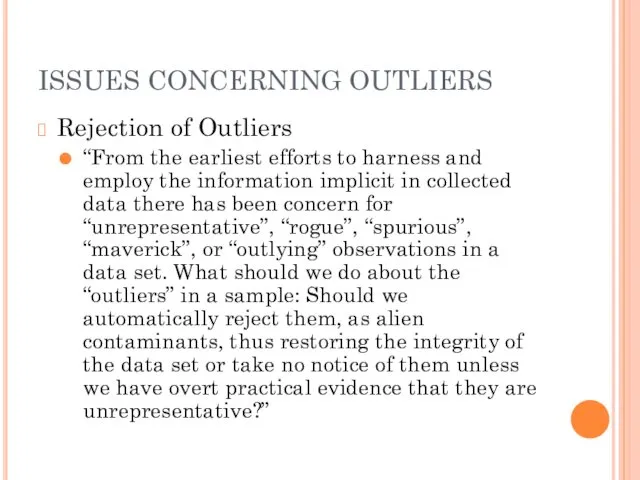
- 39. ISSUES CONCERNING OUTLIERS Rejection of Outliers “From the earliest efforts to harness and employ the information
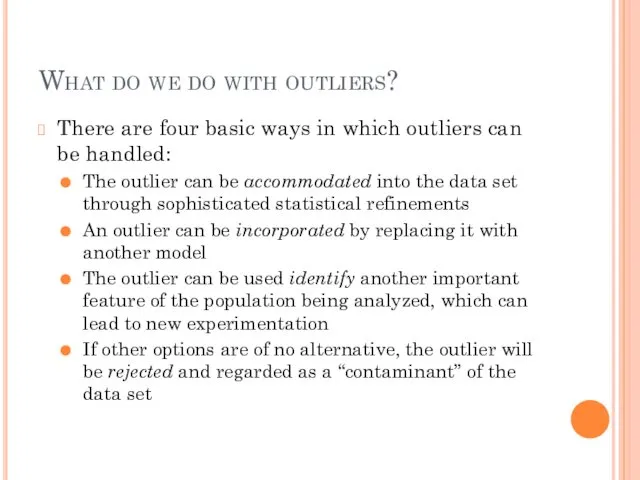
- 40. What do we do with outliers? There are four basic ways in which outliers can be
- 41. A CLASSIC EXAMPLE ON THE USE OF OUTLIERS Hadlum vs. Hadlum (1949)
- 44. Скачать презентацию
WHAT IS DATA CODING?
“A systematic way in which to condense extensive
WHAT IS DATA CODING?
“A systematic way in which to condense extensive
Variables:
Categories:
Gender
Age
Male
Female
18-25
26-33
34-41
Do you like ice cream?
yes
no
Categories and Variables
Variables:
Categories:
Gender
Age
Male
Female
18-25
26-33
34-41
Do you like ice cream?
yes
no
Categories and Variables
WHEN TO CODE
When testing a hypothesis (deductive), categories and codes can
WHEN TO CODE
When testing a hypothesis (deductive), categories and codes can
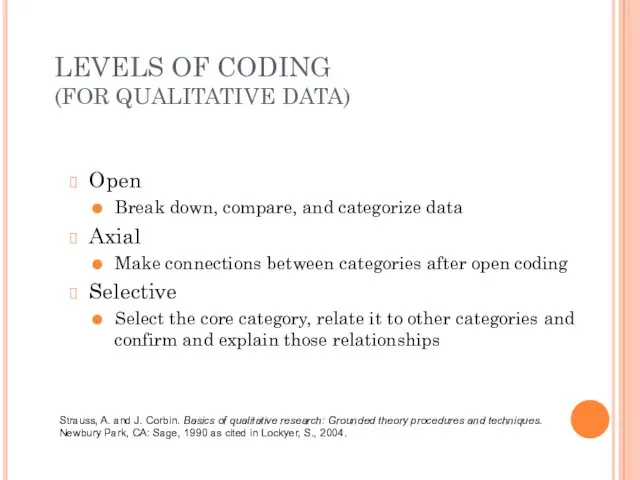
LEVELS OF CODING
(FOR QUALITATIVE DATA)
Open
Break down, compare, and categorize data
Axial
Make connections
LEVELS OF CODING
(FOR QUALITATIVE DATA)
Open
Break down, compare, and categorize data
Axial
Make connections
WHY DO DATA CODING?
It lets you make sense of and analyze
WHY DO DATA CODING?
It lets you make sense of and analyze
DATA SCREENING
Used to identify miscoded, missing, or messy data
Find possible outliers,
DATA SCREENING
Used to identify miscoded, missing, or messy data
Find possible outliers,
DETERMINING CODES
(BOURQUE, 2004)
For surveys or questionnaires, codes are finalized as
DETERMINING CODES
(BOURQUE, 2004)
For surveys or questionnaires, codes are finalized as
IMPORTANCE OF CODEBOOK
(SHENTON, 2004)
Allows study to be repeated and validated.
IMPORTANCE OF CODEBOOK
(SHENTON, 2004)
Allows study to be repeated and validated.
DETERMINING CODES, CONT.
Exhaustive – a unique code number has been created
DETERMINING CODES, CONT.
Exhaustive – a unique code number has been created
DETERMINING CODES, CONT.
Missing Data - includes conditions such as “refused,” “not
DETERMINING CODES, CONT.
Missing Data - includes conditions such as “refused,” “not
CREATING CODE FRAME
PRIOR TO DATA COLLECTION
(BOURQUE, 2004; EPSTEIN &
CREATING CODE FRAME PRIOR TO DATA COLLECTION (BOURQUE, 2004; EPSTEIN &
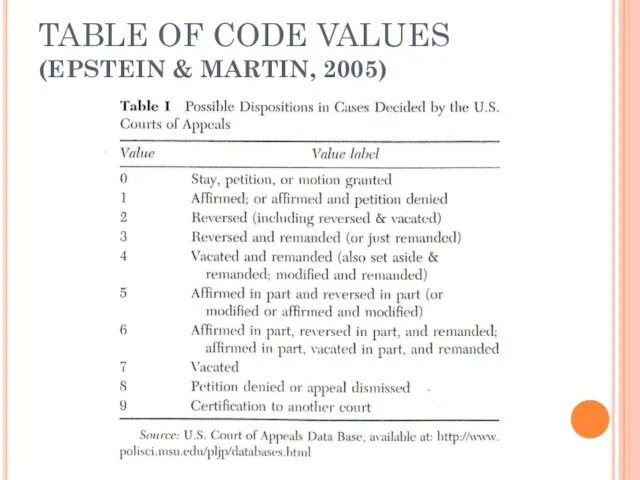
TABLE OF CODE VALUES
(EPSTEIN & MARTIN, 2005)
TABLE OF CODE VALUES
(EPSTEIN & MARTIN, 2005)
TRANSCRIPT (SHENTON, 2004)
Appropriate for open-ended answers as in focus groups, observation,
TRANSCRIPT (SHENTON, 2004)
Appropriate for open-ended answers as in focus groups, observation,
THREE PARTS TO TRANSCRIPT
(SHENTON, 2004)
Background information, ex. time, date, organizations
THREE PARTS TO TRANSCRIPT
(SHENTON, 2004)
Background information, ex. time, date, organizations
POSTCODING (SHENTON, 2004)
Post-meeting observations
Post-transcript review
a. Compilation of insightful quotations
b. Preliminary theme
POSTCODING (SHENTON, 2004)
Post-meeting observations
Post-transcript review
a. Compilation of insightful quotations
b. Preliminary theme

DATA DICTIONARY (SHENTON, 2004)
DATA DICTIONARY (SHENTON, 2004)
REFERENCES
Bourque, Linda B. "Coding." In The Sage Encyclopedia of Social Science
REFERENCES
Bourque, Linda B. "Coding." In The Sage Encyclopedia of Social Science
Levels of Measurement
Levels of Measurement
Coding Mixed Methods:
Advantages and Disadvantages
Coding Mixed Methods:
Advantages and Disadvantages
Position 1 v. Position 2
“When compared to quantitative research, qualitative research
Position 1 v. Position 2
“When compared to quantitative research, qualitative research
Move Toward P1 and P2 Cooperation
Cooperation – last 25 years –
Move Toward P1 and P2 Cooperation
Cooperation – last 25 years –
Advantages of Mixed Methods:
Improves validity of findings
More in-depth data
Increases your capacity
Advantages of Mixed Methods:
Improves validity of findings
More in-depth data
Increases your capacity
Disadvantages of Mixed Methods
Inequality in data sets
“Data sets must be properly
Disadvantages of Mixed Methods
Inequality in data sets
“Data sets must be properly
Key Point in Coding
Mixed Methods Data
“The issue to be most
Key Point in Coding
Mixed Methods Data
“The issue to be most
Examining a Mixed Methods Research Study
Makani, S. & Wooshue, K. (2006).
Examining a Mixed Methods Research Study
Makani, S. & Wooshue, K. (2006).
Study Details
Population: Purposive population, 10 undergraduates (2 groups) / 5 graduate
Study Details
Population: Purposive population, 10 undergraduates (2 groups) / 5 graduate
Methods
Data: Used both qualitative and qualitative data collected through a survey,
Methods
Data: Used both qualitative and qualitative data collected through a survey,
Study Observations
Followed 3 groups of business students working on group project
Study Observations
Followed 3 groups of business students working on group project
Coding Methods
Used pre-selected codes from literature review:
Time
Efficiency of use
Cost
Actors
Objects (research sources)
Coding Methods
Used pre-selected codes from literature review:
Time
Efficiency of use
Cost
Actors
Objects (research sources)
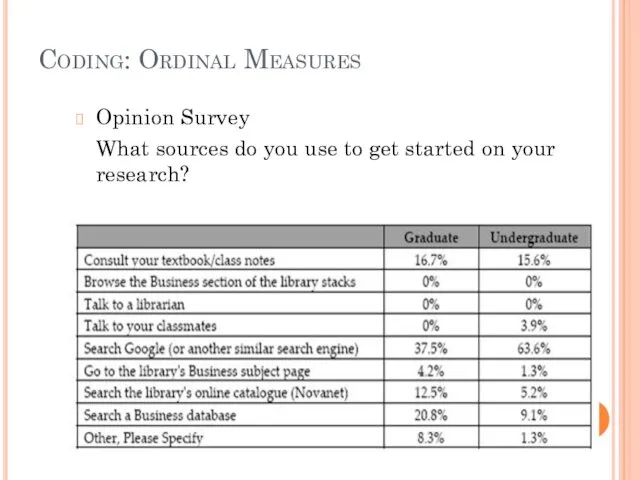
Coding: Ordinal Measures
Opinion Survey
What sources do you use to get started
Coding: Ordinal Measures
Opinion Survey
What sources do you use to get started
Examples of Ratio-Interval Coding and Level of Measurement
The age of the
Examples of Ratio-Interval Coding and Level of Measurement
The age of the
Study Conclusions
This study reveals that in order to create an effective
Study Conclusions
This study reveals that in order to create an effective
Study Weaknesses: Use of Mixed Methods Data
No discussion of how the
Study Weaknesses: Use of Mixed Methods Data
No discussion of how the
Study Advantages: Use of Mixed Methods Data
Numeric data helped create a
Study Advantages: Use of Mixed Methods Data
Numeric data helped create a
OUTLIERS IN DATA ANALYSIS
OUTLIERS IN DATA ANALYSIS
WHAT IS AN OUTLIER?
Miller (1981): '... An outlier is a single
WHAT IS AN OUTLIER?
Miller (1981): '... An outlier is a single
WHY ARE OUTLIERS IMPORTANT IN DATA ANALYSIS?
Outliers can influence the analysis
WHY ARE OUTLIERS IMPORTANT IN DATA ANALYSIS?
Outliers can influence the analysis
ISSUES CONCERNING OUTLIERS
Rejection of Outliers
“From the earliest efforts to harness and
ISSUES CONCERNING OUTLIERS
Rejection of Outliers
“From the earliest efforts to harness and
What do we do with outliers?
There are four basic ways in
What do we do with outliers?
There are four basic ways in
A CLASSIC EXAMPLE ON THE USE OF OUTLIERS
Hadlum vs. Hadlum (1949)
A CLASSIC EXAMPLE ON THE USE OF OUTLIERS
Hadlum vs. Hadlum (1949)

 Викторина по информатике и математике
 Анализ и моделирование развития городской среды на основе больших геоданных
 Устройство компьютера, информатика 8 класс
 Night Ghosts TEAM. Тактики и стратегии
 1. Introduction to Java Language. 3. Large Project Specific
 Технология XSD
 Большие данные
 Методы сортировки
 Жанры тележурналистики
 Метод моделирования в лингвистике
 Принятие решений в сложных системах. Уровни управления и типы ИСУ. (Модуль 3. Лекция 12)
 Принципы подходов к моделированию систем
 Анализ размера рынка
 Техническая система. Лекция 4
 Основы сетевых технологий. Модели сетевого взаимодействия. Часть 1. Лекция 2
 Партионная почта - Предпочтовая подготовка
 Информационная культура. Урок информатики 10 класс
 Компьютерная графика (Autodesk 3ds max) Лекция 9, часть 1. Настройка освещения в сцене (Standard, VRay)
 Это ещё не конец! Мультфильм
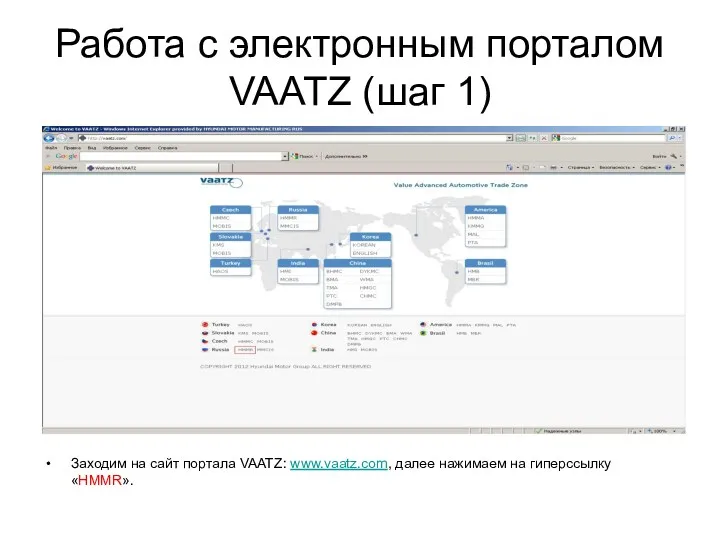 Работа с электронным порталом Vaatz
 Коммуникационные технологии
 Основи програмування та алгоритмічні мови
 Новітня історія WINDOWS
 Green technologies use in computer science and programming
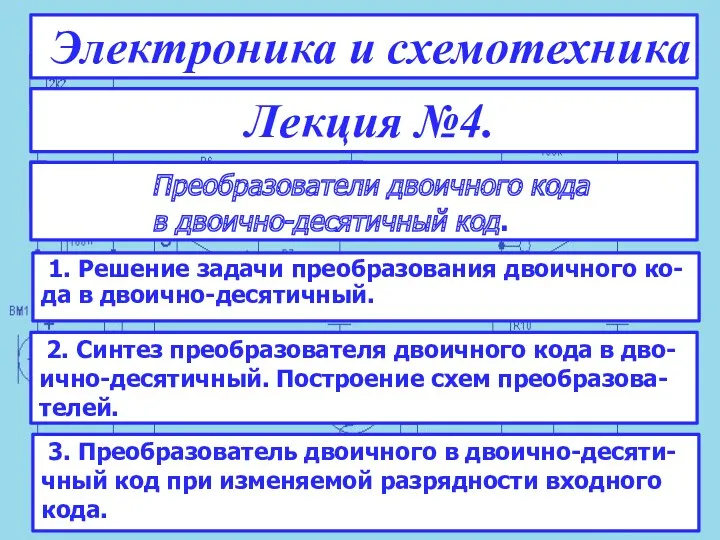 Преобразователи двоичного кода в двоично-десятичный код
 Adobe Illustrator программасының интерфейсі
 Автоматизированное рабочее место (АРМ)
 Редактирование и форматирование текста