- Graphs of motion draw and analyze

Содержание
- 2. Learning Objectives: Plot and interpret distance – time, displacement – time, velocity – time, and acceleration
- 3. Recall Define the following: a. Time b. Distance c. Displacement d. Speed e. Velocity f. Acceleration
- 4. Difference between Distance – time graph from Displacement – time graph * The position-time graph (x-t)
- 5. A distance-time graph, on the other hand, will tell you the distance covered, that is the
- 6. Plot the following data of a car traveling on a straight road with a constant speed,
- 7. Answer the following: 1. Describe the data table. 2. After plotting the data in the table
- 8. Describe the motion of the object having a graph like this.
- 9. As in uniform motion, the distance time graph would be a straight line, because the equal
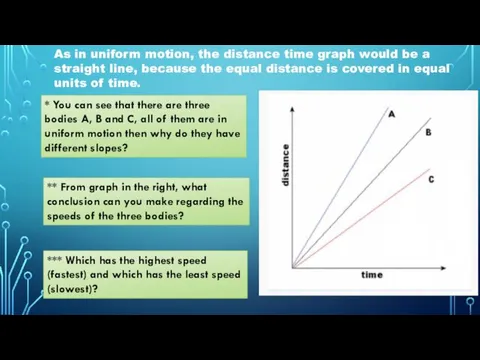
- 10. As in uniform motion, the distance time graph would be a straight line, because the equal
- 11. Position-time Graphs or Displacement - Time Graphs Distance-Time Graphs give you speed, but speed is never
- 12. Describe these graphs’: 1. line 2. slope 3. velocity
- 13. Some more displacement - time graphs exercises. 1. What is the displacement of the car travel
- 14. 1. What does displacement-time graph tells us? 2. Describe the motion of the following lines: A
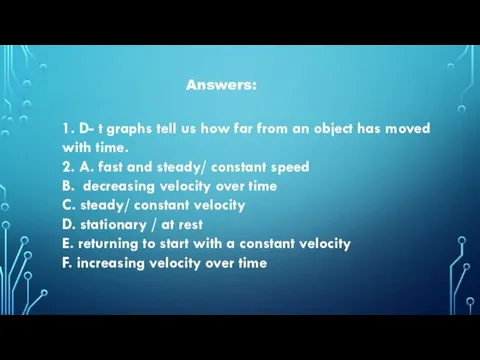
- 15. Answers: 1. D- t graphs tell us how far from an object has moved with time.
- 16. * The velocity of an object is its speed in a particular direction. This means that
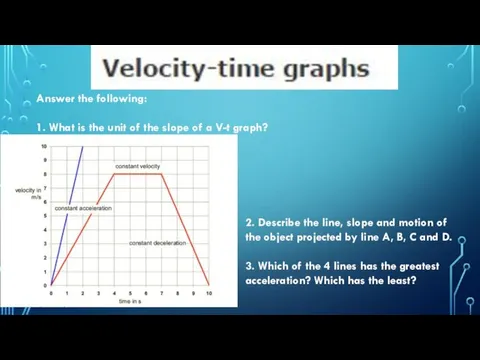
- 17. Answer the following: 1. What is the unit of the slope of a V-t graph? 2.
- 18. 1. An object’s motion is seen in the graph in the right. Interpret the graph. A.
- 19. 2. Draw the velocity – time graph for this displacement -time graph.
- 21. Which of the following graphs show a graph for a uniformly accelerated motion that the distance
- 22. ANSWER
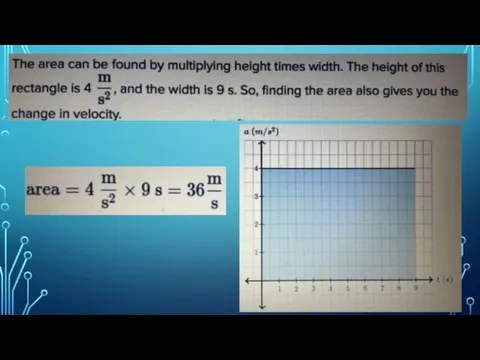
- 23. The shaded area is representative of the displacement during from 0 seconds to 6 seconds. This
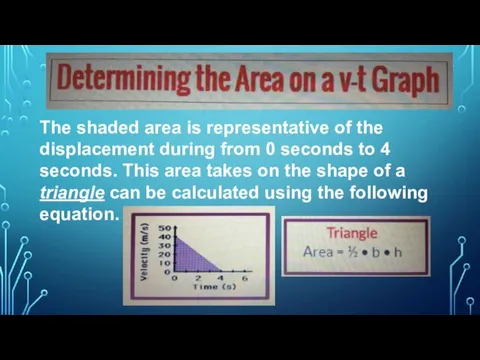
- 24. The shaded area is representative of the displacement during from 0 seconds to 4 seconds. This
- 25. The shaded area is representative of the displacement during from 2 seconds to 5 seconds. This
- 31. Скачать презентацию
Learning Objectives:
Plot and interpret distance – time, displacement – time, velocity
Learning Objectives:
Plot and interpret distance – time, displacement – time, velocity
Recall
Define the following:
a. Time
b. Distance
c. Displacement
d. Speed
e. Velocity
f. Acceleration
Recall
Define the following:
a. Time
b. Distance
c. Displacement
d. Speed
e. Velocity
f. Acceleration
Difference between
Distance – time graph from Displacement – time graph
* The
Difference between
Distance – time graph from Displacement – time graph
* The
A distance-time graph, on the other hand, will tell you the
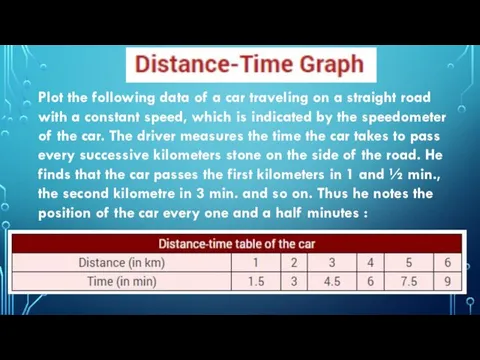
Plot the following data of a car traveling on a straight
Plot the following data of a car traveling on a straight
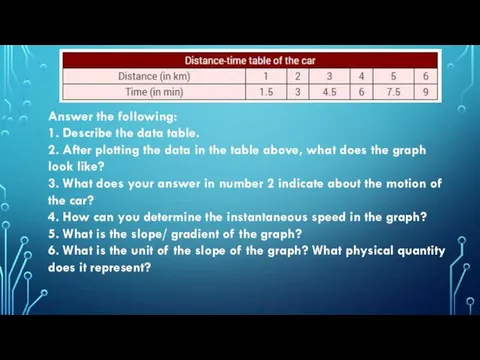
Answer the following:
1. Describe the data table.
2. After plotting the data
Answer the following:
1. Describe the data table.
2. After plotting the data

Describe the motion of the object having a graph like this.
Describe the motion of the object having a graph like this.
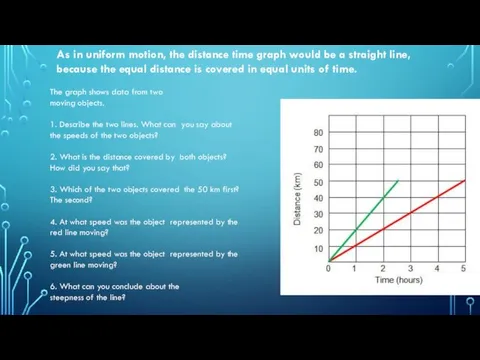
As in uniform motion, the distance time graph would be a
As in uniform motion, the distance time graph would be a
As in uniform motion, the distance time graph would be a
As in uniform motion, the distance time graph would be a
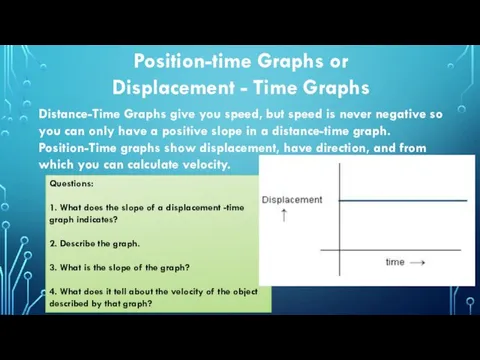
Position-time Graphs or
Displacement - Time Graphs
Distance-Time Graphs give you speed,
Position-time Graphs or
Displacement - Time Graphs
Distance-Time Graphs give you speed,
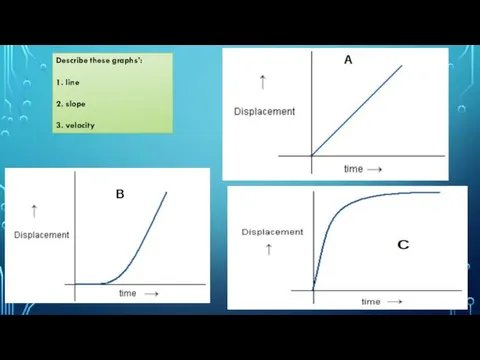
Describe these graphs’:
1. line
2. slope
3. velocity
Describe these graphs’:
1. line
2. slope
3. velocity
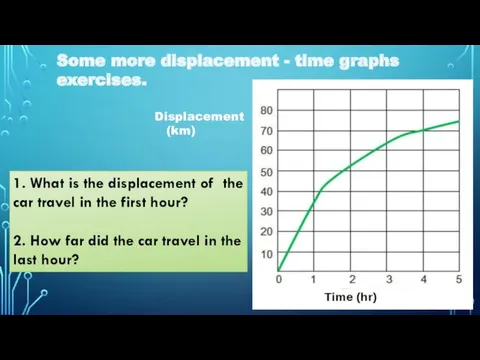
Some more displacement - time graphs exercises.
1. What is the
Some more displacement - time graphs exercises.
1. What is the
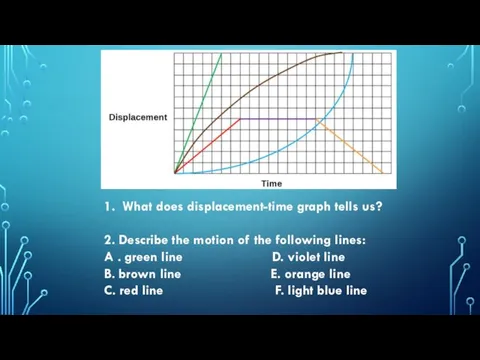
1. What does displacement-time graph tells us?
2. Describe the motion of
1. What does displacement-time graph tells us?
2. Describe the motion of
Answers:
1. D- t graphs tell us how far from an object
Answers:
1. D- t graphs tell us how far from an object
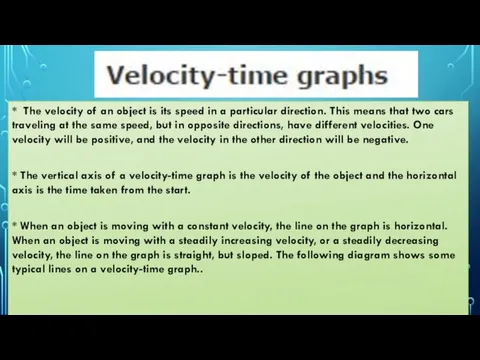
* The velocity of an object is its speed in a
* The velocity of an object is its speed in a
Answer the following:
1. What is the unit of the slope of
Answer the following:
1. What is the unit of the slope of
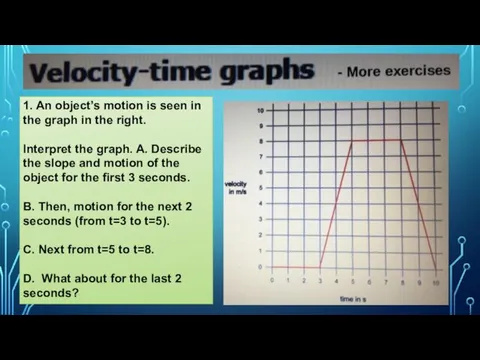
1. An object’s motion is seen in the graph in the
1. An object’s motion is seen in the graph in the
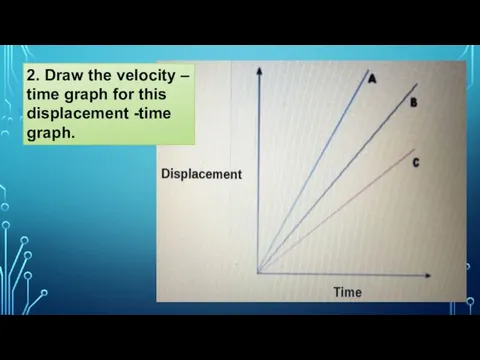
2. Draw the velocity – time graph for this displacement -time
2. Draw the velocity – time graph for this displacement -time

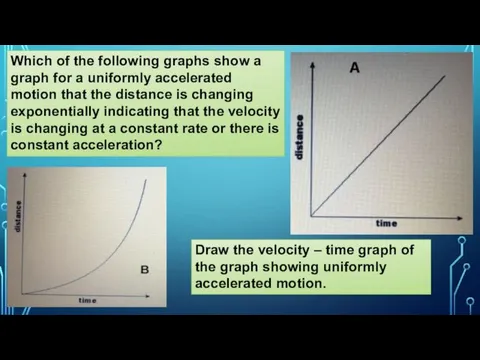
Which of the following graphs show a graph for a uniformly
Which of the following graphs show a graph for a uniformly
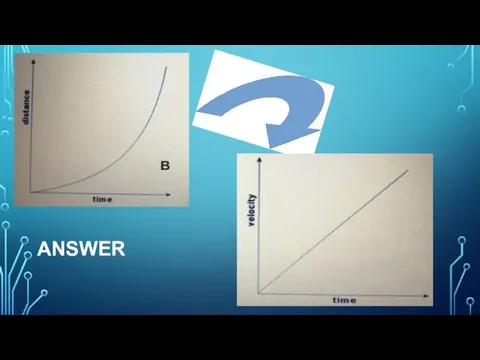
ANSWER
ANSWER

The shaded area is representative of the displacement during from 0
The shaded area is representative of the displacement during from 0
The shaded area is representative of the displacement during from 0
The shaded area is representative of the displacement during from 0
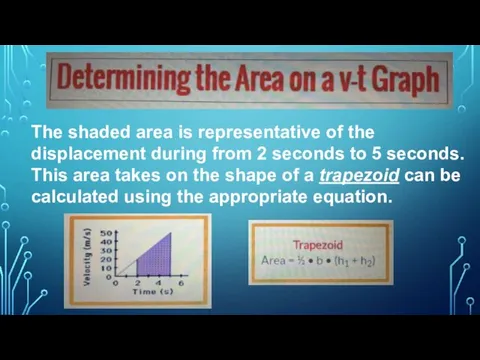
The shaded area is representative of the displacement during from 2
The shaded area is representative of the displacement during from 2
 Путешествие в страну Алгоритмов
 Информационно-библиотечное обеспечение образования
 Конкурсная работа. Винярская Валерия
 Қарапайым HTML-бетін құру HTML тілінің атқаратын қызметі
 Текстурный анализ изображений
 Электронные таблицы. Задание 18
 Настройка трансляции сетевых адресов (NAT) в ОС Linux
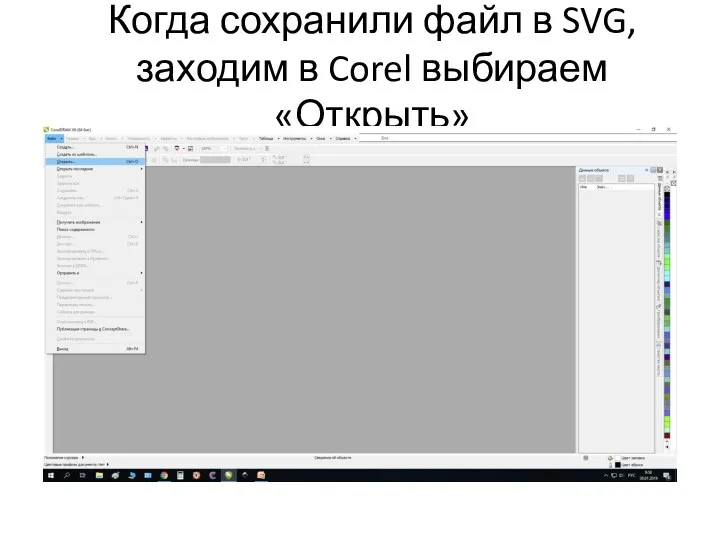 Инструкция по работе с веб-сайтом программного обеспечения Corel
 Урок в 3 классе по информатике по теме Сбор информации
 Метод моделирования в лингвистике
 Системы счисления
 Физические аспекты эксплуатации компьютерных сетей
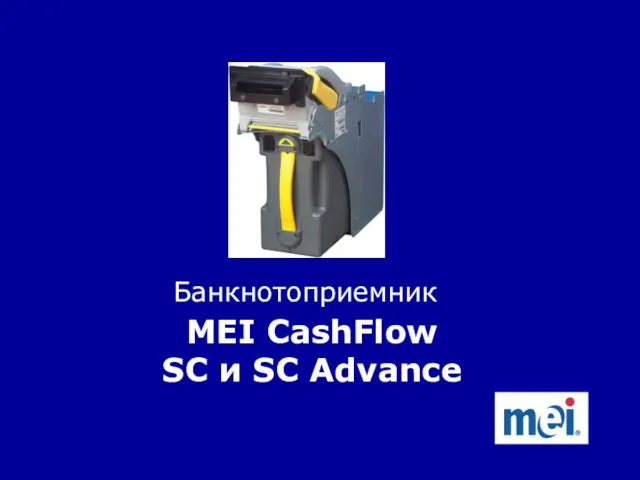 Банкнотоприемник MEI CashFlow SC и SC Advance
 Работа с интерактивной доской StarBoard
 Программирование в среде Matlab
 Способы представления статистических данных
 Внедрение компьютерной технологии PLM на проектное предприятие
 Топологии компьютерных сетей
 Основы сетевых технологий. Канальный уровень модели OSI. Часть 1. Лекция 5
 Интернет-безопасность, что надо о ней знать
 Открытый урок на тему Символьная информация в Turbo Pascal подготовила Ермакова Е.В. СОШ39
 Delphi. Палитра компонентов. Окно редактора кода. Окно конструктора формы
 SQL. Базовый уровень
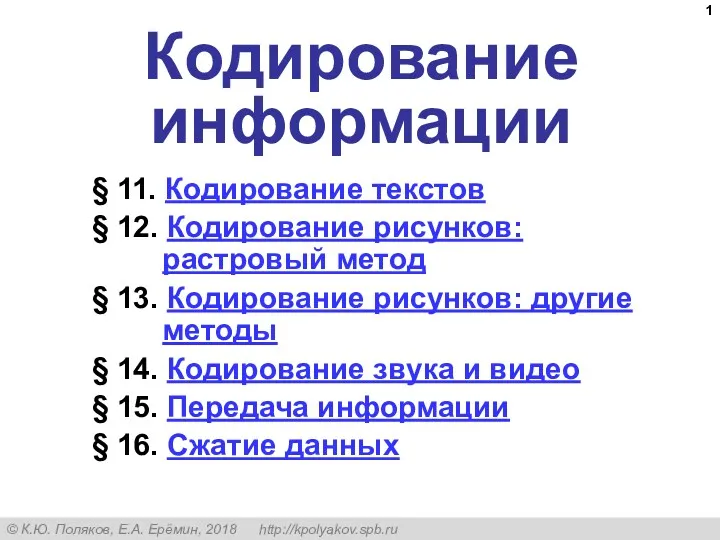 Кодирование данных
 Основные операторы языка Си. Условия, циклы. (Лекция 2)
 Создание своего мини-бота в python
 Тірілген графика. Айнымалылармен жұмыс
 C++. Функции