- Introduction to UML

Содержание
- 2. About this lecture… Will attempt to introduce you to UML and Rational Rose Not possible to
- 3. Introduction to UML What is UML? Motivations for UML Types of UML diagrams UML syntax Descriptions
- 4. What is UML? A standardized, graphical “modeling language” for communicating software design. Allows implementation-independent specification of:
- 5. Motivations for UML UML is a fusion of ideas from several precursor modeling languages. We need
- 6. Types of UML diagrams There are different types of UML diagram, each with slightly different syntax
- 7. UML syntax, 1 Actors: a UML actor indicates an interface (point of interaction) with the system.
- 8. UML syntax, 2 Arrows: arrows indicate all manner of things, depending on which particular type of
- 9. UML syntax, 3 Constraints: allow notation of arbitrary constraints on model elements. Used, for example, to
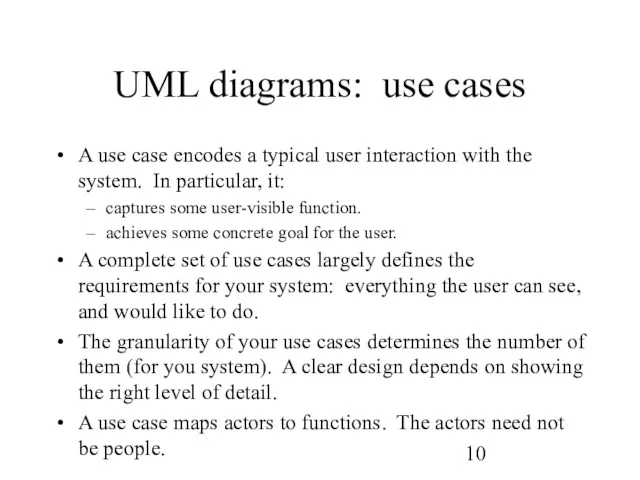
- 10. UML diagrams: use cases A use case encodes a typical user interaction with the system. In
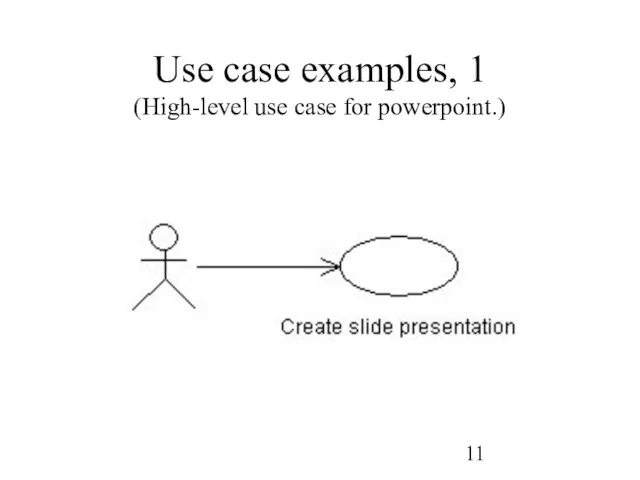
- 11. Use case examples, 1 (High-level use case for powerpoint.)
- 12. About the last example... Although this is a valid use case for powerpoint, and it completely
- 13. Use case examples, 2 (Finer-grained use cases for powerpoint.)
- 14. About the last example... The last example gives a more useful view of powerpoint (or any
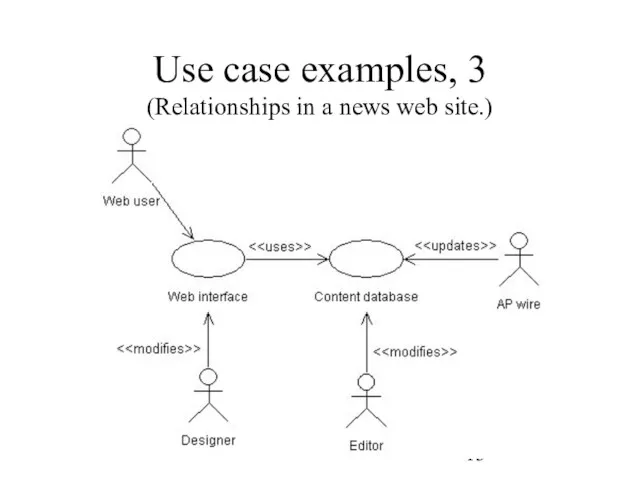
- 15. Use case examples, 3 (Relationships in a news web site.)
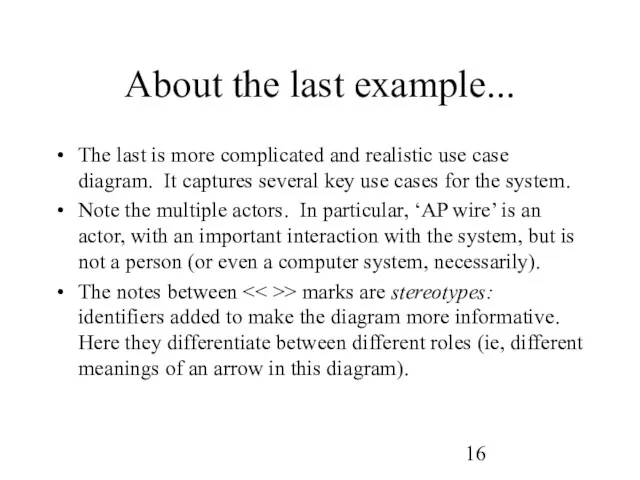
- 16. About the last example... The last is more complicated and realistic use case diagram. It captures
- 17. More UML later, now on to…
- 18. Using Rational Software
- 19. IBM Rational resources Getting the program: http://www-01.ibm.com/software/rational/ http://en.wikipedia.org/wiki/Rational_Software Installed in A32
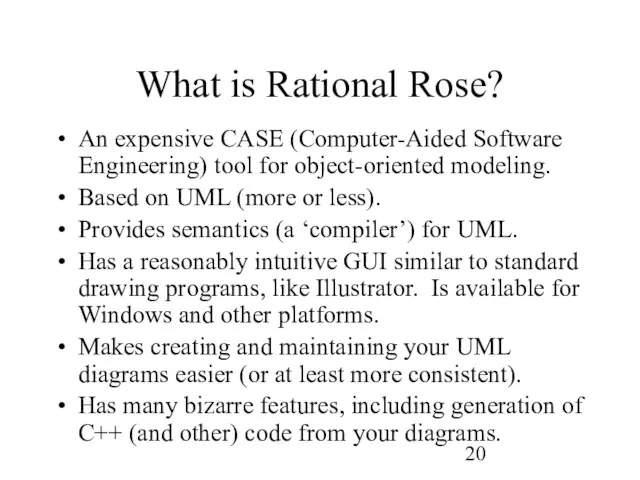
- 20. What is Rational Rose? An expensive CASE (Computer-Aided Software Engineering) tool for object-oriented modeling. Based on
- 21. What is a Rose Model? A Rose “model” is a representation of the problem domain and
- 22. About the next 2 slides… The next slides introduce the Rose UI. Main points are the:
- 23. The Rose User Interface Rose consists of: Standard toolbar Diagram toolbar Browser Documentation window Diagram windows
- 24. Rational Rose Standard Toolbar Browser Documentation Window Diagram Window Diagram Toolbar Status Bar
- 25. About the next slide… Most things in your model (classes, use cases, actors, etc) have all
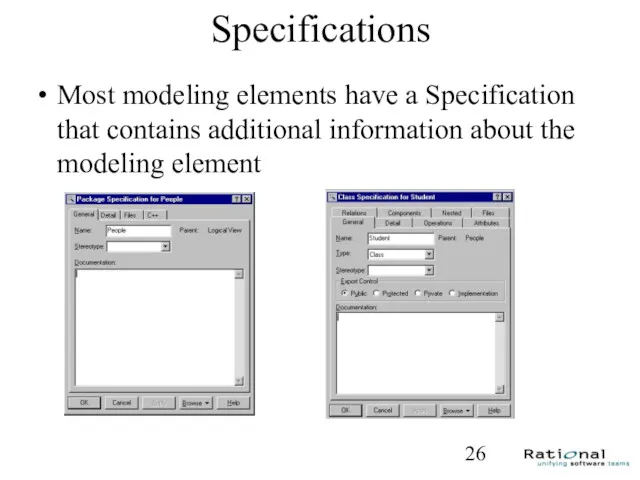
- 26. Specifications Most modeling elements have a Specification that contains additional information about the modeling element
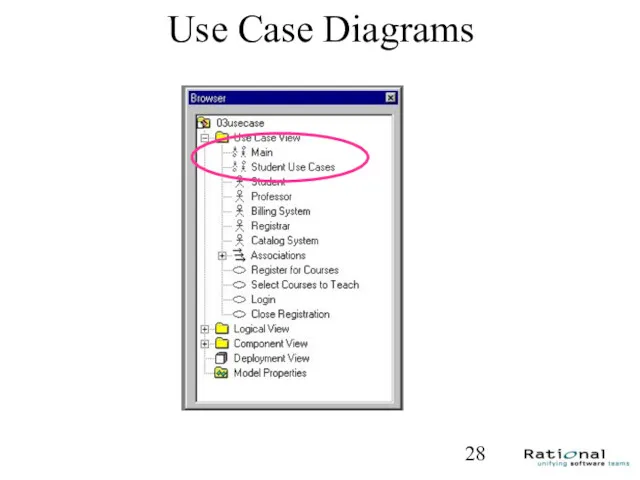
- 27. About the next slide… The next several slides refer to use cases, a particular type of
- 28. Use Case Diagrams
- 29. About the next slide… The next slide shows a full use case diagram. The stick figures
- 30. Use Case Relationships
- 31. About the next slide… The next slide shows how documentation (notes, etc) can be added to
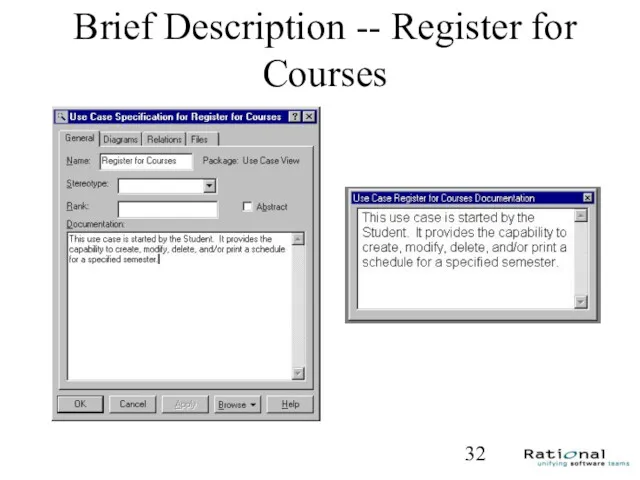
- 32. Brief Description -- Register for Courses
- 33. UML in your documents UML is intended to ease the task of communicating software designs. Typical
- 34. UML pitfalls, 1 UML is a language, with a (reasonably) rigorous syntax and accepted semantics; that
- 35. UML pitfalls, 2 Arrow happiness: people tend to draw arrows (associations) everywhere in their diagrams, inconsistently
- 36. Exporting Rational diagrams? You can use screen captures Find out other ways to do this …
- 37. Learning Rational … Lots of practice Read online tutorial
- 38. Citation These slides borrow heavily: Martin Fowler, UML Distilled Addison-Wesley, 1997 You can also get the
- 39. Back to UML Class Diagrams
- 40. UML diagrams: class diagram Motivated by Object-Oriented design and programming (OOD, OOP). A class diagram partitions
- 41. Class diagram “perspective” Class diagrams can make sense at three distinct levels, or perspectives: Conceptual: the
- 42. Class diagram examples (A classroom scheduling system: specification perspective.)
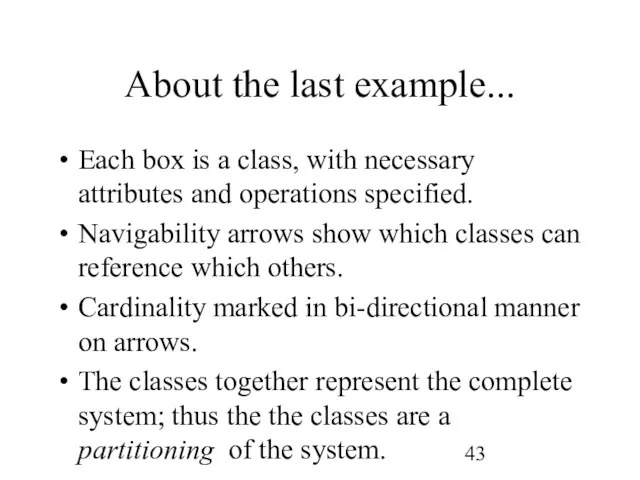
- 43. About the last example... Each box is a class, with necessary attributes and operations specified. Navigability
- 44. Rational Software Class Diagrams
- 45. About the next 4 slides… The next several slides deal with classes and class diagrams. The
- 46. Classes in the Browser
- 47. Packages in the Browser
- 48. Using the Class Specification - Attributes
- 49. Attributes and Operations and the Browser
- 50. About the next slide… The next slide shows how to specify the visibility of class attributes
- 51. Attribute Visibility Options
- 52. About the next 2 slides… The next slide shows the icons for packages and classes in
- 53. What is a Class Diagram? A class diagram is a view of the static structure of
- 54. Relationships Class diagrams may contain the following relationships: Association, aggregation, dependency, realize, and inheritance Notation: Association
- 55. About the next 2 slides… The next slide shows a package diagram, with dependencies. The following
- 56. Package Relationships
- 57. Class Relationships
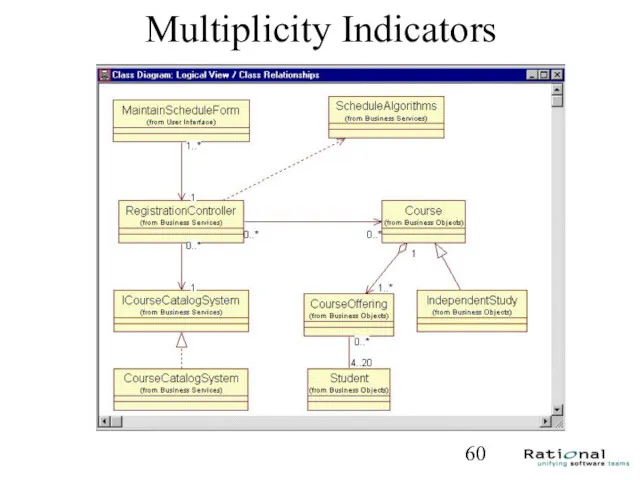
- 58. About the next 2 slides… The next slide shows how cardinalities are denoted in Rose. The
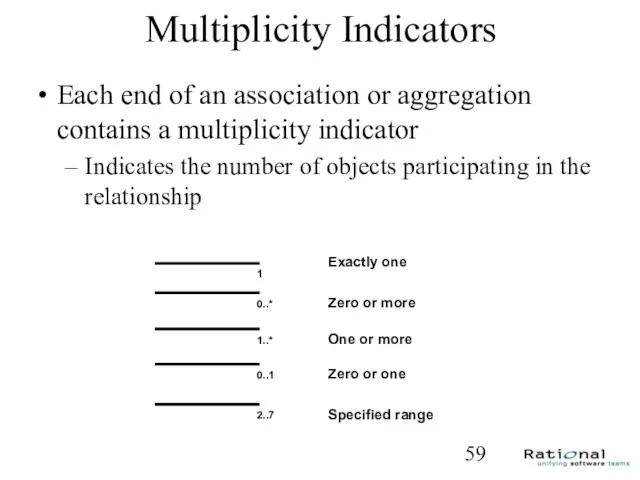
- 59. Multiplicity Indicators Each end of an association or aggregation contains a multiplicity indicator Indicates the number
- 60. Multiplicity Indicators
- 61. Sequence Diagrams
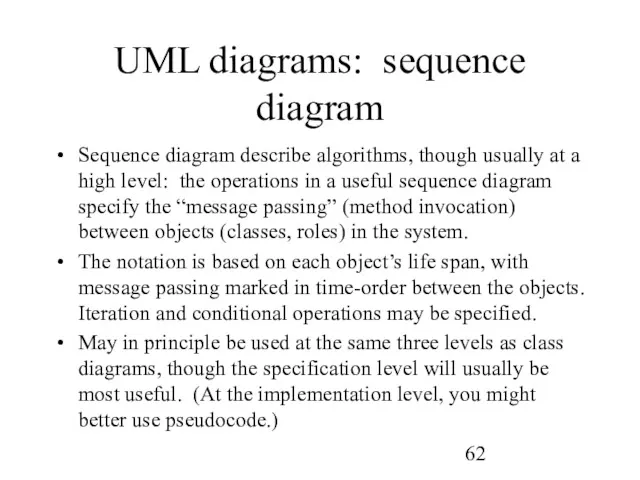
- 62. UML diagrams: sequence diagram Sequence diagram describe algorithms, though usually at a high level: the operations
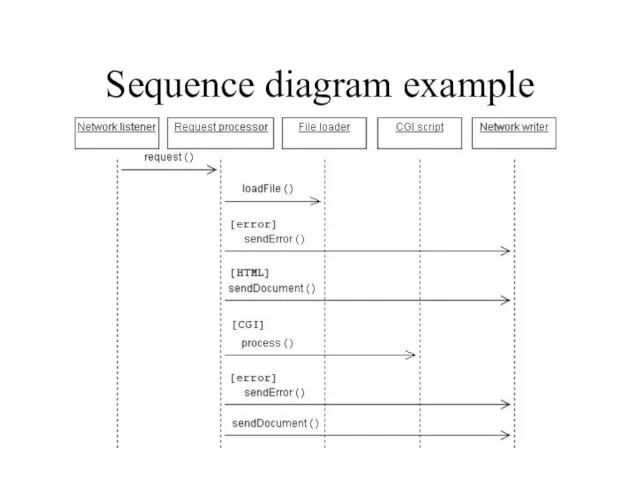
- 63. Sequence diagram example
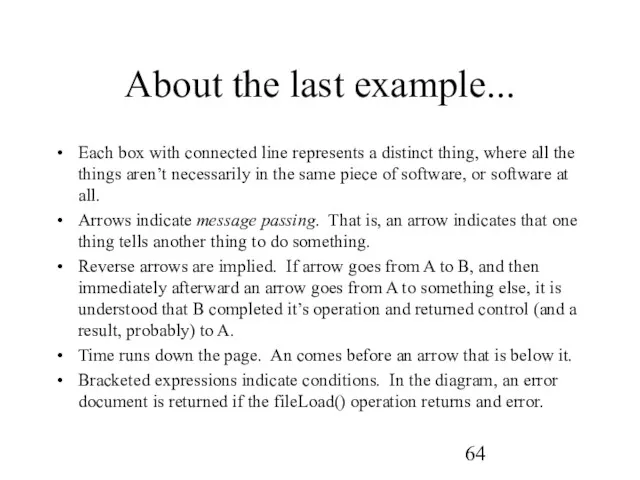
- 64. About the last example... Each box with connected line represents a distinct thing, where all the
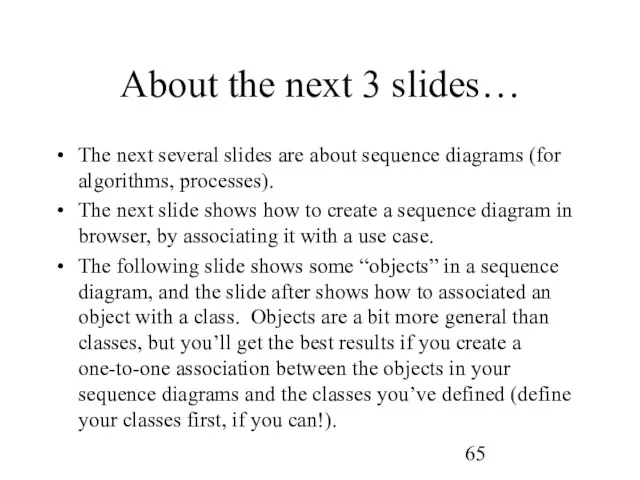
- 65. About the next 3 slides… The next several slides are about sequence diagrams (for algorithms, processes).
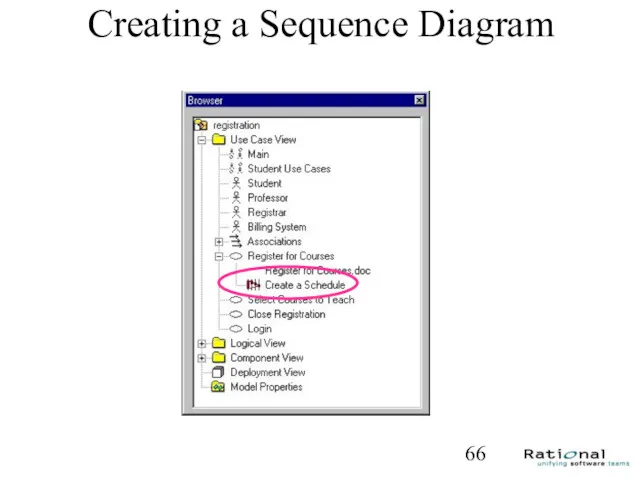
- 66. Creating a Sequence Diagram
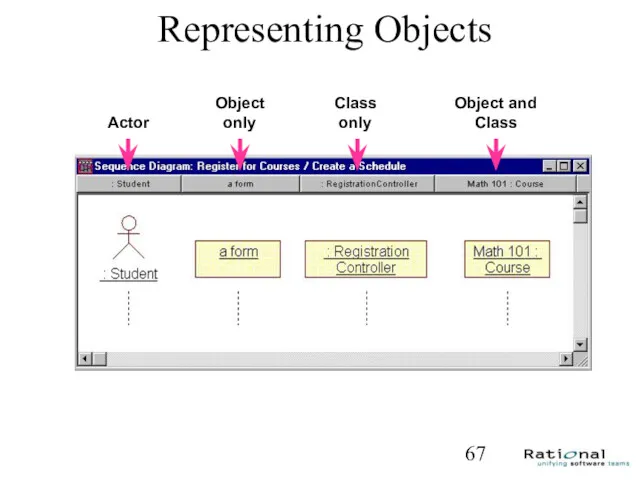
- 67. Representing Objects Actor Object only Class only Object and Class
- 68. Assigning Objects to Classes A new class can be created for the object An object can
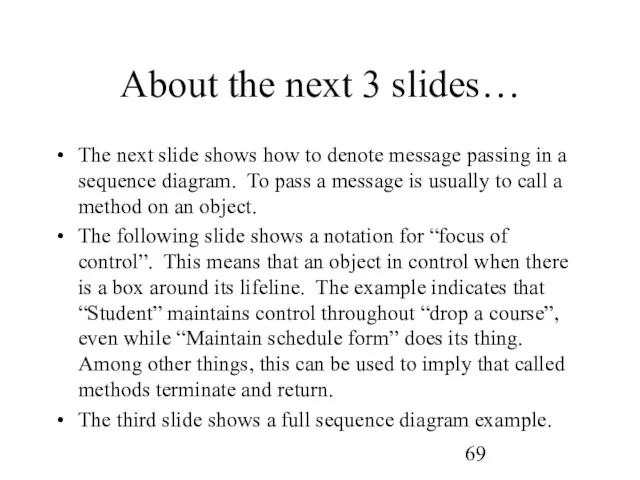
- 69. About the next 3 slides… The next slide shows how to denote message passing in a
- 70. Messages
- 71. Focus of Control
- 72. Exercise: Sequence Diagram
- 73. Other Diagrams
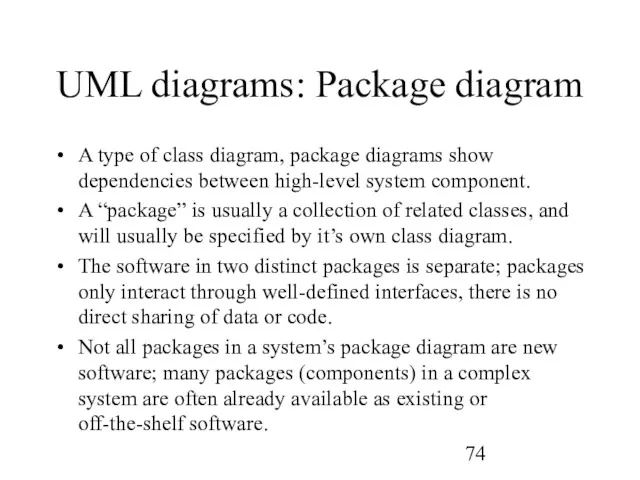
- 74. UML diagrams: Package diagram A type of class diagram, package diagrams show dependencies between high-level system
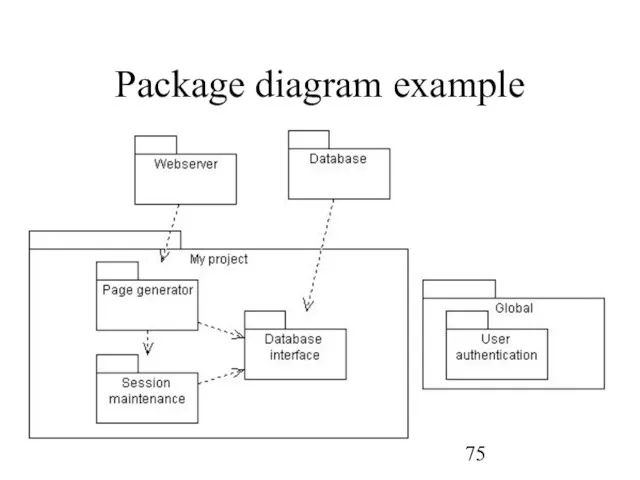
- 75. Package diagram example
- 76. About the last example... This package diagram indicates that: there are three dependent but decoupled software
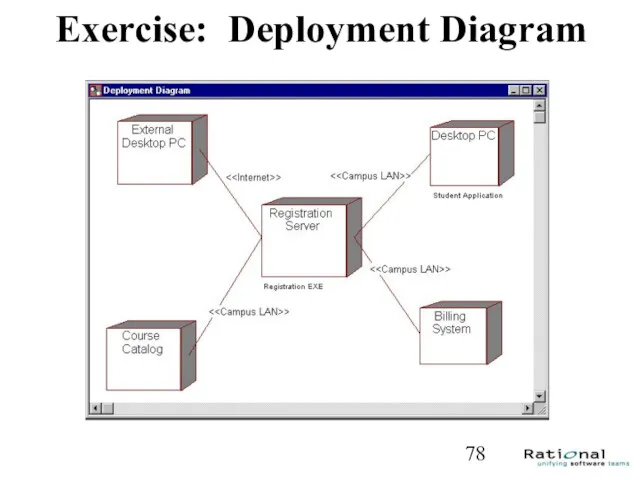
- 77. About the next slide… The next slide shows a complete deployment diagram. A deployment diagram is
- 78. Exercise: Deployment Diagram
- 79. UML diagrams: other diagrams State diagrams: similar in function to sequence diagrams, but with focus on
- 81. Скачать презентацию
About this lecture…
Will attempt to introduce you to UML and Rational
About this lecture…
Will attempt to introduce you to UML and Rational
Introduction to UML
What is UML?
Motivations for UML
Types of UML diagrams
UML syntax
Descriptions
Introduction to UML
What is UML?
Motivations for UML
Types of UML diagrams
UML syntax
Descriptions
What is UML?
A standardized, graphical “modeling language” for communicating software design.
Allows
What is UML?
A standardized, graphical “modeling language” for communicating software design.
Allows
Motivations for UML
UML is a fusion of ideas from several precursor
Motivations for UML
UML is a fusion of ideas from several precursor
Types of UML diagrams
There are different types of UML diagram, each
Types of UML diagrams
There are different types of UML diagram, each
UML syntax, 1
Actors: a UML actor indicates an interface (point of
UML syntax, 1
Actors: a UML actor indicates an interface (point of
UML syntax, 2
Arrows: arrows indicate all manner of things, depending on
UML syntax, 2
Arrows: arrows indicate all manner of things, depending on
UML syntax, 3
Constraints: allow notation of arbitrary constraints on model elements.
UML syntax, 3
Constraints: allow notation of arbitrary constraints on model elements.
UML diagrams: use cases
A use case encodes a typical user interaction
UML diagrams: use cases
A use case encodes a typical user interaction
Use case examples, 1
(High-level use case for powerpoint.)
Use case examples, 1
(High-level use case for powerpoint.)
About the last example...
Although this is a valid use case for
About the last example...
Although this is a valid use case for

Use case examples, 2
(Finer-grained use cases for powerpoint.)
Use case examples, 2
(Finer-grained use cases for powerpoint.)
About the last example...
The last example gives a more useful view
About the last example...
The last example gives a more useful view
Use case examples, 3
(Relationships in a news web site.)
Use case examples, 3
(Relationships in a news web site.)
About the last example...
The last is more complicated and realistic use
About the last example...
The last is more complicated and realistic use

More UML later,
now on to…
More UML later,
now on to…

Using Rational Software
Using Rational Software
IBM Rational resources
Getting the program:
http://www-01.ibm.com/software/rational/
http://en.wikipedia.org/wiki/Rational_Software
Installed in A32
IBM Rational resources
Getting the program:
http://www-01.ibm.com/software/rational/
http://en.wikipedia.org/wiki/Rational_Software
Installed in A32
What is Rational Rose?
An expensive CASE (Computer-Aided Software Engineering) tool for
What is Rational Rose?
An expensive CASE (Computer-Aided Software Engineering) tool for
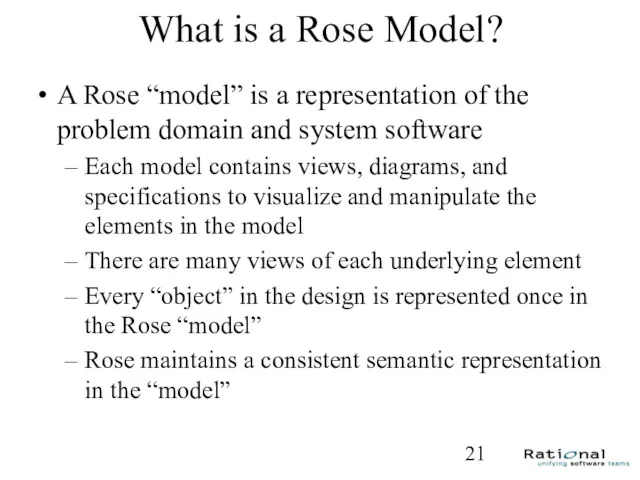
What is a Rose Model?
A Rose “model” is a representation of
What is a Rose Model?
A Rose “model” is a representation of
About the next 2 slides…
The next slides introduce the Rose UI.
Main
About the next 2 slides…
The next slides introduce the Rose UI.
Main
The Rose User Interface
Rose consists of:
Standard toolbar
Diagram toolbar
Browser
Documentation window
Diagram windows
Specifications
Status bar
The Rose User Interface
Rose consists of:
Standard toolbar
Diagram toolbar
Browser
Documentation window
Diagram windows
Specifications
Status bar
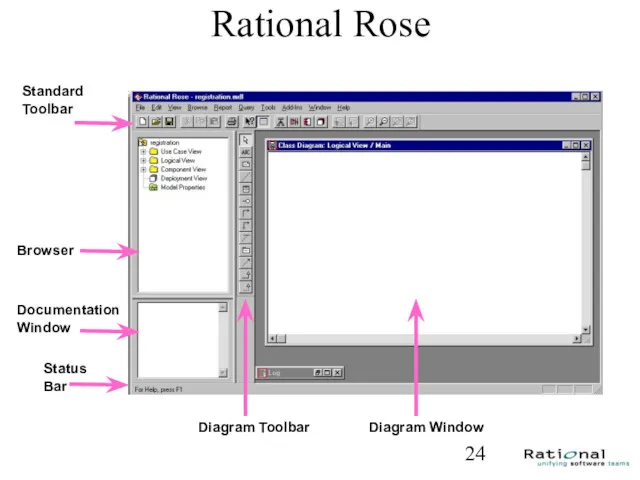
Rational Rose
Standard
Toolbar
Browser
Documentation
Window
Diagram Window
Diagram Toolbar
Status
Bar
Rational Rose
Standard
Toolbar
Browser
Documentation
Window
Diagram Window
Diagram Toolbar
Status
Bar
About the next slide…
Most things in your model (classes, use cases,
About the next slide…
Most things in your model (classes, use cases,
Specifications
Most modeling elements have a Specification that contains additional information about
Specifications
Most modeling elements have a Specification that contains additional information about
About the next slide…
The next several slides refer to use cases,
About the next slide…
The next several slides refer to use cases,
Use Case Diagrams
Use Case Diagrams

About the next slide…
The next slide shows a full use case
About the next slide…
The next slide shows a full use case
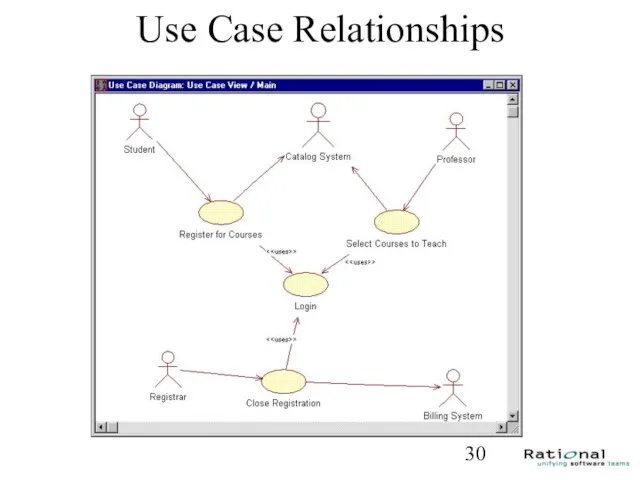
Use Case Relationships
Use Case Relationships
About the next slide…
The next slide shows how documentation (notes, etc)
About the next slide…
The next slide shows how documentation (notes, etc)
Brief Description -- Register for Courses
Brief Description -- Register for Courses
UML in your documents
UML is intended to ease the task of
UML in your documents
UML is intended to ease the task of
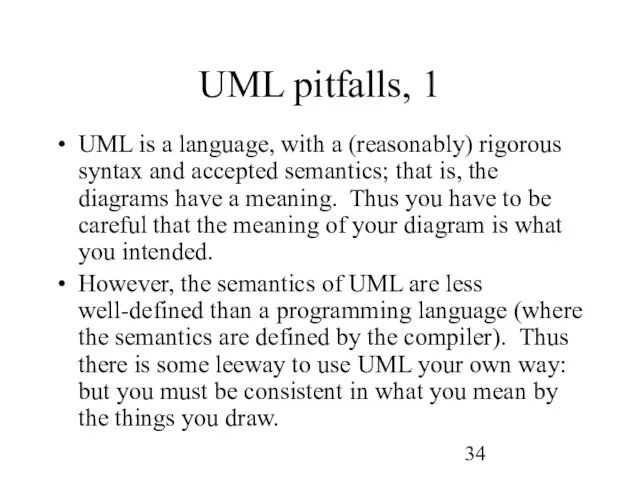
UML pitfalls, 1
UML is a language, with a (reasonably) rigorous syntax
UML pitfalls, 1
UML is a language, with a (reasonably) rigorous syntax
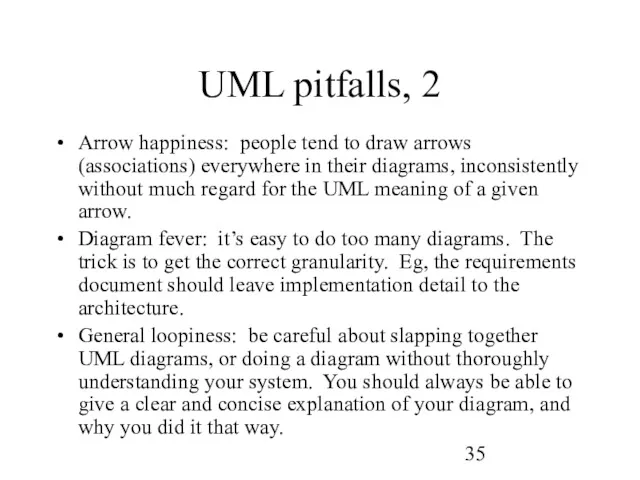
UML pitfalls, 2
Arrow happiness: people tend to draw arrows (associations) everywhere
UML pitfalls, 2
Arrow happiness: people tend to draw arrows (associations) everywhere
Exporting Rational diagrams?
You can use screen captures
Find out other ways to
Exporting Rational diagrams?
You can use screen captures
Find out other ways to
Learning Rational …
Lots of practice
Read online tutorial
Learning Rational …
Lots of practice
Read online tutorial
Citation
These slides borrow heavily:
Martin Fowler, UML Distilled
Addison-Wesley, 1997
You can also get
Citation
These slides borrow heavily:
Martin Fowler, UML Distilled
Addison-Wesley, 1997
You can also get
Back to UML
Class Diagrams
Back to UML
Class Diagrams
UML diagrams: class diagram
Motivated by Object-Oriented design and programming (OOD, OOP).
UML diagrams: class diagram
Motivated by Object-Oriented design and programming (OOD, OOP).
Class diagram “perspective”
Class diagrams can make sense at three distinct levels,
Class diagram “perspective”
Class diagrams can make sense at three distinct levels,

Class diagram examples
(A classroom scheduling system: specification perspective.)
Class diagram examples
(A classroom scheduling system: specification perspective.)
About the last example...
Each box is a class, with necessary attributes
About the last example...
Each box is a class, with necessary attributes
Rational Software
Class Diagrams
Rational Software
Class Diagrams
About the next 4 slides…
The next several slides deal with classes
About the next 4 slides…
The next several slides deal with classes
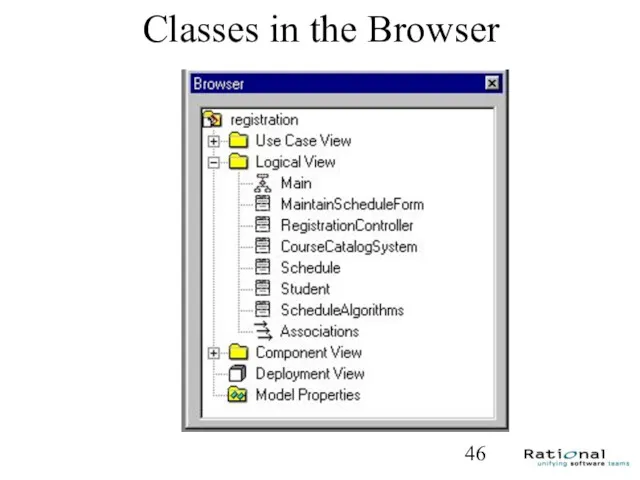
Classes in the Browser
Classes in the Browser
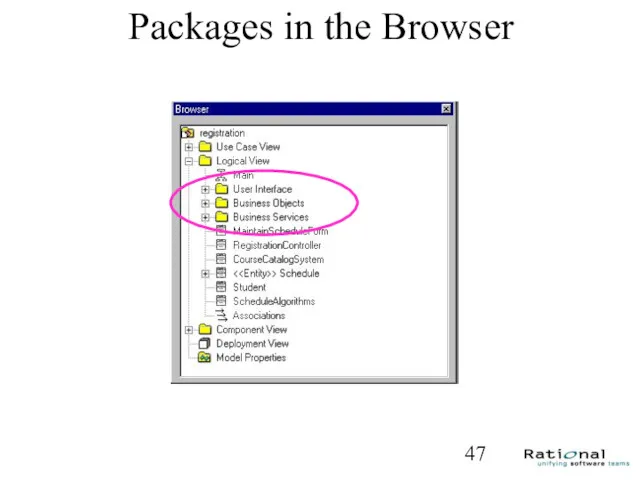
Packages in the Browser
Packages in the Browser
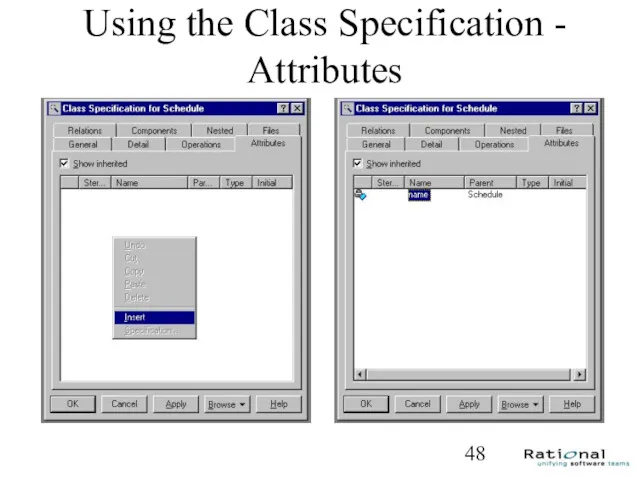
Using the Class Specification - Attributes
Using the Class Specification - Attributes
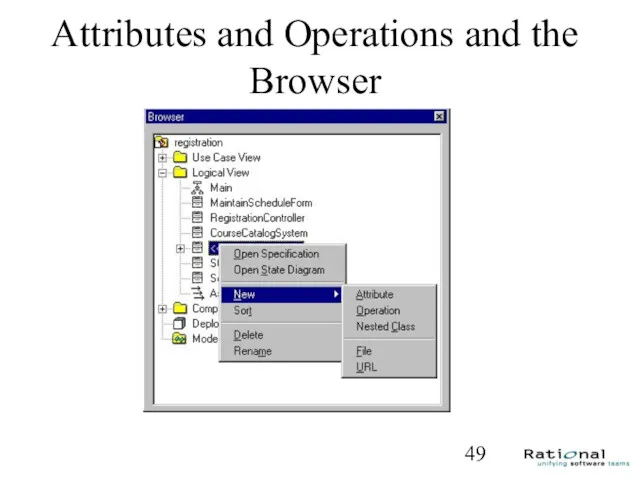
Attributes and Operations and the Browser
Attributes and Operations and the Browser

About the next slide…
The next slide shows how to specify the
About the next slide…
The next slide shows how to specify the

Attribute Visibility Options
Attribute Visibility Options
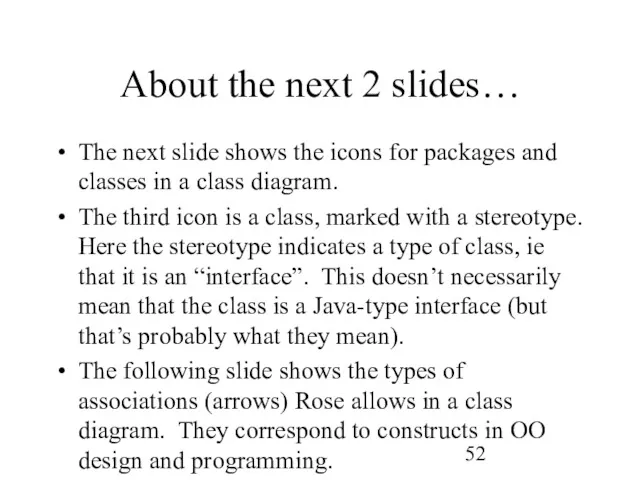
About the next 2 slides…
The next slide shows the icons for
About the next 2 slides…
The next slide shows the icons for
What is a Class Diagram?
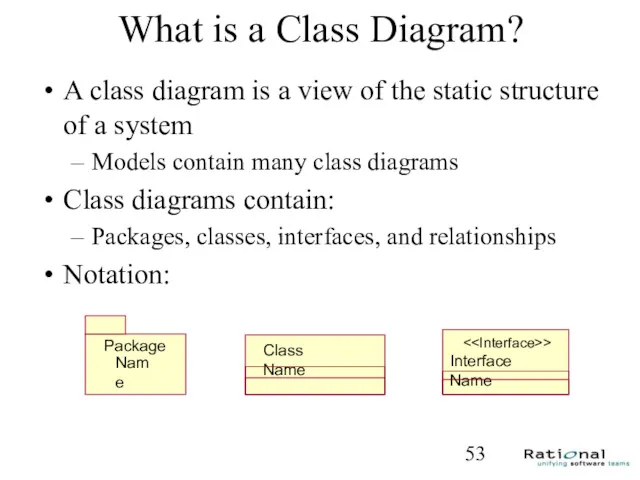
A class diagram is a view of
What is a Class Diagram?
A class diagram is a view of
Relationships
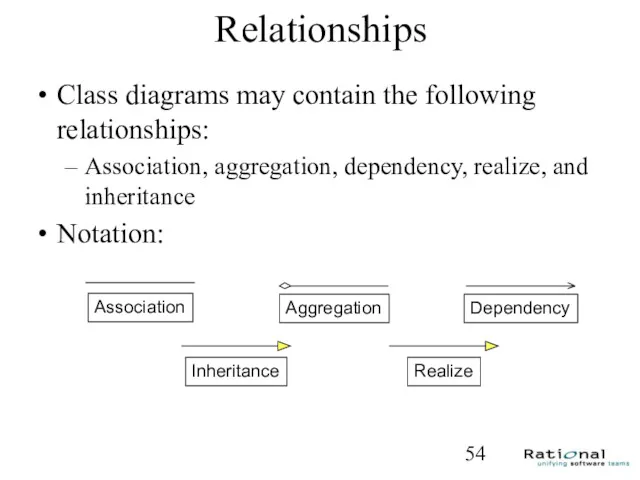
Class diagrams may contain the following relationships:
Association, aggregation, dependency, realize, and
Relationships
Class diagrams may contain the following relationships:
Association, aggregation, dependency, realize, and
About the next 2 slides…
The next slide shows a package diagram,
About the next 2 slides…
The next slide shows a package diagram,
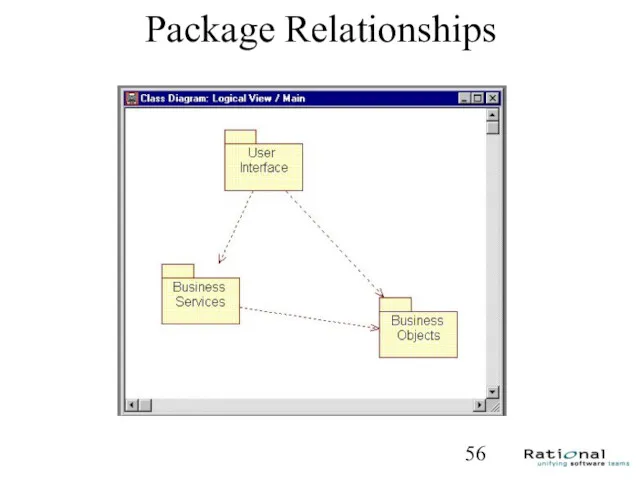
Package Relationships
Package Relationships
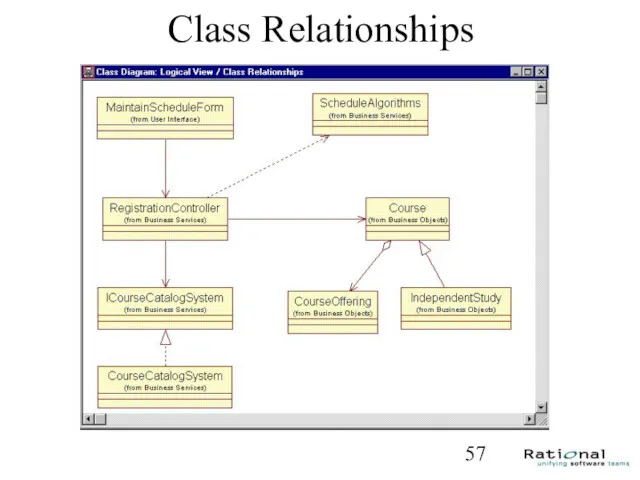
Class Relationships
Class Relationships
About the next 2 slides…
The next slide shows how cardinalities are
About the next 2 slides…
The next slide shows how cardinalities are
Multiplicity Indicators
Each end of an association or aggregation contains a multiplicity
Multiplicity Indicators
Each end of an association or aggregation contains a multiplicity
Multiplicity Indicators
Multiplicity Indicators
Sequence Diagrams
Sequence Diagrams
UML diagrams: sequence diagram
Sequence diagram describe algorithms, though usually at a
UML diagrams: sequence diagram
Sequence diagram describe algorithms, though usually at a
Sequence diagram example
Sequence diagram example
About the last example...
Each box with connected line represents a distinct
About the last example...
Each box with connected line represents a distinct
About the next 3 slides…
The next several slides are about sequence
About the next 3 slides…
The next several slides are about sequence
Creating a Sequence Diagram
Creating a Sequence Diagram
Representing Objects
Actor
Object
only
Class
only
Object and
Class
Representing Objects
Actor
Object
only
Class
only
Object and
Class

Assigning Objects to Classes
A new class can be created for the
Assigning Objects to Classes
A new class can be created for the
About the next 3 slides…
The next slide shows how to denote
About the next 3 slides…
The next slide shows how to denote
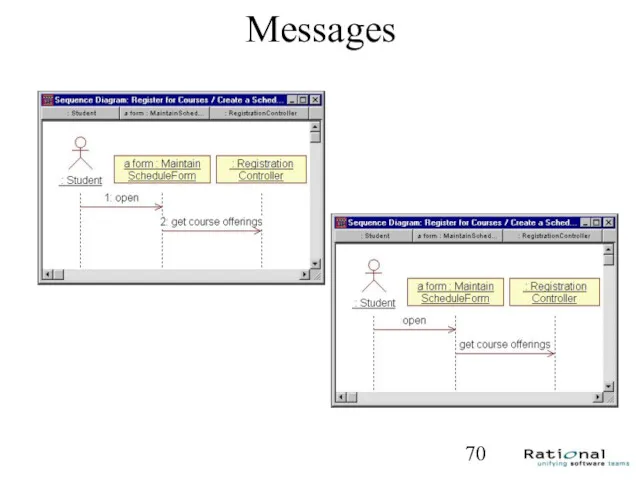
Messages
Messages
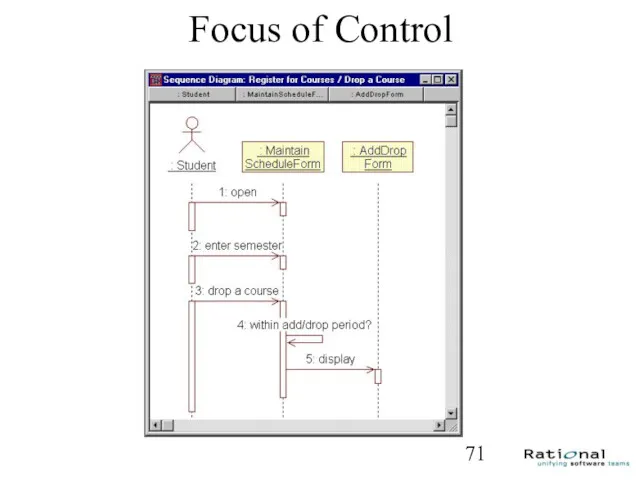
Focus of Control
Focus of Control
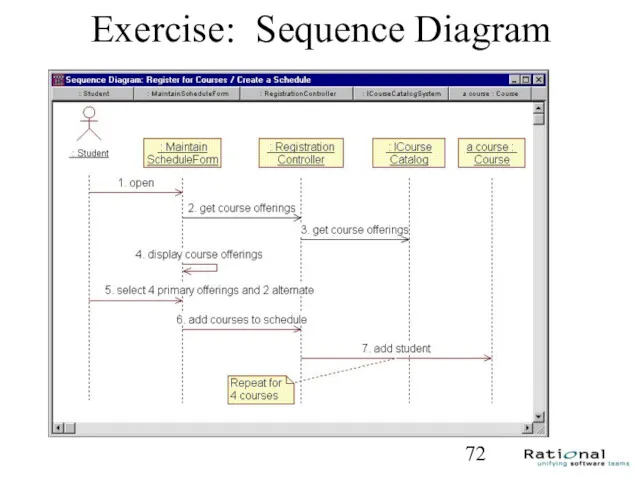
Exercise: Sequence Diagram
Exercise: Sequence Diagram
Other Diagrams
Other Diagrams
UML diagrams: Package diagram
A type of class diagram, package diagrams show
UML diagrams: Package diagram
A type of class diagram, package diagrams show
Package diagram example
Package diagram example
About the last example...
This package diagram indicates that:
there are three
About the last example...
This package diagram indicates that:
there are three
About the next slide…
The next slide shows a complete deployment diagram.
A
About the next slide…
The next slide shows a complete deployment diagram.
A
Exercise: Deployment Diagram
Exercise: Deployment Diagram

UML diagrams: other diagrams
State diagrams: similar in function to sequence diagrams,
UML diagrams: other diagrams
State diagrams: similar in function to sequence diagrams,
 Маршрутизация IP
 Компьютерные сети, Интернет и мультимедиа технологии. Основы сетей передачи данных
 Алгоритмы с ветвящейся структурой
 8 класс, урок Информационные процессы в технике.
 О ходе цифровизации здравоохранения г.Алматы
 Модели данных. (Тема 5.1)
 Лабораторные работы
 презентация к урокам по теме Кодирование числовой информации
 Робота з поштовим клієнтом
 Линейное (и нелинейное) программирование в задачах ЕГЭ по информатике
 Представление нечисловой информации в компьютере. 10 класс
 Программно-технический уровень информационной безопасности
 Презентация Представление числовой информации с помощью систем счисления
 О том, как делать таргетинг на праздники
 Структура электронного учебного пособия. Программирование
 Шифр простой замены (моноалфавитный шифр). Полиалфовитный шифр
 Деятельность АVЕS в рамках кейс-игры
 Algorithms and Programs
 Локальные и глобальные компьютерные сети
 Внешние международные информационные ресурсы
 Текстовый процессор OpenOffice.org Writer
 Текст как форма представления информации
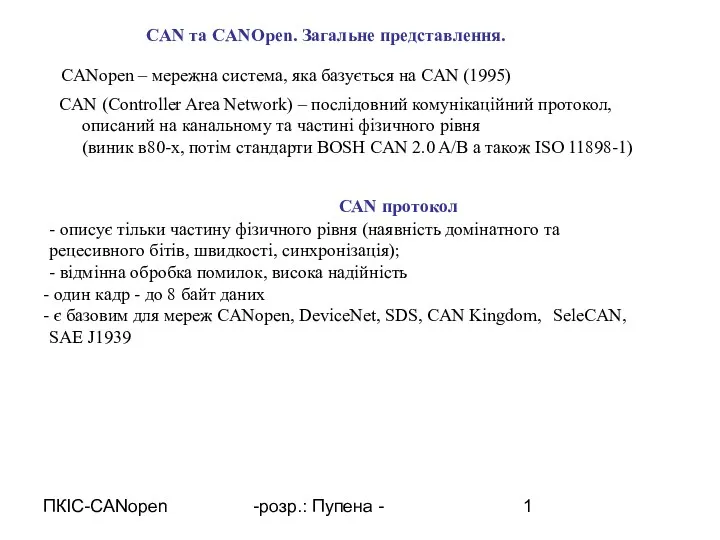 CAN та CANOpen. Загальне представлення
 Impeller. Database programming language
 Знакомство с языком программирования Python
 Окружающий мир – иерархическая система
 Facebook для інструкторів з груднічкового плавання
 Объекты текстового документа