- Machine Learning Algorithms. Lecture 1

Содержание
- 2. Course structure 60% Final exam -> 40%
- 3. Lab “Targets” Weekly targets for your practical work Complete them on time! You’re an adult –
- 4. Assignment Work on assignments individually (!!!) Conduct a deep study of any topic in ML that
- 5. Outline Difference between AI and Machine Learning? Processes behind AI system Applications of AI & ML
- 6. Artificial Intelligence
- 7. Worldwide A.I. investment to top $200bn by 2025 KPMG. July 31, 2018 . “We view AI
- 9. Artificial Intelligence
- 10. Seeing Moving Listening Thinking Learning Language Artificial Intelligence
- 11. Artificial Intelligence Seeing Moving Listening Thinking Learning Language
- 12. Terminator 2 (1991) The media “fear culture” around A.I. is misinformed. So, let’s get some facts
- 13. “Strong” A.I. ...aims to build machines whose overall intellectual ability is indistinguishable from that of a
- 14. “Weak” A.I. …aims to engineer commercially viable "smart" systems
- 15. Science Fiction Science Fact 2050? 2500?
- 17. Artificial Intelligence Seeing Moving Listening Thinking Learning Language
- 18. Machine Learning Mathematical model
- 20. Artificial Intelligence Seeing Moving Listening Thinking Learning Language
- 21. Artificial Intelligence Seeing Moving Listening Thinking Learning Language
- 22. Vision Robotics Speech Language Reasoning Artificial Intelligence
- 23. This course… Machine Learning Algorithms This course
- 24. Machine Learning
- 25. Artificial Intelligence Seeing Moving Listening Thinking Learning Language NLP
- 26. Definition of Machine Learning Arthur Samuel (1959): Machine Learning is the field of study that gives
- 27. DEFINITION OF MACHINE LEARNING Tom Mitchell (1998): a computer program is said to learn from experience
- 28. What are you?
- 29. “Learning” is a process not specific to a substrate (e.g. biological neurons) can be mechanized, with
- 30. Machine Learning algorithms need data Predicting health of a patient needs measurements. Height Weight Systolic blood
- 31. Machine Learning algorithms need data Class, or “label” “Features” “Examples” Historical data in health records for
- 32. Training data + labels
- 33. Training data + labels TRAINING PHASE
- 34. ML algorithms make mistakes Predicting health. Quite a hard problem even for trained professional! Next… Need
- 35. TAXONOMY OF MACHINE LEARNING (A SIMPLISTIC VIEW BASED ON TASKS)
- 36. TAXONOMY OF MACHINE LEARNING (A SIMPLISTIC VIEW BASED ON TASKS) Semi-supervised learning
- 37. SUPERVISED LEARNING ALGORITHMS
- 38. EXAMPLE OF SUPERVISED LEARNING ALGORITHMS: Linear Regression Logistic Regression Nearest Neighbor Gaussian Naive Bayes Decision Trees
- 39. SUPERVISED LEARNING ALGORITHMS Advantages: Supervised learning allows collecting data and produces data output from previous experiences.
- 40. UNSUPERVISED LEARNING ALGORITHMS Unsupervised learning algorithms (unsupervised algorithms) are another type of algorithms. In unsupervised learning
- 41. EXAMPLES OF MACHINE LEARNING TASKS WITHOUT A TEACHER:
- 42. EXAMPLES OF MACHINE LEARNING TASKS WITHOUT A TEACHER:
- 43. TYPES OF UNSUPERVISED LEARNING:
- 44. TYPES OF UNSUPERVISED LEARNING: Clustering Exclusive (partitioning) Agglomerative Overlapping Probabilistic Clustering Types: K-means clustering (DBSCAN, BIRCH)
- 45. MACHINE LEARNING TASKS WITHOUT A TEACHER: When solving machine learning tasks with and without a teacher,
- 46. DISCUSS EXAMPLES In machine learning, each object or row is called a sample or a data
- 47. SEMI-SUPERVISED LEARNING:
- 48. Supervised vs. Unsupervised Machine Learning
- 49. REINFORCEMENT LEARNING ALGORITHMS
- 50. Main points in Reinforcement learning – Input: The input should be an initial state from which
- 51. DIFFERENCE BETWEEN REINFORCEMENT LEARNING AND SUPERVISED LEARNING:
- 52. Types of Reinforcement: There are two types of Reinforcement: Positive – Positive Reinforcement is defined as
- 53. CATEGORIZING BASED ON REQUIRED OUTPUT Another categorization of machine learning tasks arises when one considers the
- 54. DISCUSS EXAMPLES OF REINFORCEMENT LEARNING Various Practical applications of Reinforcement Learning – RL can be used
- 55. SCIENCE WITH PYTHON The amount of digital data that exists is growing at a rapid rate,
- 56. THE STAGES OF DATA SCIENCE Figure 1-1 shows different stages in the field of data science.
- 58. WHY PYTHON? Python is a dynamic and general-purpose programming language that is used in various fields.
- 59. BASIC FEATURES OF PYTHON PYTHON PROVIDES NUMEROUS FEATURES; THE FOLLOWING ARE SOME OF THESE IMPORTANT FEATURES:
- 60. BASIC FEATURES OF PYTHON Object-oriented: Python is an object-oriented language with concepts of classes and objects.
- 61. PORTABLE PYTHON EDITORS (NO INSTALLATION REQUIRED) These editors require no installation: Azure Jupyter Notebooks: The open
- 62. TABULAR DATA AND DATA FORMATS Data is available in different forms. It can be unstructured data,
- 63. PANDAS DATA FRAME A Pandas data frame can be created using various input forms such as
- 64. PYTHON PANDAS DATA SCIENCE LIBRARY Pandas is an open source Python library providing high-performance data manipulation
- 65. TECHNICAL REQUIREMENTS We will use various Python packages, such as NumPy, SciPy, scikit-learn, and Matplotlib, during
- 66. A PANDAS SERIES A series is a one-dimensional labeled array capable of holding data of any
- 67. A PANDAS DATA FRAME A data frame is a two-dimensional data structure. In other words, data
- 68. Linear Model
- 69. Linear Models
- 70. A Problem to Solve with Machine Learning Distinguish rugby players from ballet dancers. You are provided
- 71. Taking measurements…. We have to process the people with a computer, so it needs to be
- 72. Class, or “label” Terminology “Features” “Examples”
- 73. THE SUPERVISED LEARNING PIPELINE Model Testing Data (no labels) Training data and labels Predicted Labels Learning
- 74. Taking measurements…. Weight 63kg 55kg 75kg 50kg 57kg … 85kg 93kg 75kg 99kg 100kg … Height
- 75. A Problem
- 78. where… The “Decision Stump” is a linear model
- 80. LINEARLY SEPARABLE NON-LINEARLY SEPARABLE
- 81. “Error landscape”
- 82. Training data + labels Training = driving lessons Testing = driving test
- 83. THEN THE TEST ! LESSONS….
- 84. Evaluating a Model
- 85. The Nearest Neighbour Classifier
- 86. The Nearest Neighbour Rule Weight 63kg 55kg 75kg 50kg 57kg … 85kg 93kg 75kg 99kg 100kg
- 87. The Nearest Neighbour Rule Weight 63kg 55kg 75kg 50kg 57kg … 85kg 93kg 75kg 99kg 100kg
- 88. Model (memorize the training data) Testing Data (no labels) Training data Predicted Labels Learning algorithm (do
- 89. The K-Nearest Neighbour Classifier Testing point x For each training datapoint x’ measure distance(x,x’) End Sort
- 90. Quick reminder: Pythagoras’ theorem . . . measure distance(x,x’) . . . a.k.a. “Euclidean” distance
- 91. The K-Nearest Neighbour Classifier Weight 63kg 55kg 75kg 50kg 57kg … 85kg 93kg 75kg 99kg 100kg
- 92. The K-Nearest Neighbour Classifier Weight 63kg 55kg 75kg 50kg 57kg … 85kg 93kg 75kg 99kg 100kg
- 93. The K-Nearest Neighbour Classifier Weight 63kg 55kg 75kg 50kg 57kg … 85kg 93kg 75kg 99kg 100kg
- 94. Where’s the decision boundary? height weight Not always a simple straight line!
- 95. Where’s the decision boundary? height weight Not always contiguous!
- 96. The most important concept in Machine Learning
- 97. Looks good so far… The most important concept in Machine Learning
- 98. Looks good so far… Oh no! Mistakes! What happened? The most important concept in Machine Learning
- 99. Looks good so far… Oh no! Mistakes! What happened? We didn’t have all the data. We
- 100. Model (memorize the training data) Testing Data (no labels) Training data Predicted Labels Learning algorithm (do
- 101. Now, how is this problem like handwriting recognition?
- 102. Let’s say the measurements are pixel values. A two-pixel image
- 103. Three dimensions… A three-pixel image This 3-pixel image is represented by a SINGLE point in a
- 104. A three-pixel image (25, 150, 75) Another 3-pixel image Straight line distance between them? Distance between
- 105. A three-pixel image A four-pixel image. A five-pixel image 4-dimensional space? 5-d? 6-d?
- 106. A four-pixel image. A different four-pixel image. (190, 85, 202, 10)
- 107. 16 x 16 pixel image. How many dimensions?
- 108. ? We can measure distance in 256 dimensional space.
- 110. Скачать презентацию
 Построение и анализ таблиц истинности логических выражений
 Отчёт по SMM. Кинотеатр Сатурн IMAX: январь 2020
 Создание макросов
 Единая система идентификации и аутентификации в инфраструктуре электронного правительства РФ (ЕСИА)
 Стандартные вспомогательные средства. Пакет java.util. (Тема 12)
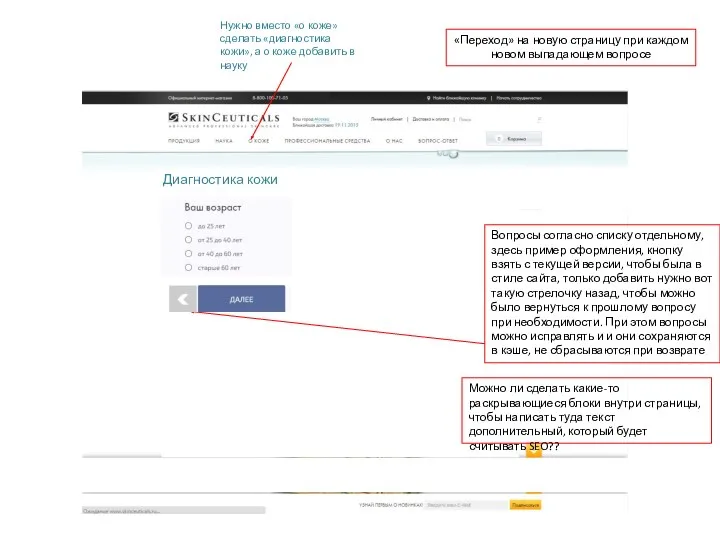 Оформление сайта. Диагностика кожи
 Database management systems. Relational algebra
 Теория автоматов и формальных языков
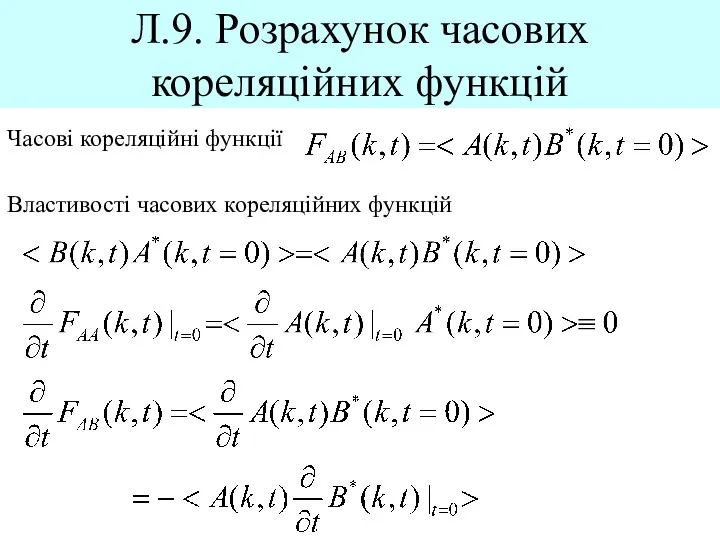 Розрахунок часових кореляційних функцій
 Рекомендации школьникам, педагогам и родителям по подготовке проектов для программы Венчурный акселератор
 Профессиональное программирование. Системно-философский подход
 Системы обработки многопользовательских баз данных
 Introduction of Mobile. Cloud Computing
 Кроссворд Системы счисления
 Создание сайтов
 Решение задач ЕГЭ типа В10
 Информационная безопасность
 Знакомство с алгоритмическим языком стрелок
 Виды компьютерной графики. 8 класс
 Школа Молодого программиста
 Решение для управления данными Ideal Industrial Package
 Программирование на языке Паскаль. Основы
 Безпека в інтернеті!
 Файловая и Клиент-серверная архитектура 1С
 Основы HTML
 Работа с базой PHP MYSQL
 Полиморфизм
 Средства массовой информации как основной институт политической коммуникации. Проблема независимости СМИ