Основы системного администрирования. Мониторинг производительности и устранение неполадок презентация
- Основы системного администрирования. Мониторинг производительности и устранение неполадок

Содержание
- 2. Обзор главы Инструменты мониторинга Использование Performance Monitor Мониторинг журналов событий
- 3. 20.1. Инструменты мониторинга Обзор Task Manager Обзор Performance Monitor Обзор Resource Monitor Обзор Reliability Monitor Обзор
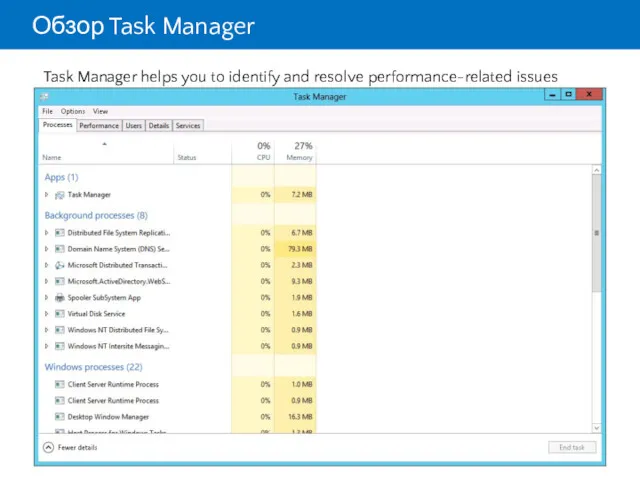
- 4. Обзор Task Manager Task Manager helps you to identify and resolve performance-related issues
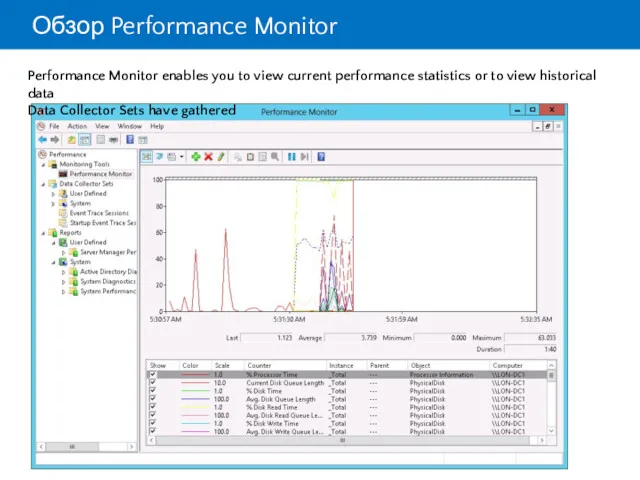
- 5. Обзор Performance Monitor Performance Monitor enables you to view current performance statistics or to view historical
- 6. Обзор Performance Monitor Primary Processor Counters: Processor > % Processor Time Processor > Interrupts/sec System >
- 7. Обзор Resource Monitor Resource Monitor provides an in-depth look at the real-time performance of your server
- 8. Обзор Reliability Monitor Monitors hardware and software issues Provides Stability Index number (from 1 to 10)
- 9. Обзор Event Viewer Event Viewer provides categorized lists of essential Windows log events, and log groupings
- 10. Обзор Event Viewer Event Viewer provides the ability to View multiple logs Create customized views Configure
- 11. Мониторинг сервера с помощью Server Manager Server Manager console: Installed by default on Windows Server 2012,
- 12. 20.2. Использование Performance Monitor Performance Baselines, Trends, and Capacity Planning What Are Data Collector Sets? Demonstration:
- 13. Performance Baselines, Trends, and Capacity Planning By calculating performance baselines for your server environment, you can
- 14. What Are Data Collector Sets? Data collector sets enable you to gather performance-related and other system
- 15. Demonstration: Capturing Counter Data with a Data Collector Set In this demonstration, you will see how
- 18. What Are Alerts? An alert notifies the administrator of events that have occurred or performance thresholds
- 19. Demonstration: Configuring an Alert In this demonstration, you will see how to: Create a data collector
- 21. Demonstration: Viewing Reports in Performance Monitor In this demonstration, you will see how to view a
- 22. Monitoring Network Infrastructure Services Monitoring is essential for: Optimizing network infrastructure server performance Troubleshooting servers
- 23. Considerations for Monitoring Virtual Machines Considerations for monitoring virtual machines: Virtual machines must be assigned sufficient
- 24. 20.3. Мониторинг журналов событий Using Server Manager to View Event Logs What Is a Custom View?
- 25. Using Server Manager to View Event Logs Server Manager provides a centralized location for event logs
- 26. What Is a Custom View? Custom views allow you to query and sort just the events
- 27. Demonstration: Creating a Custom View In this demonstration, you will see how to: View Server Roles
- 28. What Are Event Subscriptions? Event subscriptions allow you to collect event logs from multiple servers, and
- 29. Demonstration: Configuring an Event Subscription In this demonstration, you will see how to: Configure the source
- 32. Скачать презентацию
Обзор главы
Инструменты мониторинга
Использование Performance Monitor
Мониторинг журналов событий
Обзор главы
Инструменты мониторинга
Использование Performance Monitor
Мониторинг журналов событий
20.1. Инструменты мониторинга
Обзор Task Manager
Обзор Performance Monitor
Обзор Resource Monitor
Обзор Reliability Monitor
Обзор
20.1. Инструменты мониторинга
Обзор Task Manager Обзор Performance Monitor Обзор Resource Monitor Обзор Reliability Monitor Обзор
Обзор Task Manager
Task Manager helps you to identify and resolve performance-related
Обзор Task Manager
Task Manager helps you to identify and resolve performance-related
Обзор Performance Monitor
Performance Monitor enables you to view current performance statistics
Обзор Performance Monitor
Performance Monitor enables you to view current performance statistics
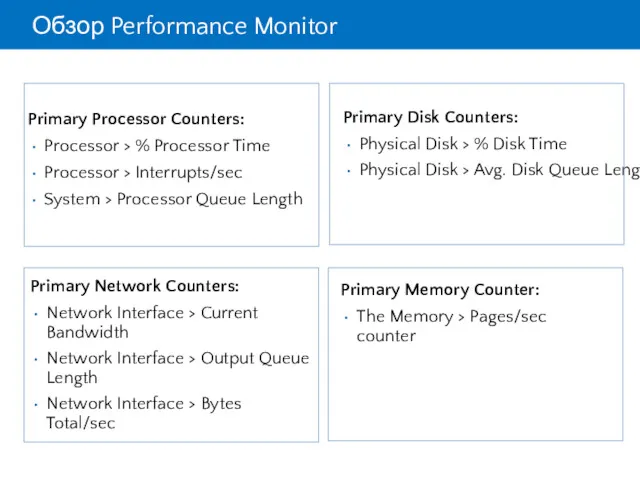
Обзор Performance Monitor
Primary Processor Counters:
Processor > % Processor Time
Processor > Interrupts/sec
System
Обзор Performance Monitor
Primary Processor Counters:
Processor > % Processor Time
Processor > Interrupts/sec
System
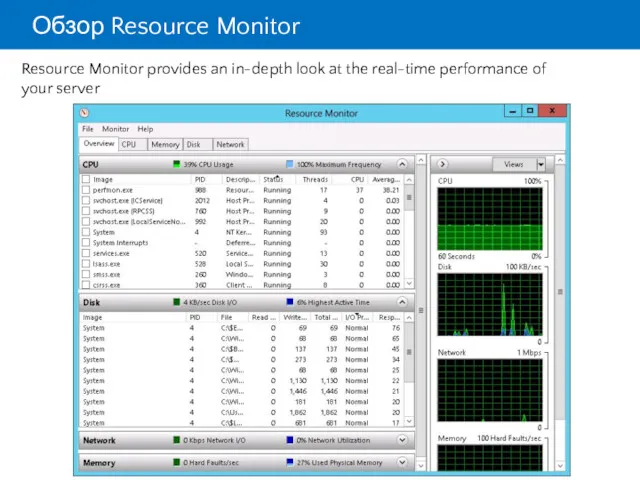
Обзор Resource Monitor
Resource Monitor provides an in-depth look at the real-time
Обзор Resource Monitor
Resource Monitor provides an in-depth look at the real-time
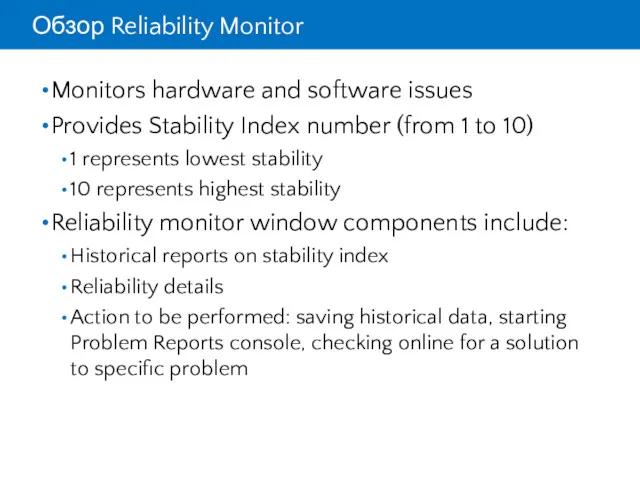
Обзор Reliability Monitor
Monitors hardware and software issues
Provides Stability Index number (from
Обзор Reliability Monitor
Monitors hardware and software issues
Provides Stability Index number (from

Обзор Event Viewer
Event Viewer provides categorized lists of essential Windows log
Обзор Event Viewer
Event Viewer provides categorized lists of essential Windows log
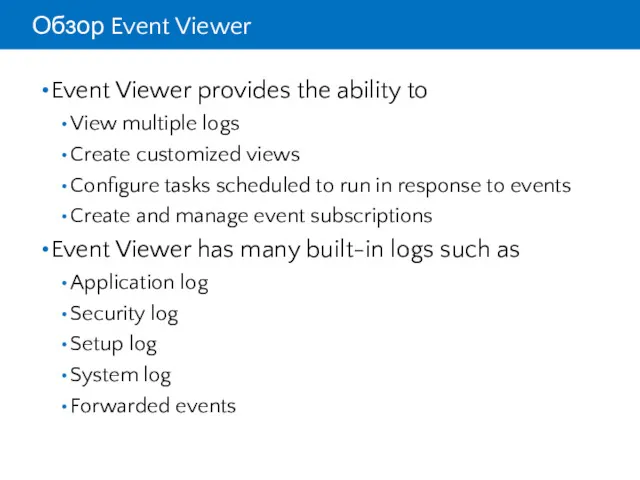
Обзор Event Viewer
Event Viewer provides the ability to
View multiple logs
Create customized
Обзор Event Viewer
Event Viewer provides the ability to
View multiple logs
Create customized
Мониторинг сервера с помощью Server Manager
Server Manager console:
Installed by default on
Мониторинг сервера с помощью Server Manager
Server Manager console:
Installed by default on
20.2. Использование Performance Monitor
Performance Baselines, Trends, and Capacity Planning
What Are Data
20.2. Использование Performance Monitor
Performance Baselines, Trends, and Capacity Planning What Are Data
Performance Baselines, Trends, and Capacity Planning
By calculating performance baselines for your
Performance Baselines, Trends, and Capacity Planning
By calculating performance baselines for your
What Are Data Collector Sets?
Data collector sets enable you to gather
What Are Data Collector Sets?
Data collector sets enable you to gather
Demonstration: Capturing Counter Data with a Data Collector Set
In this demonstration,
Demonstration: Capturing Counter Data with a Data Collector Set
In this demonstration,


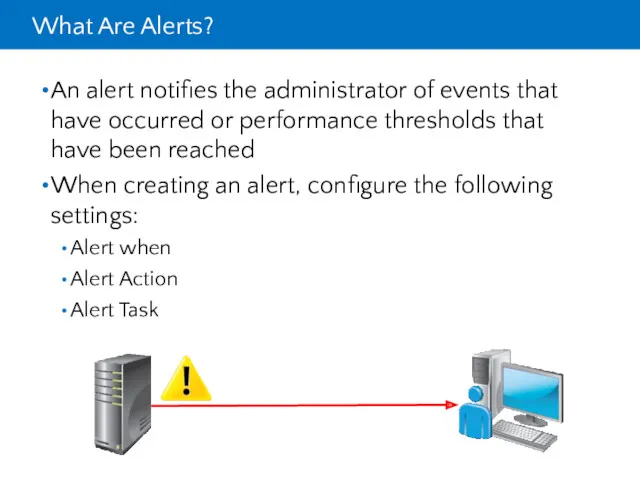
What Are Alerts?
An alert notifies the administrator of events that have
What Are Alerts?
An alert notifies the administrator of events that have

Demonstration: Configuring an Alert
In this demonstration, you will see how to:
Create
Demonstration: Configuring an Alert
In this demonstration, you will see how to:
Create

Demonstration: Viewing Reports in Performance Monitor
In this demonstration, you will see
Demonstration: Viewing Reports in Performance Monitor
In this demonstration, you will see
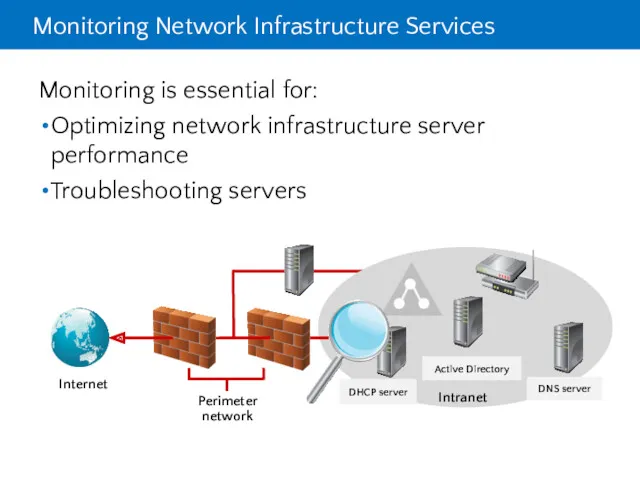
Monitoring Network Infrastructure Services
Monitoring is essential for:
Optimizing network infrastructure server performance
Troubleshooting
Monitoring Network Infrastructure Services
Monitoring is essential for:
Optimizing network infrastructure server performance
Troubleshooting
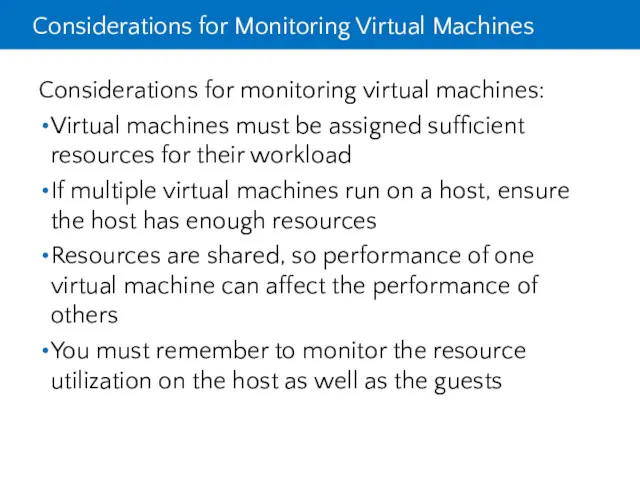
Considerations for Monitoring Virtual Machines
Considerations for monitoring virtual machines:
Virtual machines must
Considerations for Monitoring Virtual Machines
Considerations for monitoring virtual machines:
Virtual machines must
20.3. Мониторинг журналов событий
Using Server Manager to View Event Logs
What Is
20.3. Мониторинг журналов событий
Using Server Manager to View Event Logs What Is
Using Server Manager to View Event Logs
Server Manager provides a centralized
Using Server Manager to View Event Logs
Server Manager provides a centralized
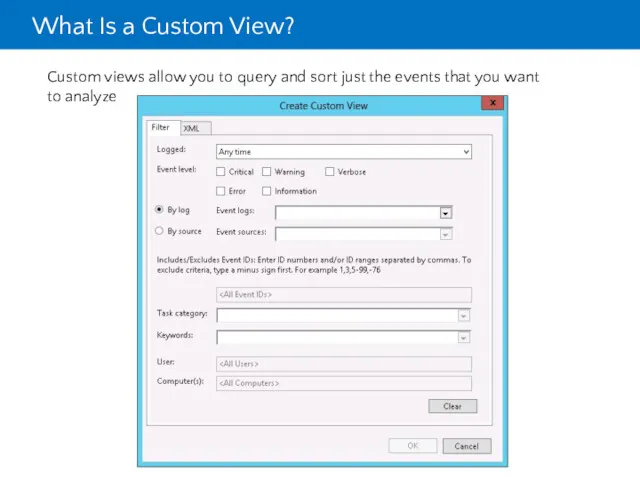
What Is a Custom View?
Custom views allow you to query and
What Is a Custom View?
Custom views allow you to query and
Demonstration: Creating a Custom View
In this demonstration, you will see how
Demonstration: Creating a Custom View
In this demonstration, you will see how
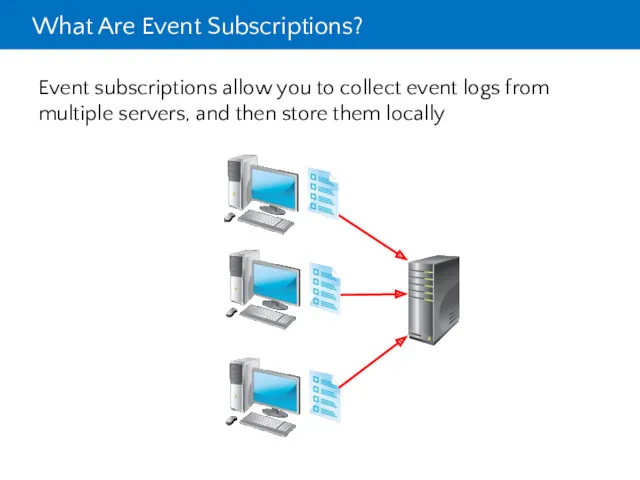
What Are Event Subscriptions?
Event subscriptions allow you to collect event logs
What Are Event Subscriptions?
Event subscriptions allow you to collect event logs
Demonstration: Configuring an Event Subscription
In this demonstration, you will see how
Demonstration: Configuring an Event Subscription
In this demonstration, you will see how

 Объектно-ориентированное программирование. Классы. Тема 04
 Администрирование информационных систем и веб-порталов
 Методы и технологии современных информационных войн
 Информационная культура
 Введение в информационную безопасность
 Бұлттық есептеулер және ұялы байланыс технологияларын интеграциялау
 Компьютерлік модель. Компьютерде модельдерді зерттеу
 Дистанционное электронное голосование на выборах в органы государственной власти в Единый день голосования
 Локальные и глобальные компьютерные сети. Коммуникационные технологии
 Табличные процессоры. MS Excel. (Лекция 5)
 Создание, развитие, обслуживание и эксплуатация информационных систем
 Welcome to CAD/CAM services
 Instructions for Using and Debugging TIGAR GUI Release 1P4
 Простейшие конструкции языка С
 Цифровой офис
 Тема 2.7 Принципы проектирования пользовательского интерфейса
 Курсовая работа. Разработка сетевого программного обеспечения
 Routing Introduction
 Текстовий документ та його об’єкти. Створення таблиці
 Технологии проектирования компьютерных систем. Алфавит языка VHDL. (Лекция 3)
 Безопасность детей в интернете
 Внедрение здоровьесберегающих технологий на уроках информатики
 Мобильный интернет
 Web Attacks: cross-site request forgery, SQL injection, cross-site scripting
 Об оказании АО Корпорация МСП услуг по регистрации на Портале Бизнес-навигатора МСП через МФЦ
 Беспроводной интернет, особенности и функционирования
 The term computer programmer
 Представление числовых данных в среде табличного процессора