- Quantitative research in management: methodology. Introduction to IBM SPSS

Содержание
- 2. SCHEDULE September, 6, 2019 (Friday) 18.30-21.40 class № 2024 September, 13, 2019 (Friday) 18.30-21.40 class №
- 3. ASSESSMENT REQUIREMENTS Class attendance/assignment Hometasks Final exam (written form) Test (multiple choice questions) Task (problem solution)
- 4. WE WILL LEARN HOW TO: Formulate research hypotheses Select and conduct suitable types of statistical analysis
- 5. AGENDA Quantitative research in Management: methodology. Introduction to IBM SPSS. Data visualization. Descriptive statistics. Cross-tabulating (Contingency
- 6. TOPIC 1. QUANTITATIVE RESEARCH IN MANAGEMENT: METHODOLOGY. INTRODUCTION TO IBM SPSS.
- 7. TYPES OF RESEARCH Desk-based (secondary) research (based on statistics, financial reports, …) Empirical (primary) research (based
- 8. ANALYZING QUANTITATIVE DATA Desk-based information: Statistics Financial statements CRM … Empirical information: Questionnaires …
- 9. HYPOTHESIS Hypothesis is the assumption of the connection of variables In any hypothesis, a dependent and
- 10. HYPOTHESIS: DEPENDENT AND INDEPENDENT VARIABLES
- 11. HYPOTHESIS: DEPENDENT AND INDEPENDENT VARIABLES
- 12. HOW TO MEASURE VARIABLES 3 main types of scales Nominal scale Ordinal scale Quantitative scale
- 13. NOMINAL SCALE Objects are classified by the presence and absence of a certain attribute Categories of
- 14. EXAMPLE OF NOMINAL / BINARY SCALE 1. What kind of soft drink do you prefer? Dr.Pepper
- 15. ORDINAL SCALE Categories have a logical order We can compare the intensity of studied feature in
- 16. EXAMPLE OF ORDINAL SCALE 1. Rank these beverages according to the degree of your preference Dr.Pepper
- 17. ORDINAL INTERVAL SCALE The categories in this type of scale are not only logically ordered, but
- 18. ORDINAL SCALE OF IMPORTANCE Intervals determine the degree of importance of a characteristic (-s) Example: 3.
- 19. ORDINAL LIKERT-TYPE SCALE Respondents are given some statements and they are asked to what extent they
- 20. QUANTITATIVE SCALE A measurement that uses absolute zero and, therefore, allows to make comparison of absolute
- 21. EXAMPLE OF QUANTITATIVE SCALE Indicate how many times a month you buy each of the drinks
- 22. HYPOTHESIS: MEASURING VARIABLES
- 23. HYPOTHESIS: MEASURING VARIABLES
- 24. WHY IS IT SO IMPORTANT (VARIABLES, SCALES, …)
- 25. HYPOTHESIS: MAIN AND ALTERNATIVE Main hypothesis (H0) states that there is no connection between variables Alternative
- 26. HYPOTHESIS: MAIN AND ALTERNATIVE
- 27. HYPOTHESIS: MAIN AND ALTERNATIVE
- 28. SPSS (Statistical Package for Social Sciences OR Superior Performing Software Systems) — a system (software package)
- 29. HOW TO CHANGE LANGUAGE IN IBM SPSS
- 30. HOW TO CHANGE LANGUAGE IN IBM SPSS
- 31. THE WAY OF DATA ORGANIZING Two main windows (views) – window with the data (“Data View”)
- 32. VARIABLES VIEW Name – the working title of the variable (e.g. child) - no spaces, maximum
- 33. SPSS STATISTICS MENU TOOLS File – import, export functions, to save, to open, to create a
- 34. BASIC COMMANDS: DATA SORTING Data – Sort Cases Example №1: sort respondents by age sort respondents
- 35. BASIC COMMANDS: DATA SELECTION Data – Select Cases Example №1: select only men for future analysis
- 36. BASIC COMMANDS: CREATING A NEW VARIABLE Transform – Compute variable Example №1: Create a new variable
- 37. BASIC COMMANDS: RECODING ONE VARIABLE INTO ANOTHER Transform – Recode into Different Variables Example №1: Divide
- 39. Скачать презентацию
 Математическое программное обеспечение
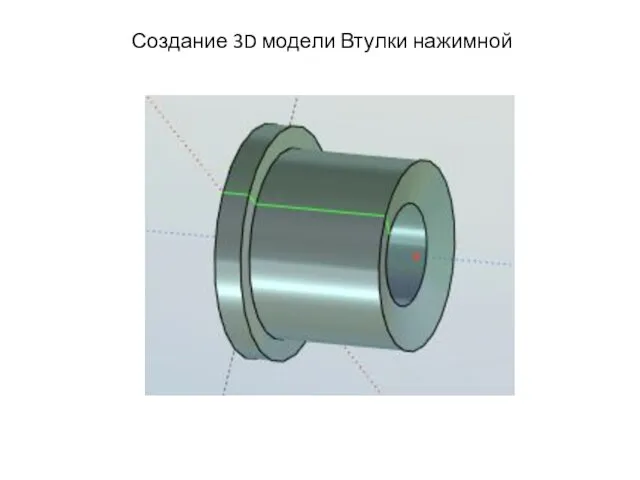 Создание 3D модели втулки нажимной
 Антивирусная программа Dr.Web
 Телеграмма. Услуга по приему и передаче телеграмм
 Портал Госуслуг gosuslugi.ru и услуга Электронный дневник
 Разновидности объектов и их классификация
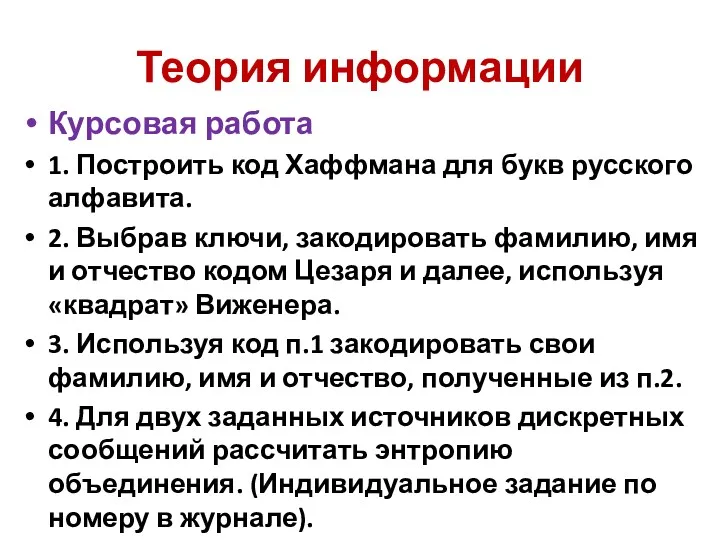 Теория информации. Построить код Хаффмана для букв русского алфавита
 Общение в Интернете
 Защита от компьютерных вирусов. Признаки заражения компьютера
 Розробка автоматизованої системи керування об’єктом Світлофор
 Infogr.am. Сервис для визуализации данных
 Абсолютная и относительная адресация ячеек MS Excel
 Чат-боты в социальных сетях
 Работа на портале электронного обучения в учебной среде ИнфоДа Moodle
 История развития интернета (8 класс)
 Композиция презентации
 Средства и способы форматирования символов в текстовом редакторе MS Word
 Презентация урока по теме Двоичное кодирование информации в компьютере
 Информационные системы в металлургии
 Кодирование графической информации
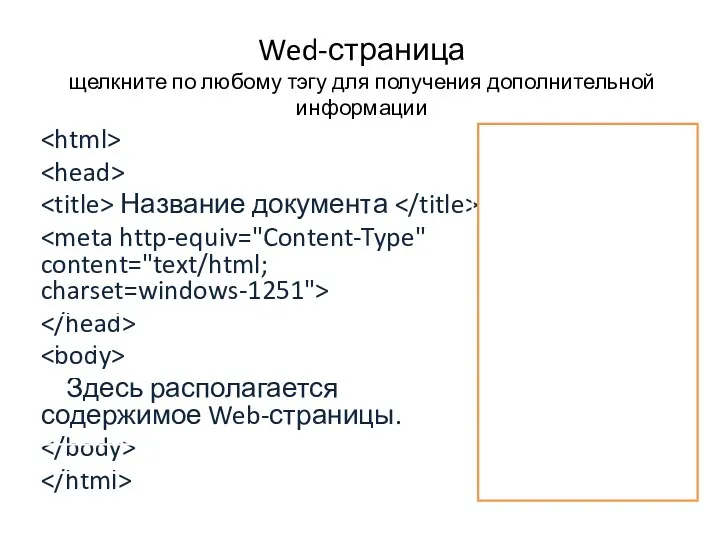 HTML язык презентация
 Обучение компьютерной грамотности граждан старшего возраста на базе программы Азбука Интернета
 Основные понятия надёжности информационных систем и пути её обеспечения
 Безопасность в информационном пространстве. Глава 5
 АИС-путевка в Артек. Работа с автоматизированной информационной системой на основе электронного портфолио
 WeOptimum Windows Customer Support Center
 Локальные сети: общая характеристика, принципы работы
 Що таке інтернет