- Шаблоны слайдов от McKinsey

Содержание
- 2. Video content analysis (VCA) technology and infrastructure is readily available Provider roadmaps indicate BI solutions for
- 3. Journey to today’s discussion Work over the past 5 months has drawn upon the best thinking
- 4. Schedule
- 5. Boat chart/timeline Initial Details 1 Details 2 X Y X Y X Y X Y X
- 6. Timeline X weeks X weeks X weeks … … … … …. ….
- 7. Timeline … … … … … … 1 4 7 … … … … … …
- 8. Stage gate timeline Timing Q4 2009 Q1 to Q4, FY10 FY11 to FY12/14 FY12/14 onwards Stage
- 9. Our work over the next 8 to 10 weeks will follow a structured process Timing 4-6
- 10. Schedule
- 11. Timeline 1 2 3 2-4 weeks 2-4 weeks 12-18 months … … … … … …
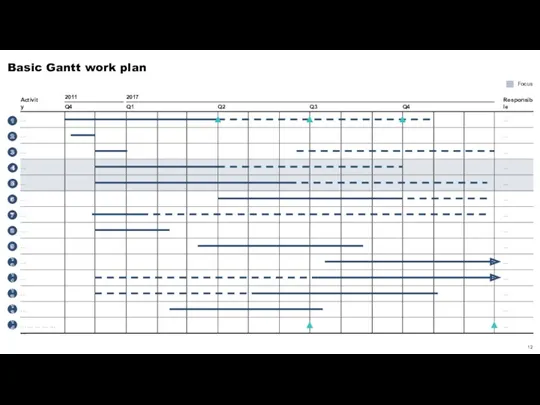
- 12. Basic Gantt work plan 4 5 2011 2017 Q4 Q1 Q2 Q3 Q4 … … …
- 13. Basic Gantt work plan 2013 2014 09 10 11 12 01 02 03 04 05 06
- 14. Приложение: шаблоны и примеры слайдов Шаблоны слайдов с планом работ Шаблоны слайдов с процессом Шаблоны слайдов
- 15. Process flow Text Text Text Text Text
- 16. Process Differentiate product offering Consolidate Move down value chain Expand into branded drugs Expand into fast
- 17. Circular process … … … … A. … B. … C. … D. … …
- 18. Circular process … … … … … … E. … F. … A. … B. …
- 19. Process A. … B. … C. … D. … E. … F. … … … …
- 20. We used a 3-step process to define the approach to Medicare Stars within Pharmacy Assess situation
- 21. Operations readiness assessment overview Working session Survey Interviews Workshop Timing Format Outcomes Readiness assessment January 2013
- 22. Приложение: шаблоны и примеры слайдов Шаблоны слайдов с планом работ Шаблоны слайдов с процессом Шаблоны слайдов
- 23. Issue tree Optimize growth and profitability of XX’s livestock feed business Customer/product research Lower internal costs
- 24. Structure/Solution tree How can we convince the IOC to choose our city for the 2024 Olympics?
- 25. Text Text Structure/Solution tree Text Text Text Text Text Text Text Heading Text Text Text Text
- 26. Structure/Solution tree Text Text Text Text Text Text Text Text Text Text
- 27. Structure/Solution tree Text Text Text Text Text Text Text Text Text Text Text Text Text Text
- 28. Pyramid structure Enhance sales force compensation programs Invest in software tools to help salespeople target high-value
- 29. Issue tree Non-labor cost / Patient day Supplies / Patient day Controllable exp / P. d.
- 30. Приложение: шаблоны и примеры слайдов Шаблоны слайдов с планом работ Шаблоны слайдов с процессом Шаблоны слайдов
- 31. Horizons (phases) Phase 1: Build the basics Duration: 1 month Phase 3: Refine and scale Duration:
- 32. Improving contract management systems would enable operational savings across the enterprise Purchase order based system for
- 33. Приложение: шаблоны и примеры слайдов Шаблоны слайдов с планом работ Шаблоны слайдов с процессом Шаблоны слайдов
- 34. From-to template Standalone, off the rack products One size fits all approach Narrow cost, opportunistic sales
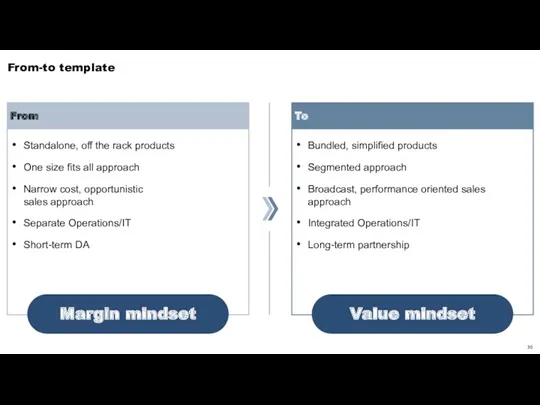
- 35. From-to template Standalone, off the rack products One size fits all approach Narrow cost, opportunistic sales
- 36. From-to template Title Title
- 37. From-to template … … … … … From … To … … … … … …
- 38. From-to template Title Current state Behavior changes Future state icon icon icon icon icon … …
- 39. Situation-Complication-resolution template Resolution Complication Situation Text Text Text
- 40. From-to template … … … … … … … …
- 41. Приложение: шаблоны и примеры слайдов Шаблоны слайдов с планом работ Шаблоны слайдов с процессом Шаблоны слайдов
- 42. Funnel template Screening criteria 2 1 600 Indian pharmaceutical players 93 players 130 players 3 tier
- 43. Funnel template 88 39 24 2nd qualification 3rd qualification 1st qualification 34.7% 12.9% 9.4% Final population
- 44. Funnel template ... … ... … ... … ... …
- 45. Funnel template – Stage Gate Proven technical capability Pre-qualified Have capabilities to execute in time Project
- 46. Funnel template Policies accepted Offers/week Customer visits/week Customer contacts/week Top 25% of all salesmen Ø all
- 47. Приложение: шаблоны и примеры слайдов Шаблоны слайдов с планом работ Шаблоны слайдов с процессом Шаблоны слайдов
- 48. Components Input costs are rising and becoming more volatile Demand is coming from more products and
- 49. Components "PSM alignment with business strategy and support of it" "The way PSM professionals think, feel,
- 50. Components … … … … … … … … … … … … …
- 51. Components … … … … … … …
- 52. Components … 2 Element 1 Element 5 Element 3 Element 4 Element Brand Promise 6 Element
- 53. Components Optimize branch micro-location Increase bank’s mobility Leverage self-service for maintained presence Make customers feel the
- 54. Components 1 Commercial excellence 2 Operations excellence 3 Sourcing excellence 4 Integration Customer knowledge Marketplace agility
- 55. System components What we are learning Linking talent strategy to business needs Changes in environment, budget
- 56. Components Element 1 Element 2 Element 3 … … … … … …
- 57. Incremental strategic benefits x Minimized execution risk x Revenue 2014 Steady state EBITDA margin1 Investment Payback
- 58. Elements Branded 1 Dedicated physicians sales force Conventional branded marketing including DTC 1-2 competitors per molecule
- 59. Приложение: шаблоны и примеры слайдов Шаблоны слайдов с планом работ Шаблоны слайдов с процессом Шаблоны слайдов
- 60. ME/CP++ opportunity : Tier 3 regional payor Time to market (Alabama) Long term Near term Sample
- 61. Four high priority initiatives have been selected for the pilot Bubble size = estimated impact HIGH
- 62. A responsibility assignment matrix will help to drive an aligned and efficient sourcing process Responsible Accountable
- 63. Приложение: шаблоны и примеры слайдов Шаблоны слайдов с планом работ Шаблоны слайдов с процессом Шаблоны слайдов
- 64. Available one-time market for Y offering corresponds to 472 hospitals and $3.5B 0-300 0-100 51.9 100-300
- 65. Spending on health care exceeded expected levels by $572 billion in 2009 – 23% of total
- 66. Realizing a lower acquisition price on computer hardware could realize $3Mn savings Example: Desktop computer purchases
- 67. Leadership team survey results reveal an increasing desire for emphasis on workforce planning and talent sourcing
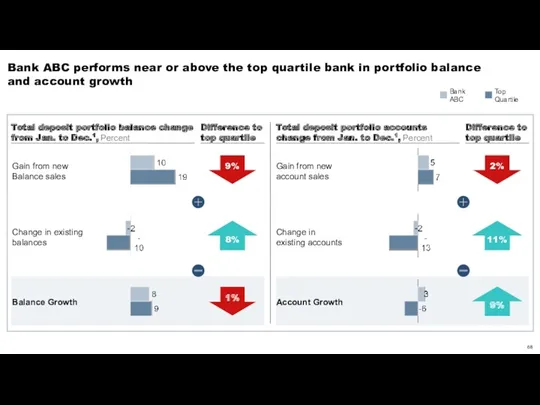
- 68. Bank ABC performs near or above the top quartile bank in portfolio balance and account growth
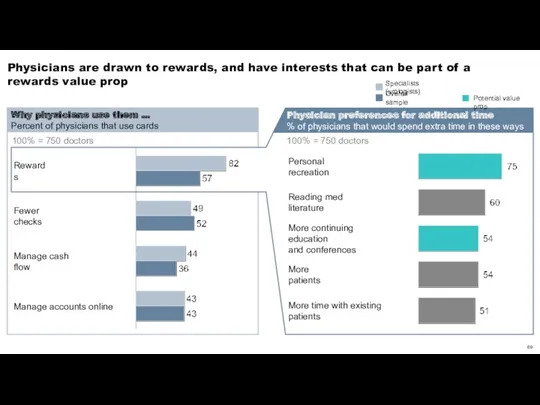
- 69. Physicians are drawn to rewards, and have interests that can be part of a rewards value
- 70. The top management team focuses on cross-selling Scorecard: 15 key measures tracked by top management Homeowner-customers
- 71. Pilot targets and KPIs … … 4 10.0 min 150% 3 200% 5 30 customers 40
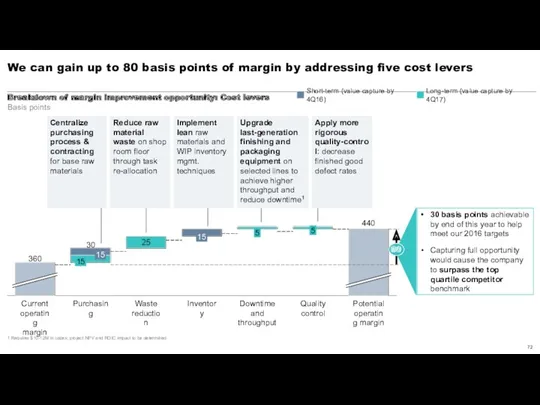
- 72. We can gain up to 80 basis points of margin by addressing five cost levers Reduce
- 73. Typical waterfall £M, %, 2002 Annual audio/video cost breakdown Capitaliz-ed M&E expense1 1.8 Content licensing Audio/video
- 74. Typical waterfall 4-7 … Segmentation, Sales productivity and delivery … 1-2 ~1 … … 1-4 2
- 75. Chart with implications 2011 12 12 15 2013 18 +22% p.a. Series 3 Series 1 Series
- 76. Company A has potential to improve purchasing health 25 35 0 5 10 20 30 15
- 78. Скачать презентацию
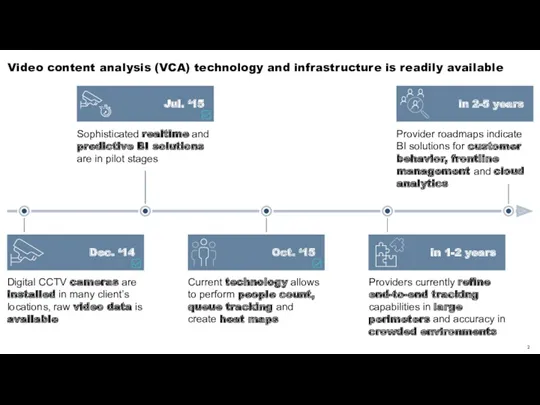
Video content analysis (VCA) technology and infrastructure is readily available
Provider roadmaps
Video content analysis (VCA) technology and infrastructure is readily available
Provider roadmaps
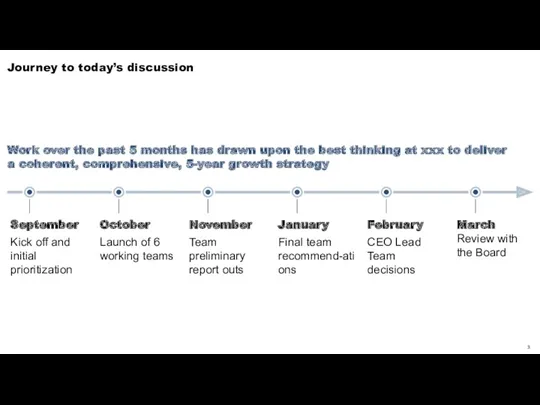
Journey to today’s discussion
Work over the past 5 months has drawn
Journey to today’s discussion
Work over the past 5 months has drawn

Schedule
Schedule
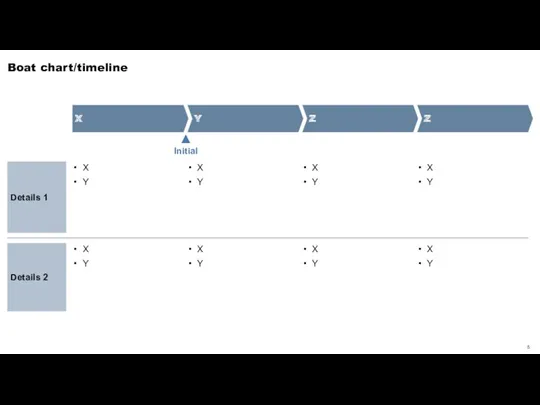
Boat chart/timeline
Initial
Details 1
Details 2
X
Y
X
Y
X
Y
X
Y
X
Y
X
Y
X
Y
X
Y
Boat chart/timeline
Initial
Details 1
Details 2
X
Y
X
Y
X
Y
X
Y
X
Y
X
Y
X
Y
X
Y
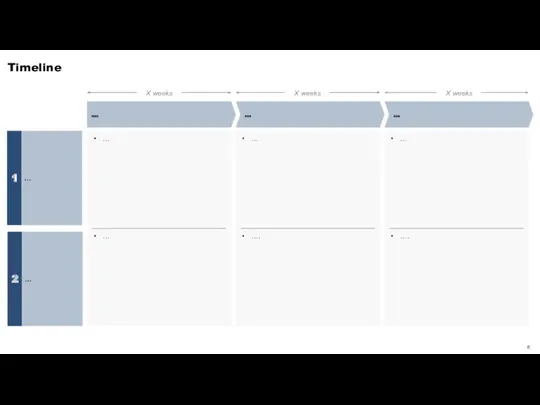
Timeline
X weeks
X weeks
X weeks
…
…
…
…
….
….
Timeline
X weeks
X weeks
X weeks
…
…
…
…
….
….
Timeline
…
…
…
…
…
…
1
4
7
…
…
…
…
…
…
2
5
8
…
…
…
…
…
…
3
6
9
Timeline
…
…
…
…
…
…
1
4
7
…
…
…
…
…
…
2
5
8
…
…
…
…
…
…
3
6
9

Stage gate timeline
Timing
Q4 2009
Q1 to Q4, FY10
FY11 to FY12/14
FY12/14 onwards
Stage gates
Initial
Gate
Stage gate timeline
Timing
Q4 2009
Q1 to Q4, FY10
FY11 to FY12/14
FY12/14 onwards
Stage gates
Initial
Gate
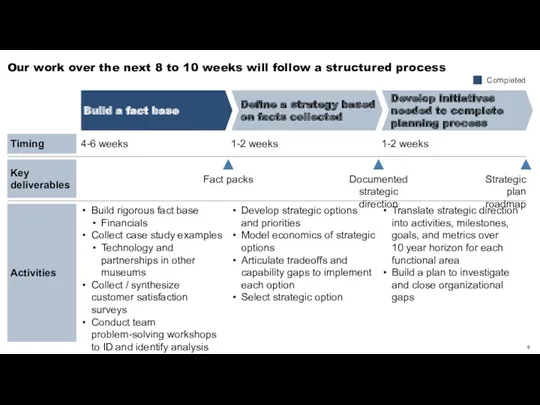
Our work over the next 8 to 10 weeks will follow
Our work over the next 8 to 10 weeks will follow

Schedule
Schedule
Timeline
1
2
3
2-4 weeks
2-4 weeks
12-18 months
…
…
…
…
…
…
Timeline
1
2
3
2-4 weeks
2-4 weeks
12-18 months
…
…
…
…
…
…
Basic Gantt work plan
4
5
2011
2017
Q4
Q1
Q2
Q3
Q4
…
…
…
…
…
…
… … … … … …
…
…
Activity
Responsible
…
…
…
…
…
…
…
…
…
…
…
…
…
…
…
…
…
…
…
1
3
6
7
8
11
10
2
12
9
13
14
Basic Gantt work plan
4
5
2011
2017
Q4
Q1
Q2
Q3
Q4
…
…
…
…
…
…
… … … … … …
…
…
Activity
Responsible
…
…
…
…
…
…
…
…
…
…
…
…
…
…
…
…
…
…
…
1
3
6
7
8
11
10
2
12
9
13
14
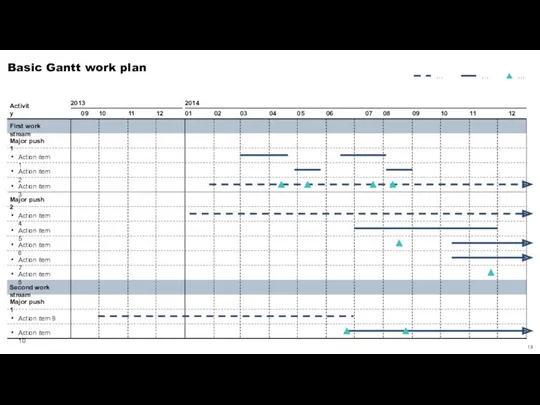
Basic Gantt work plan
2013
2014
09
10
11
12
01
02
03
04
05
06
07
08
09
10
11
12
Action item 3
Major push 1
Action item 10
Action
Basic Gantt work plan
2013
2014
09
10
11
12
01
02
03
04
05
06
07
08
09
10
11
12
Action item 3
Major push 1
Action item 10
Action
Приложение: шаблоны и примеры слайдов
Шаблоны слайдов с планом работ
Шаблоны слайдов с
Приложение: шаблоны и примеры слайдов
Шаблоны слайдов с планом работ
Шаблоны слайдов с
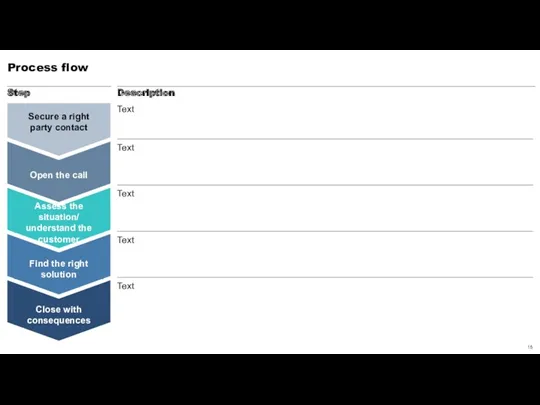
Process flow
Text
Text
Text
Text
Text
Process flow
Text
Text
Text
Text
Text
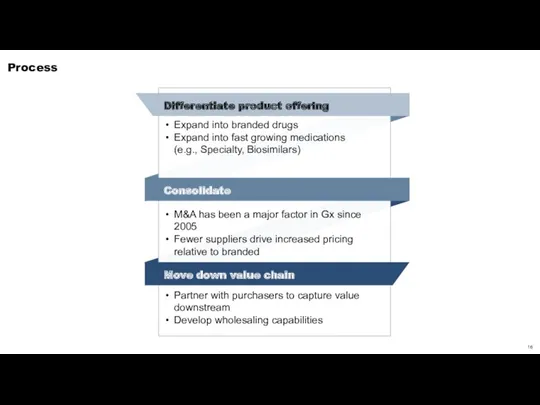
Process
Differentiate product offering
Consolidate
Move down value chain
Expand into branded drugs
Expand into fast
Process
Differentiate product offering
Consolidate
Move down value chain
Expand into branded drugs
Expand into fast
Circular process
…
…
…
…
A. …
B. …
C. …
D. …
…
Circular process
…
…
…
…
A. …
B. …
C. …
D. …
…
Circular process
…
…
…
…
…
…
E. …
F. …
A. …
B. …
C. …
D. …
Key enablers
Organization
Talent
MIS
Circular process
…
…
…
…
…
…
E. …
F. …
A. …
B. …
C. …
D. …
Key enablers
Organization
Talent
MIS
Process
A. …
B. …
C. …
D. …
E. …
F. …
…
…
…
…
…
…
…
…
…
Process
A. …
B. …
C. …
D. …
E. …
F. …
…
…
…
…
…
…
…
…
…
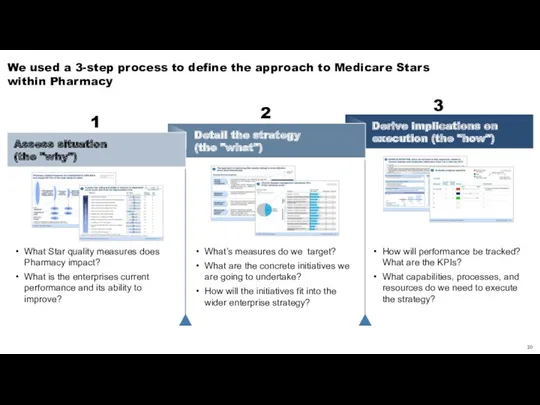
We used a 3-step process to define the approach to Medicare
We used a 3-step process to define the approach to Medicare
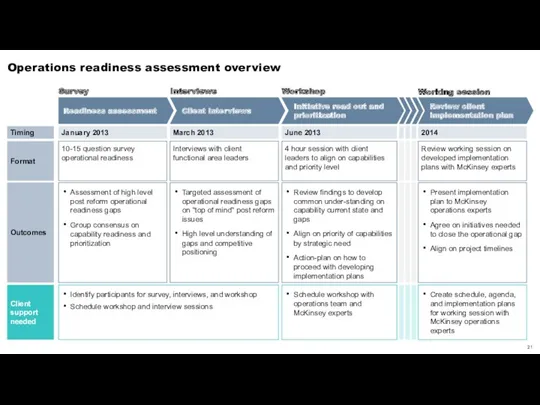
Operations readiness assessment overview
Working session
Survey
Interviews
Workshop
Timing
Format
Outcomes
Readiness assessment
January 2013
Client interviews
March 2013
Identify participants for
Operations readiness assessment overview
Working session
Survey
Interviews
Workshop
Timing
Format
Outcomes
Readiness assessment
January 2013
Client interviews
March 2013
Identify participants for
Приложение: шаблоны и примеры слайдов
Шаблоны слайдов с планом работ
Шаблоны слайдов с
Приложение: шаблоны и примеры слайдов
Шаблоны слайдов с планом работ
Шаблоны слайдов с
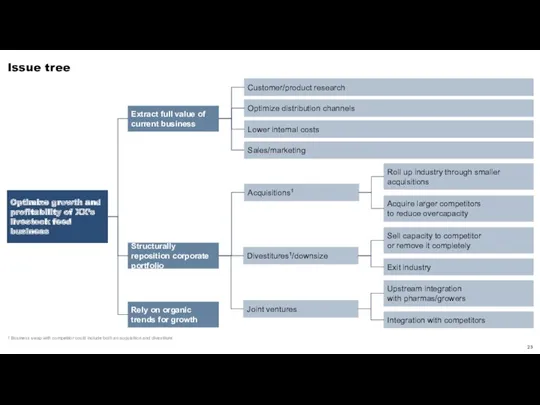
Issue tree
Optimize growth and profitability of XX’s livestock feed business
Customer/product research
Lower
Issue tree
Optimize growth and profitability of XX’s livestock feed business
Customer/product research
Lower
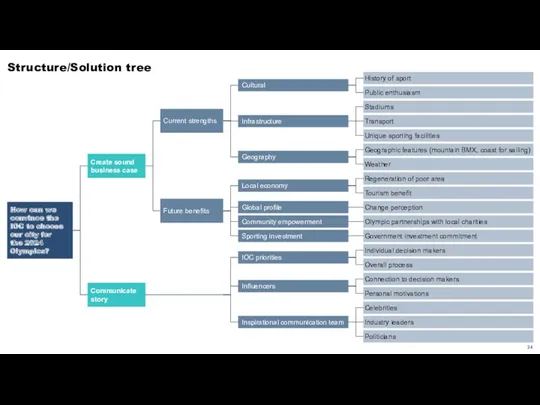
Structure/Solution tree
How can we convince the IOC to choose our city
Structure/Solution tree
How can we convince the IOC to choose our city
Text
Text
Structure/Solution tree
Text
Text
Text
Text
Text
Text
Text
Heading
Text
Text
Text
Text
Text
Text
Text
Text
Structure/Solution tree
Text
Text
Text
Text
Text
Text
Text
Heading
Text
Text
Text
Text
Text
Text
Structure/Solution tree
Text
Text
Text
Text
Text
Text
Text
Text
Text
Text
Structure/Solution tree
Text
Text
Text
Text
Text
Text
Text
Text
Text
Text
Structure/Solution tree
Text
Text
Text
Text
Text
Text
Text
Text
Text
Text
Text
Text
Text
Text
Text
Structure/Solution tree
Text
Text
Text
Text
Text
Text
Text
Text
Text
Text
Text
Text
Text
Text
Text
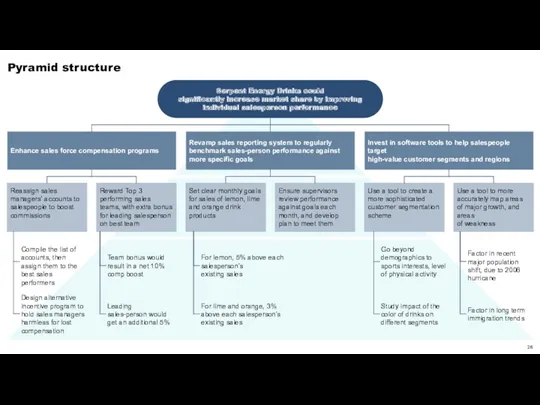
Pyramid structure
Enhance sales force compensation programs
Invest in software tools to help
Pyramid structure
Enhance sales force compensation programs
Invest in software tools to help
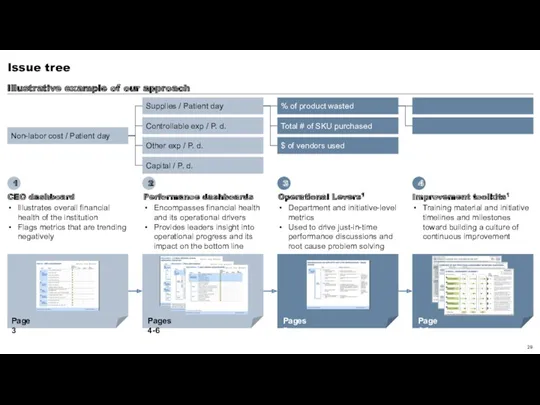
Issue tree
Non-labor cost / Patient day
Supplies / Patient day
Controllable exp /
Issue tree
Non-labor cost / Patient day
Supplies / Patient day
Controllable exp /
Приложение: шаблоны и примеры слайдов
Шаблоны слайдов с планом работ
Шаблоны слайдов с
Приложение: шаблоны и примеры слайдов
Шаблоны слайдов с планом работ
Шаблоны слайдов с
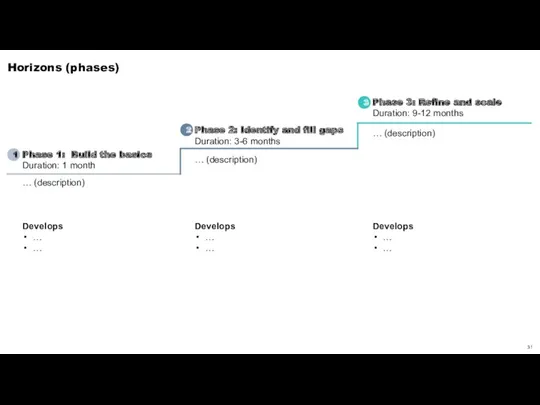
Horizons (phases)
Phase 1: Build the basics
Duration: 1 month
Phase 3: Refine
Horizons (phases)
Phase 1: Build the basics
Duration: 1 month
Phase 3: Refine
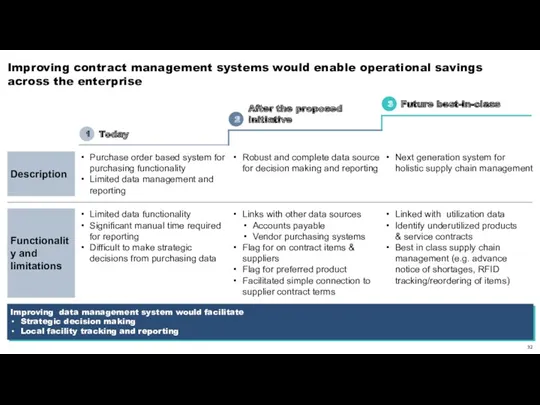
Improving contract management systems would enable operational savings
across the enterprise
Purchase
Improving contract management systems would enable operational savings
across the enterprise
Purchase
Приложение: шаблоны и примеры слайдов
Шаблоны слайдов с планом работ
Шаблоны слайдов с
Приложение: шаблоны и примеры слайдов
Шаблоны слайдов с планом работ
Шаблоны слайдов с
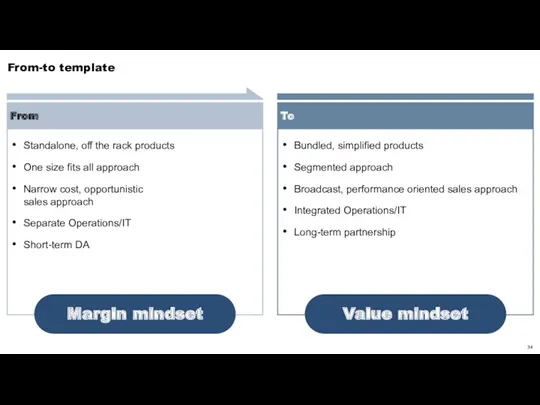
From-to template
Standalone, off the rack products
One size fits all approach
Narrow cost,
From-to template
Standalone, off the rack products
One size fits all approach
Narrow cost,
From-to template
Standalone, off the rack products
One size fits all approach
Narrow cost,
From-to template
Standalone, off the rack products
One size fits all approach
Narrow cost,
From-to template
Title
Title
From-to template
Title
Title

From-to template
…
…
…
…
…
From …
To …
…
…
…
…
…
…
…
…
…
…
From-to template
…
…
…
…
…
From …
To …
…
…
…
…
…
…
…
…
…
…
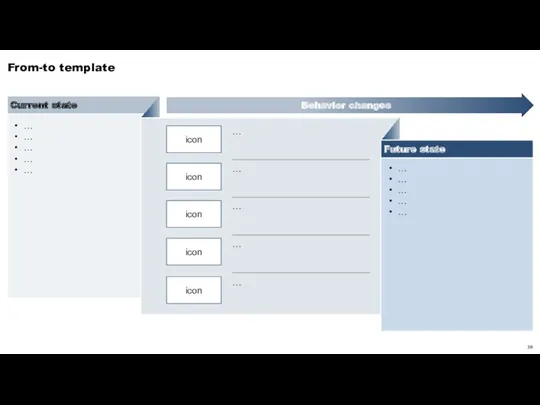
From-to template
Title
Current state
Behavior changes
Future state
icon
icon
icon
icon
icon
…
…
…
…
…
…
…
…
…
…
…
…
…
…
…
From-to template
Title
Current state
Behavior changes
Future state
icon
icon
icon
icon
icon
…
…
…
…
…
…
…
…
…
…
…
…
…
…
…
Situation-Complication-resolution template
Resolution
Complication
Situation
Text
Text
Text
Situation-Complication-resolution template
Resolution
Complication
Situation
Text
Text
Text
From-to template
…
…
…
…
…
…
…
…
From-to template
…
…
…
…
…
…
…
…
Приложение: шаблоны и примеры слайдов
Шаблоны слайдов с планом работ
Шаблоны слайдов с
Приложение: шаблоны и примеры слайдов
Шаблоны слайдов с планом работ
Шаблоны слайдов с
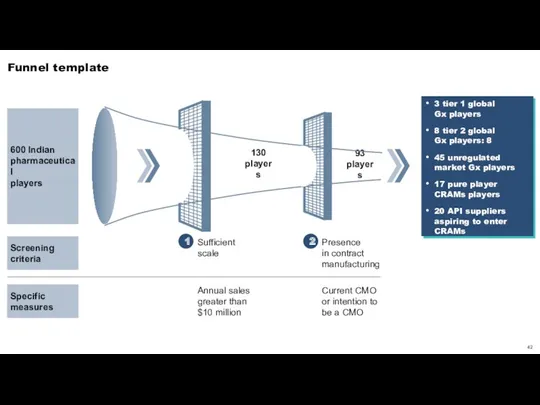
Funnel template
Screening
criteria
2
1
600 Indian
pharmaceutical
players
93 players
130
players
3 tier 1 global
Funnel template
Screening
criteria
2
1
600 Indian
pharmaceutical
players
93 players
130
players
3 tier 1 global
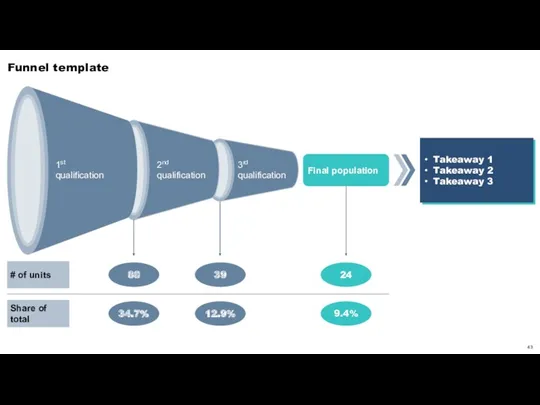
Funnel template
88
39
24
2nd qualification
3rd qualification
1st
qualification
34.7%
12.9%
9.4%
Final population
Takeaway 1
Takeaway 2
Takeaway 3
# of units
Share
Funnel template
88
39
24
2nd qualification
3rd qualification
1st
qualification
34.7%
12.9%
9.4%
Final population
Takeaway 1
Takeaway 2
Takeaway 3
# of units
Share
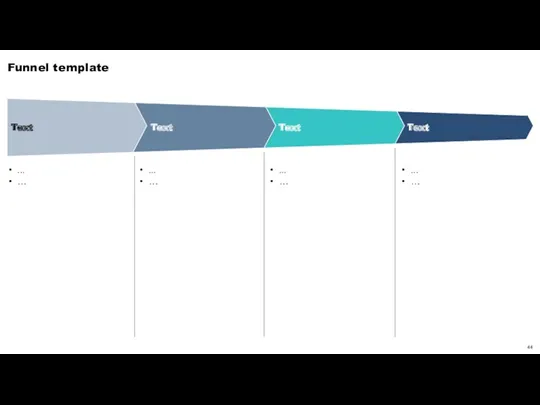
Funnel template
...
…
...
…
...
…
...
…
Funnel template
...
…
...
…
...
…
...
…
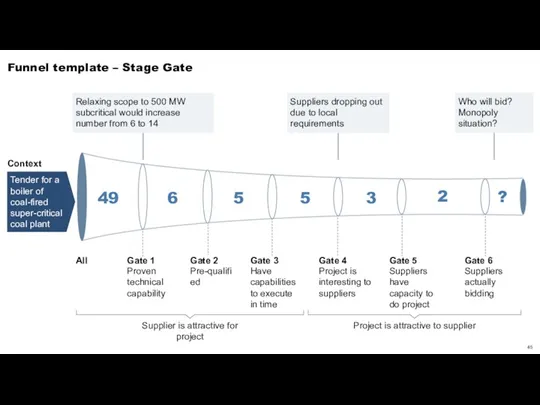
Funnel template – Stage Gate
Proven technical capability
Pre-qualified
Have capabilities to execute
in
Funnel template – Stage Gate
Proven technical capability
Pre-qualified
Have capabilities to execute in
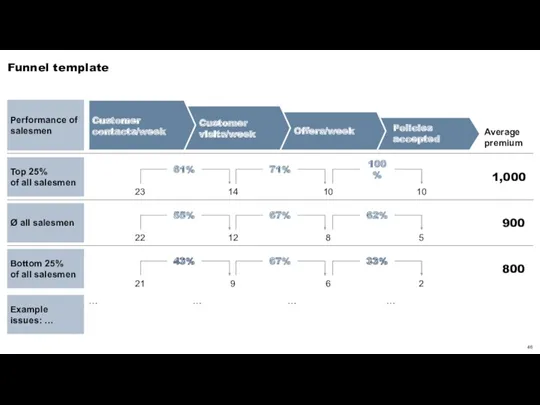
Funnel template
Policies accepted
Offers/week
Customer
visits/week
Customer contacts/week
Top 25%
of all
Funnel template
Policies accepted
Offers/week
Customer
visits/week
Customer contacts/week
Top 25% of all
Приложение: шаблоны и примеры слайдов
Шаблоны слайдов с планом работ
Шаблоны слайдов с
Приложение: шаблоны и примеры слайдов
Шаблоны слайдов с планом работ
Шаблоны слайдов с
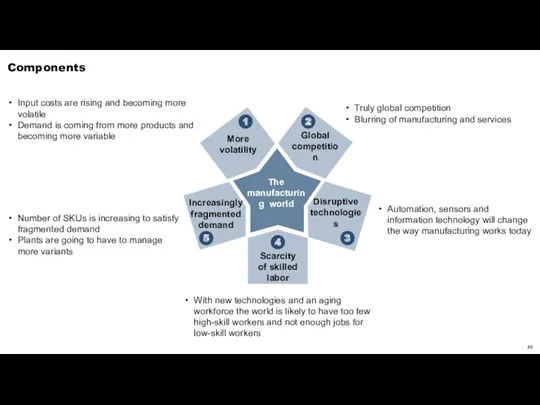
Components
Input costs are rising and becoming more volatile
Demand is coming from
Components
Input costs are rising and becoming more volatile
Demand is coming from
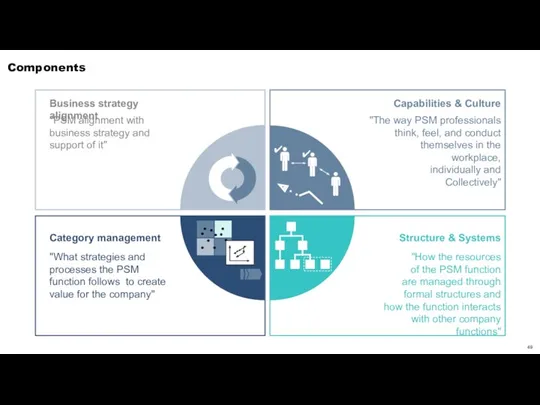
Components
"PSM alignment with business strategy and support of it"
"The way PSM
Components
"PSM alignment with business strategy and support of it"
"The way PSM
Components
…
…
…
…
…
…
…
…
…
…
…
…
…
Components
…
…
…
…
…
…
…
…
…
…
…
…
…

Components
…
…
…
…
…
…
…
Components
…
…
…
…
…
…
…
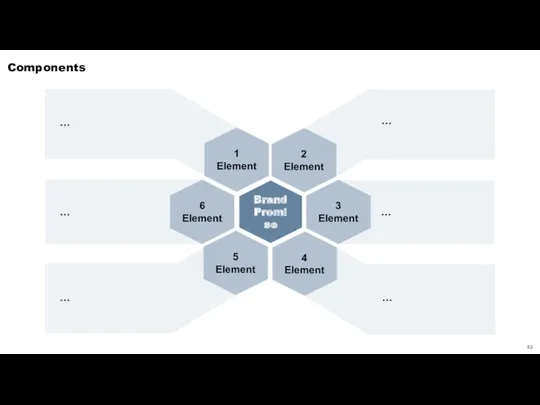
Components
…
2
Element
1
Element
5
Element
3
Element
4
Element
Brand
Promise
6
Element
…
…
…
…
…
Components
…
2
Element
1
Element
5
Element
3
Element
4
Element
Brand
Promise
6
Element
…
…
…
…
…
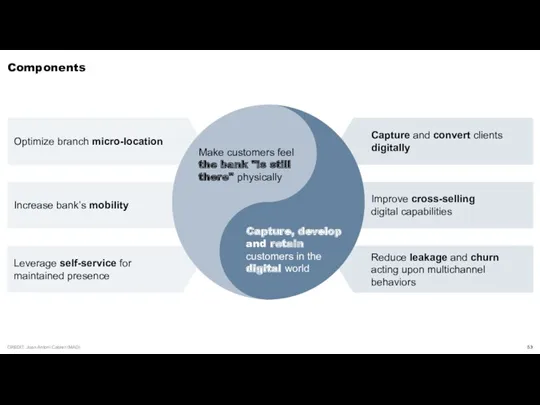
Components
Optimize branch micro-location
Increase bank’s mobility
Leverage self-service for maintained presence
Make customers feel
Components
Optimize branch micro-location
Increase bank’s mobility
Leverage self-service for maintained presence
Make customers feel
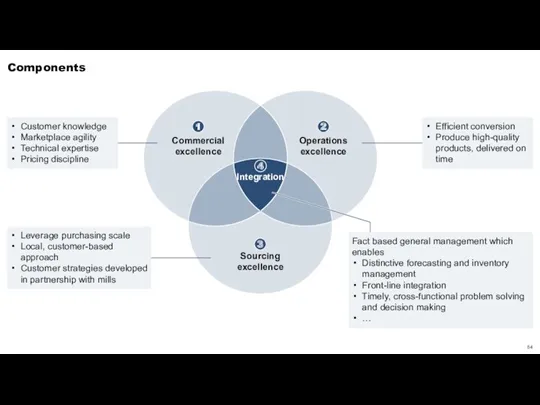
Components
1
Commercial excellence
2
Operations excellence
3
Sourcing excellence
4
Integration
Customer knowledge
Marketplace agility
Technical expertise
Pricing discipline
Leverage purchasing scale
Local, customer-based approach
Customer
Components
1
Commercial excellence
2
Operations excellence
3
Sourcing excellence
4
Integration
Customer knowledge
Marketplace agility
Technical expertise
Pricing discipline
Leverage purchasing scale
Local, customer-based approach
Customer
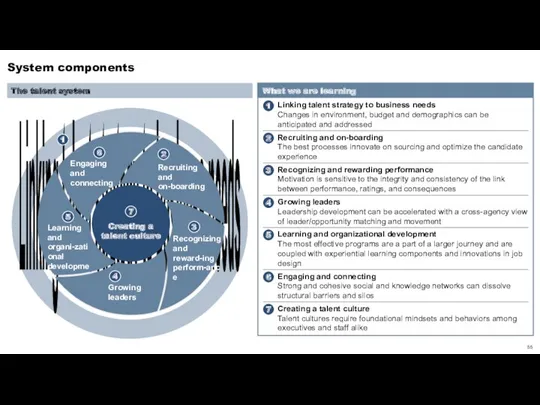
System components
What we are learning
Linking talent strategy to business needs
Changes in
System components
What we are learning
Linking talent strategy to business needs
Changes in
Components
Element 1
Element 2
Element 3
…
…
…
…
…
…
Components
Element 1
Element 2
Element 3
…
…
…
…
…
…
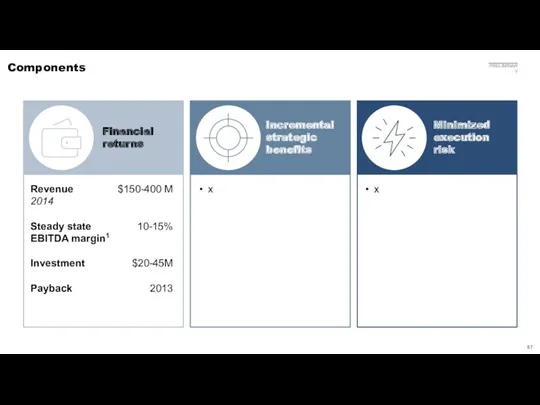
Incremental
strategic benefits
x
Minimized execution risk
x
Revenue
2014
Steady state EBITDA margin1
Investment
Payback
$150-400 M
10-15%
$20-45M
2013
Financial returns
Components
Incremental
strategic benefits
x
Minimized execution risk
x
Revenue
2014
Steady state EBITDA margin1
Investment
Payback
$150-400 M
10-15%
$20-45M
2013
Financial returns
Components
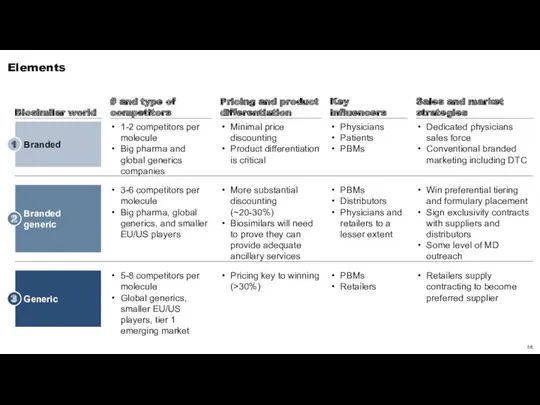
Elements
Branded
1
Dedicated physicians sales force
Conventional branded marketing including DTC
1-2 competitors per molecule
Big
Elements
Branded
1
Dedicated physicians sales force
Conventional branded marketing including DTC
1-2 competitors per molecule
Big
Приложение: шаблоны и примеры слайдов
Шаблоны слайдов с планом работ
Шаблоны слайдов с
Приложение: шаблоны и примеры слайдов
Шаблоны слайдов с планом работ
Шаблоны слайдов с
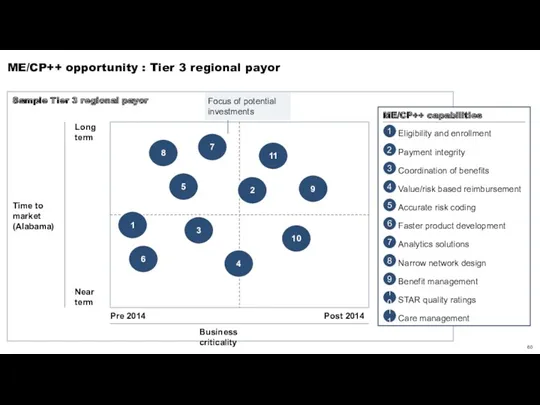
ME/CP++ opportunity : Tier 3 regional payor
Time to
market
(Alabama)
Long term
Near
ME/CP++ opportunity : Tier 3 regional payor
Time to
market
(Alabama)
Long term
Near
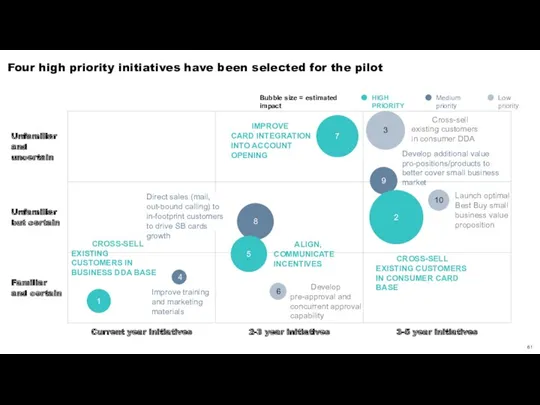
Four high priority initiatives have been selected for the pilot
Bubble size
Four high priority initiatives have been selected for the pilot
Bubble size
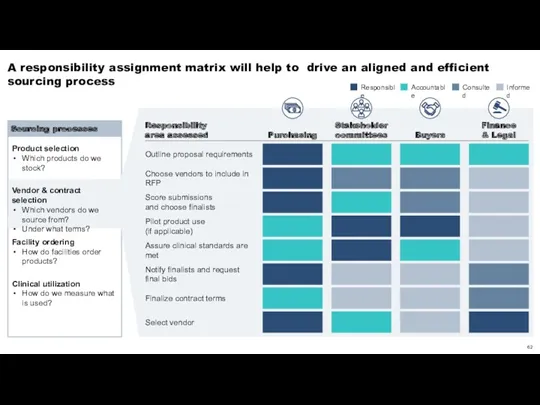
A responsibility assignment matrix will help to drive an aligned and
A responsibility assignment matrix will help to drive an aligned and
Приложение: шаблоны и примеры слайдов
Шаблоны слайдов с планом работ
Шаблоны слайдов с
Приложение: шаблоны и примеры слайдов
Шаблоны слайдов с планом работ
Шаблоны слайдов с
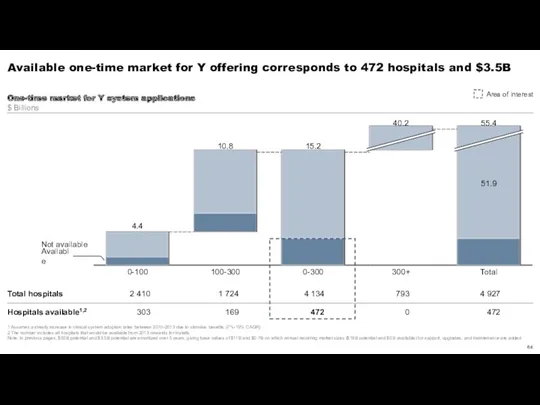
Available one-time market for Y offering corresponds to 472 hospitals and
Available one-time market for Y offering corresponds to 472 hospitals and

Spending on health care exceeded expected levels by $572 billion in
Spending on health care exceeded expected levels by $572 billion in
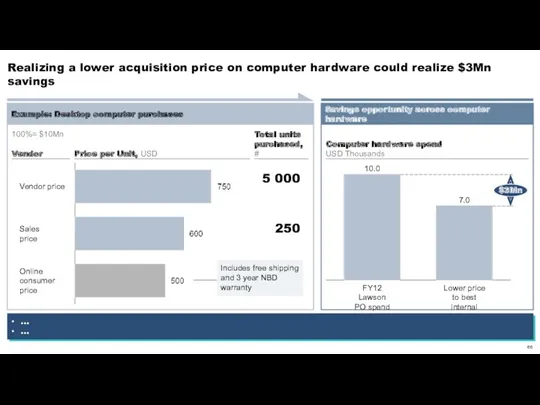
Realizing a lower acquisition price on computer hardware could realize $3Mn
Realizing a lower acquisition price on computer hardware could realize $3Mn
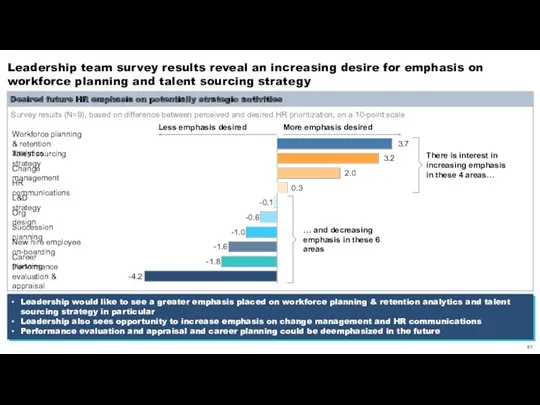
Leadership team survey results reveal an increasing desire for emphasis on
Leadership team survey results reveal an increasing desire for emphasis on
Bank ABC performs near or above the top quartile bank in
Bank ABC performs near or above the top quartile bank in
Physicians are drawn to rewards, and have interests that can be
Physicians are drawn to rewards, and have interests that can be
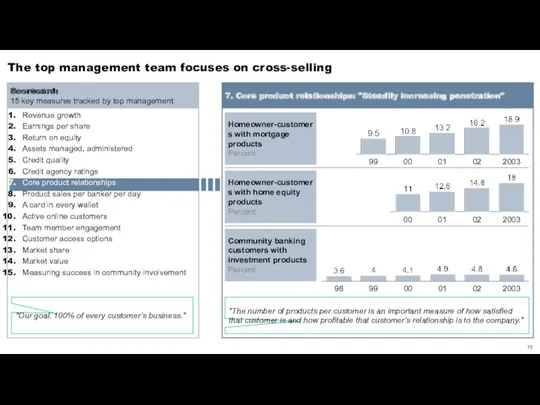
The top management team focuses on cross-selling
Scorecard:
15 key measures tracked by
The top management team focuses on cross-selling
Scorecard:
15 key measures tracked by

Pilot targets and KPIs
…
…
4
10.0 min
150%
3
<5 min
200%
5
<5 min
30 customers
40 customers
20 customers
Image
Pilot targets and KPIs
…
…
4
10.0 min
150%
3
<5 min
200%
5
<5 min
30 customers
40 customers
20 customers
Image
We can gain up to 80 basis points of margin by
We can gain up to 80 basis points of margin by
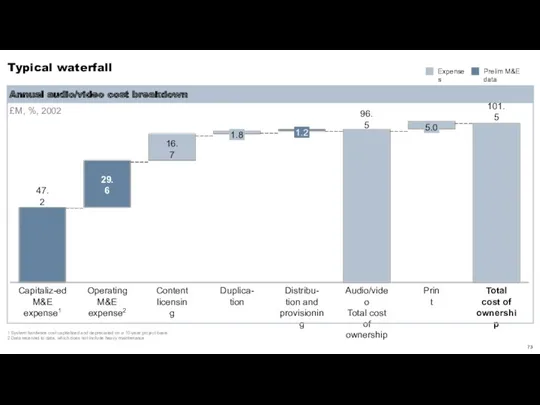
Typical waterfall
£M, %, 2002
Annual audio/video cost breakdown
Capitaliz-ed M&E expense1
1.8
Content licensing
Audio/video
Typical waterfall
£M, %, 2002
Annual audio/video cost breakdown
Capitaliz-ed M&E expense1
1.8
Content licensing
Audio/video
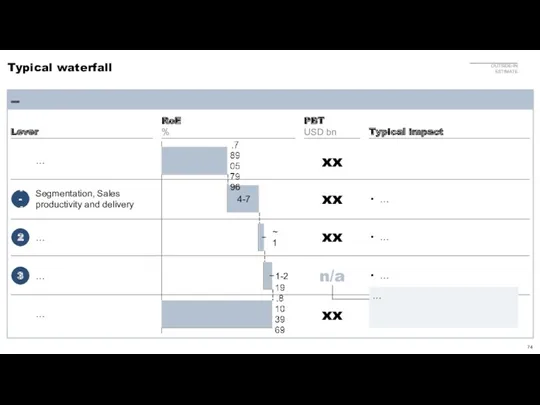
Typical waterfall
4-7
…
Segmentation, Sales
productivity and delivery
…
1-2
~1
…
…
1-4
2
3
…
…
…
…
xx
xx
xx
n/a
xx
…
Typical waterfall
4-7
…
Segmentation, Sales
productivity and delivery
…
1-2
~1
…
…
1-4
2
3
…
…
…
…
xx
xx
xx
n/a
xx
…

Chart with implications
2011
12
12
15
2013
18
+22% p.a.
Series 3
Series 1
Series 2
Annual EBIT
USD Millions
Implication 1
Implication 2
Implication
Chart with implications
2011
12
12
15
2013
18
+22% p.a.
Series 3
Series 1
Series 2
Annual EBIT
USD Millions
Implication 1
Implication 2
Implication
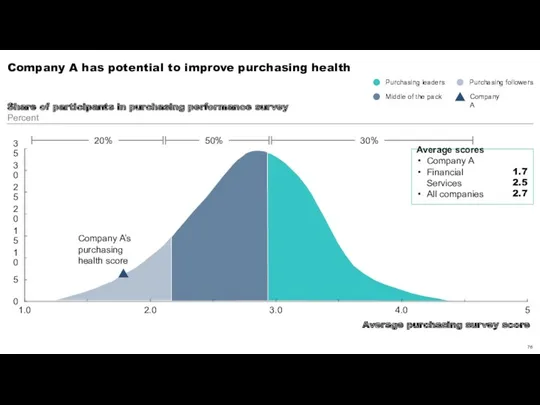
Company A has potential to improve purchasing health
25
35
0
5
10
20
30
15
1.0
2.0
3.0
4.0
5
Average purchasing survey score
Share
Company A has potential to improve purchasing health
25
35
0
5
10
20
30
15
1.0
2.0
3.0
4.0
5
Average purchasing survey score
Share
 Компьютер и его части
 HTTP протокол передачи гипертекста
 Правила по обеспечению информационной безопасности на рабочем месте
 ABC-Pascal. Структура программы. Переменные и присваивание. Ввод-вывод
 Электронная подпись: теория и практика использования. Тема 1.3.2
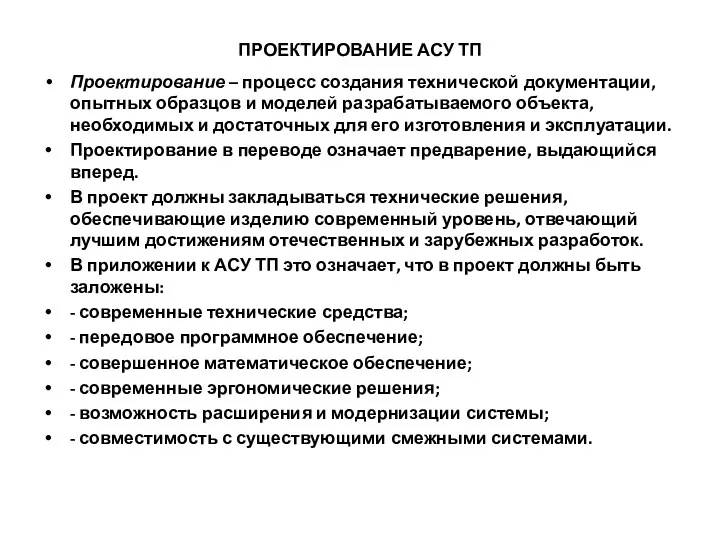 Проектирование АСУ ТП . Принципы проектирования
 Методическая разработка урока по теме Компьютерные вирусы. Антивирусные программы
 Методы научного моделирования
 Оборудование для наших клиентов
 Урок по информатике в 5 классе по теме Кодирование информации
 Электронная тетрадь по информатике
 Текстові і графічні обʼєкти на слайдах. Урок 30
 Модели данных. Примеры МИС. Стандарты. Шкалы измерения параметров. Этапы проектирования БД
 Особенности объектной модели Java. (Лекция 5)
 Training Module Overview
 ЗАДАНИЯ для интер доски к уроку ОБЪЕКТ
 Системи програмного та слідкуючого керування рухом
 Основы Java. Язык и платформа
 Машнное обучение. Практический пример. Подготовка данных. Применение алгоритмов ML
 Презентация из опыта работы Компьютерные игры для детей дошкольного возраста
 Устройства ввода и вывода информации
 Контент. Контент-план
 Моделирование сетей в ГИС. Примеры поиска оптимальных маршрутов
 Интернет желілері
 Основы поисковой оптимизации (теория и практика)
 История журналистики
 Introduction to database management systems
 Pascal.Тип данных - записи.