- Spatial thinking and learnings using AIS data

Содержание
- 2. Work in progress, phase 2/3 : developing the tools and methods A pilot study has been
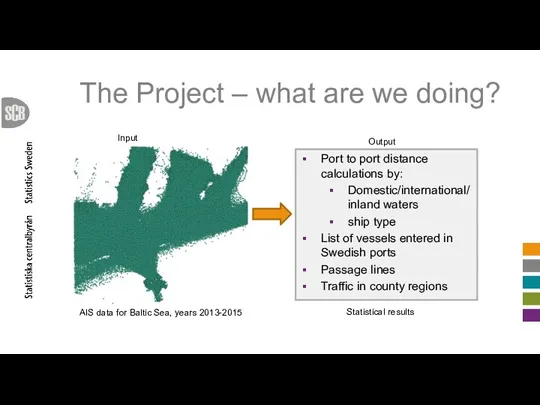
- 3. The Project – what are we doing? Port to port distance calculations by: Domestic/international/inland waters ship
- 4. Challenges Data must be restructured to better suit our purposes Data should be reduced We will
- 5. Restructuring data: creating lines Four attributes are needed to create transport lines between ports: Ship id
- 6. Using AIS data to create ports
- 7. High data resolution can be useful when creating ports Approx. 10 m
- 8. High data resolution can be useful when creating ports Original data Aggregated data (10m resolution) Low
- 9. Ports, status and results Work still in progress, but: Rough port areas created for all countries
- 10. Historical AIS data
- 11. Index of breakpoints Leaving port area Entering port area
- 12. Index of breakpoints From each exit to next enter in the index a line can be
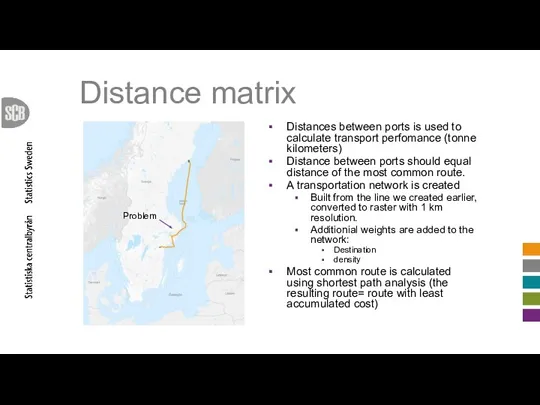
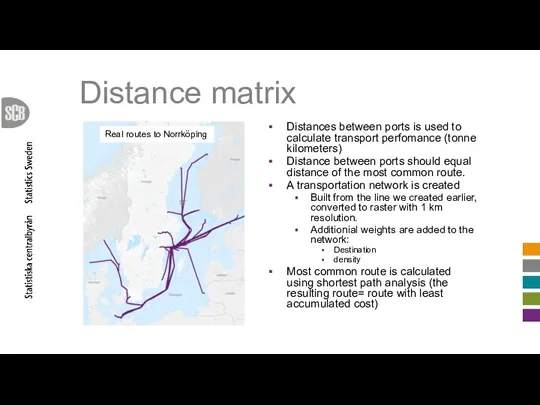
- 13. Distance matrix Distances between ports is used to calculate transport perfomance (tonne kilometers) Distance between ports
- 14. Distance matrix Distances between ports is used to calculate transport perfomance (tonne kilometers) Distance between ports
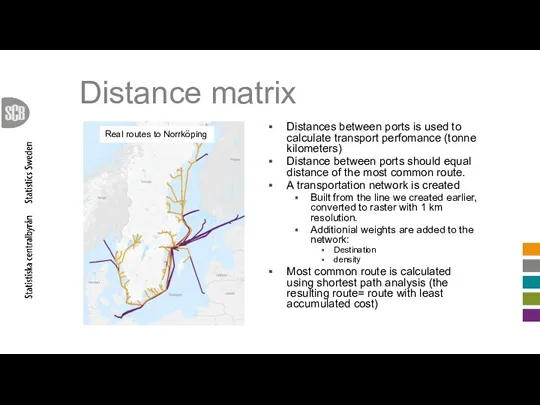
- 15. Distance matrix Distances between ports is used to calculate transport perfomance (tonne kilometers) Distance between ports
- 16. Distance matrix Distances between ports is used to calculate transport perfomance (tonne kilometers) Distance between ports
- 18. Скачать презентацию
Work in progress, phase 2/3 : developing the tools and methods
Work in progress, phase 2/3 : developing the tools and methods
The Project – what are we doing?
Port to port distance calculations
The Project – what are we doing?
Port to port distance calculations
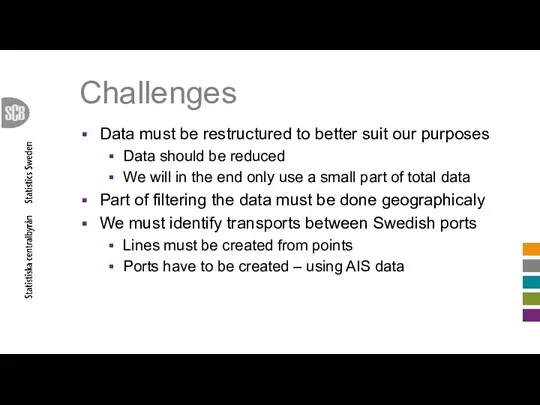
Challenges
Data must be restructured to better suit our purposes
Data should be
Challenges
Data must be restructured to better suit our purposes
Data should be
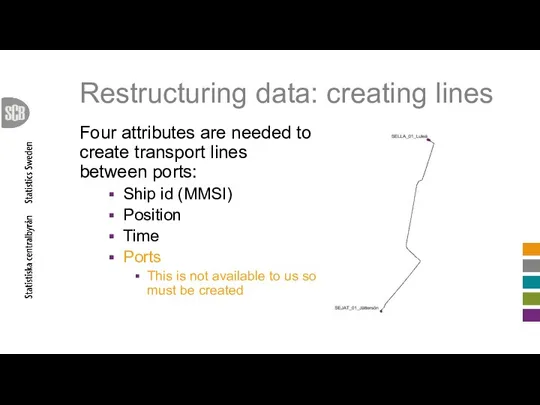
Restructuring data: creating lines
Four attributes are needed to create transport lines
Restructuring data: creating lines
Four attributes are needed to create transport lines
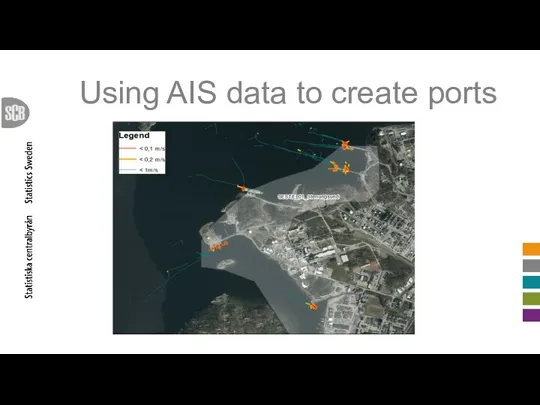
Using AIS data to create ports
Using AIS data to create ports
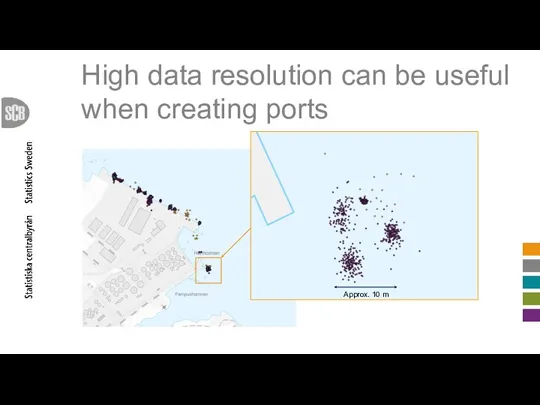
High data resolution can be useful when creating ports
Approx. 10 m
High data resolution can be useful when creating ports
Approx. 10 m
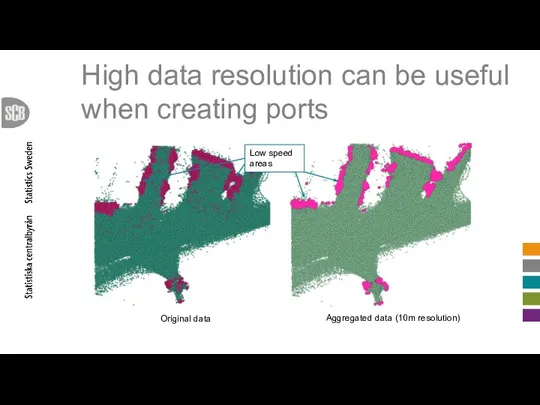
High data resolution can be useful when creating ports
Original data
Aggregated data
High data resolution can be useful when creating ports
Original data
Aggregated data
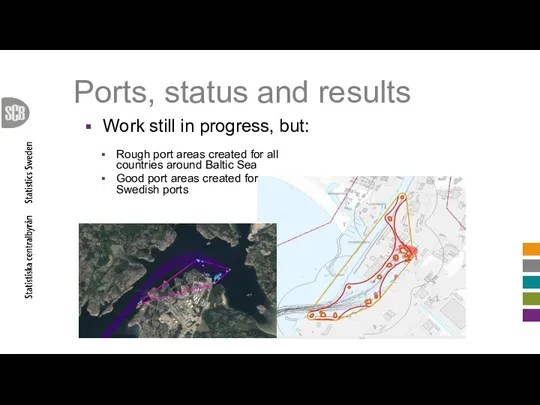
Ports, status and results
Work still in progress, but:
Rough port areas
Ports, status and results
Work still in progress, but:
Rough port areas
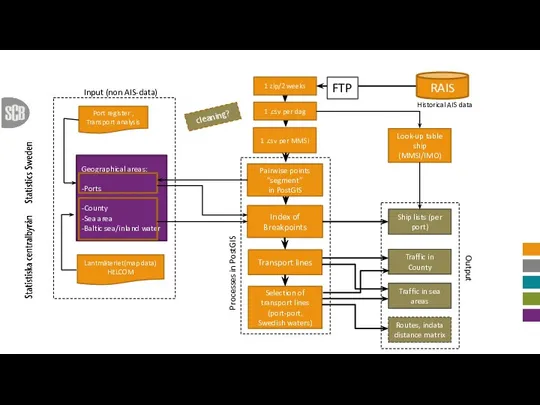
Historical AIS data
Historical AIS data
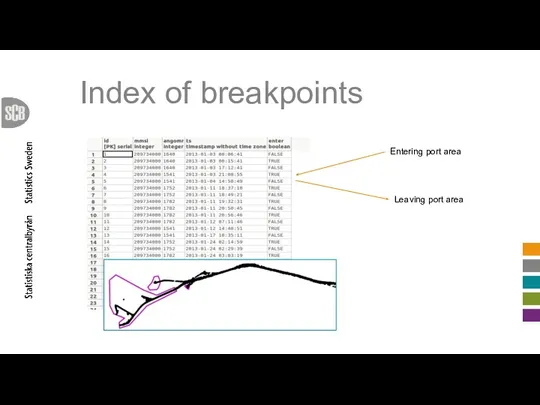
Index of breakpoints
Leaving port area
Entering port area
Index of breakpoints
Leaving port area
Entering port area
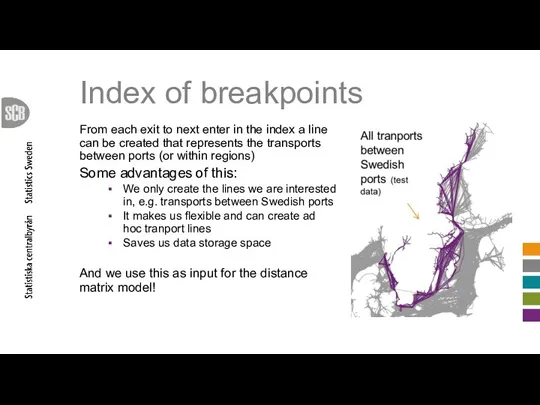
Index of breakpoints
From each exit to next enter in the index
Index of breakpoints
From each exit to next enter in the index

Distance matrix
Distances between ports is used to calculate transport perfomance
Distance matrix
Distances between ports is used to calculate transport perfomance
Distance matrix
Distances between ports is used to calculate transport perfomance
Distance matrix
Distances between ports is used to calculate transport perfomance
Distance matrix
Distances between ports is used to calculate transport perfomance
Distance matrix
Distances between ports is used to calculate transport perfomance
Distance matrix
Distances between ports is used to calculate transport perfomance
Distance matrix
Distances between ports is used to calculate transport perfomance
 Основы кибербезопасности. Лекция 4.1. Понятие об источниках и каналах утечки информации; основы технической защиты информации
 Что такое Dota
 Сравнение двух языков
 Разработка программного приложения с пользовательским интерфейсом в С#. Основные элементы
 Проектная деятельность на уроках информатики
 Вычисление на компьютере с помощью калькулятора. 5 класс
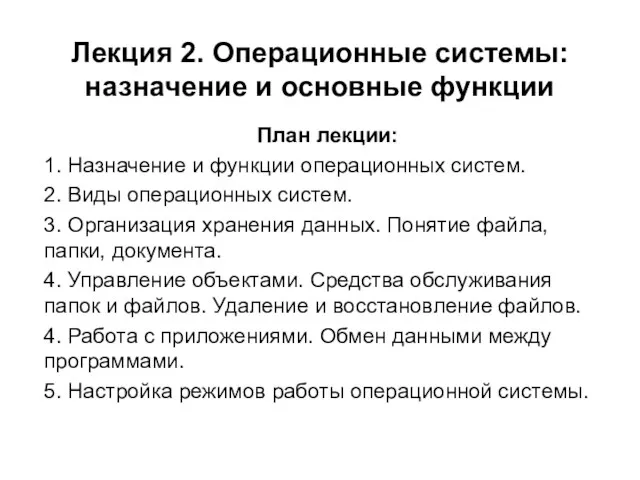 Назначение и функции операционных систем. (Лекция 2)
 Разработка уроков по теме Сайтостроение
 Язык программирования JavaScript
 Операциялық жүйе
 3G technology
 Система управления версиями (VCS)
 Информация и её свойства. Информация и информационные процессы. Информатика. 7 класс
 Основные задачи администрирования ОС. Системный администратор. Типовые задачи системного администрирования. (Лекция 15)
 Практические навыки организации работы сети
 Функциональные возможности Microsoft Office
 Соціальна мережа Instagram
 Полиморфизм (C#, лекция 3)
 Десять трендов маркетинга здравоохранения
 Арифметические действия в различных системах счислениях
 Разработка видеоигры жанра стратегия-roguelike
 HDD - плата управления
 Основы программирования. Типы данных и арифметические операции
 Выполнение работ по профессии Оператор электронно-вычислительных и вычислительных машин
 Solaris - операционная система для архитектуры SPARC
 Магистрально-модульный принцип построения компьютера
 Онлайн-переводчики и ГДЗ: помощники или вредители
 Иллюстрированные правила игры. Twilight imperium 3rd edition