- SUMBA_Potentialstudien_20181204

Содержание
- 2. Input data - Opportunities and limitations Accessibility model and data processing What does our model tell
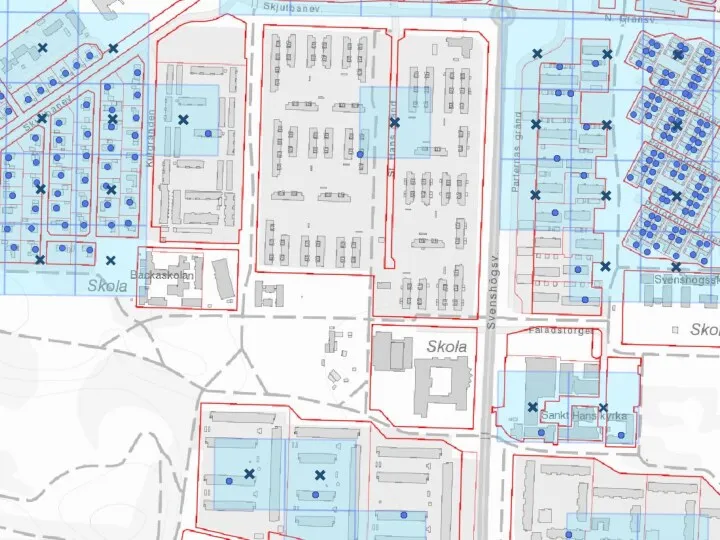
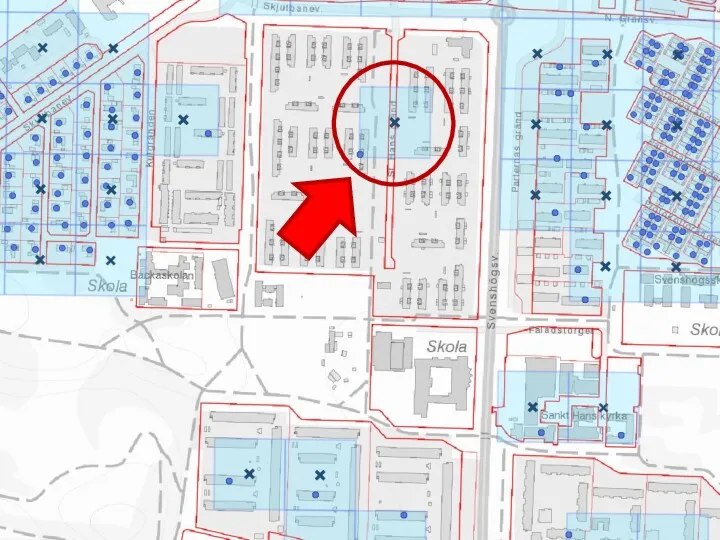
- 3. Pairs of coordinates for all registered residents in Skåne Home address Work address / school address
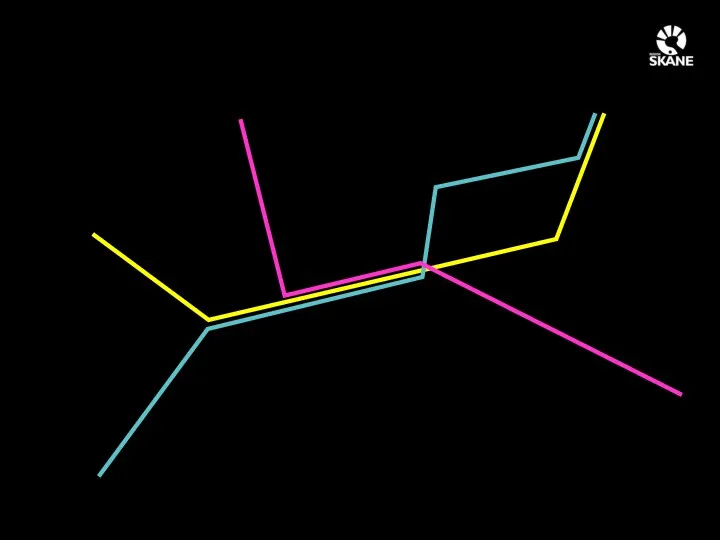
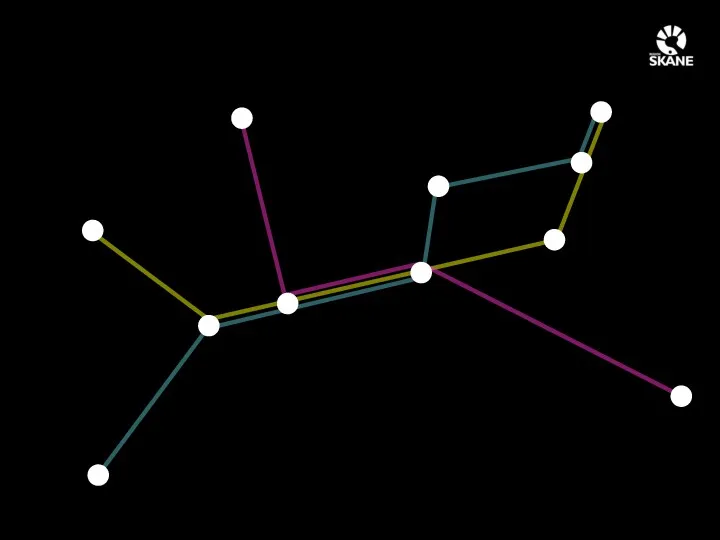
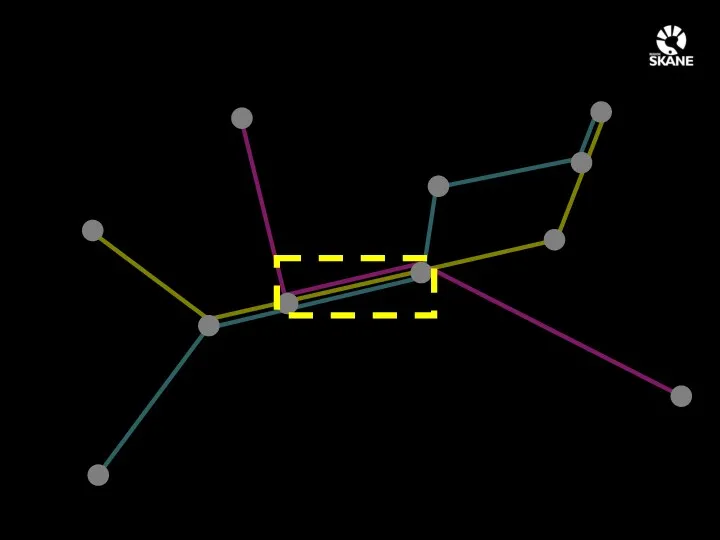
- 6. Networks How can people move from A to B?
- 7. Bicycle paths
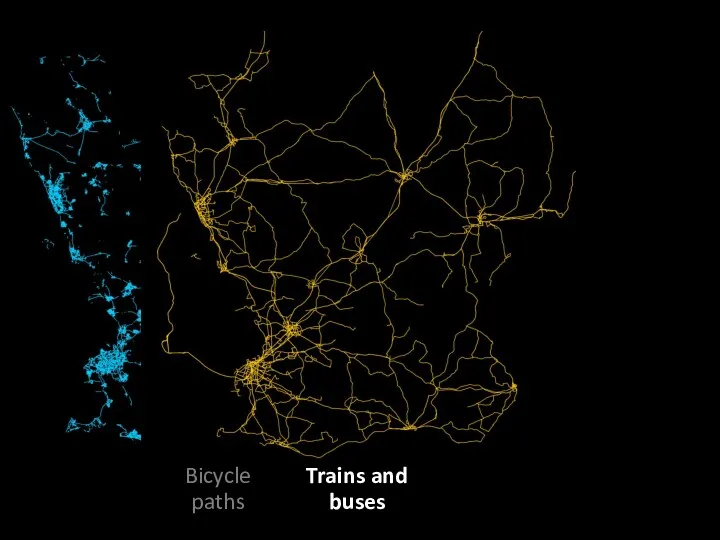
- 8. Bicycle paths Trains and buses
- 9. Bicycle paths Trains and buses Roads
- 10. Input data - Opportunities and limitations Accessibility model and data processing What does our model tell
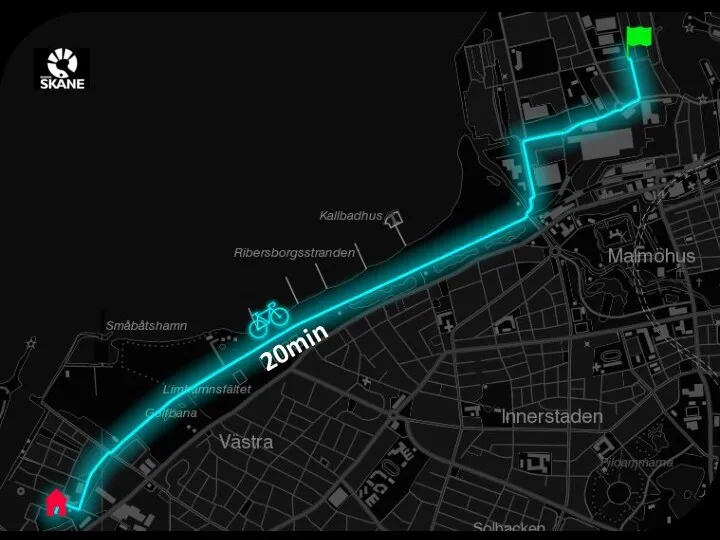
- 11. 20min
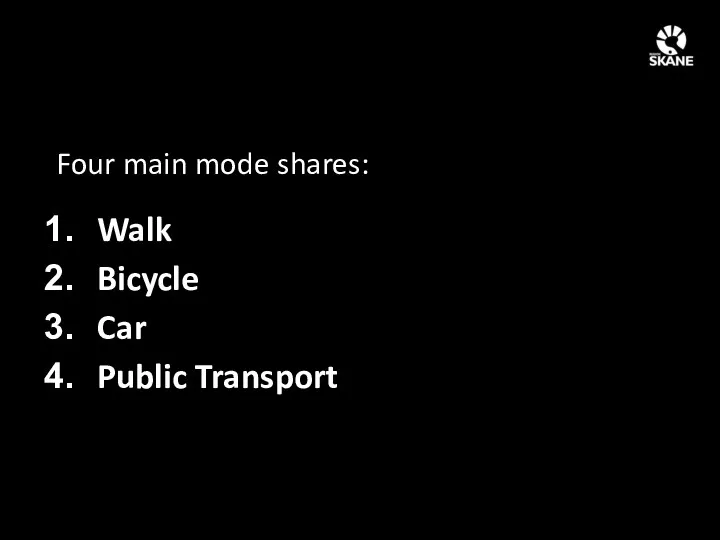
- 12. Four main mode shares: Walk Bicycle Car Public Transport
- 13. Now we’ve calculated routes for each individual’s journey from home to work / school.
- 14. Now we’ve calculated routes for each individual’s journey from home to work / school. If we
- 18. 3 1 1 1 1 1 1 2 2
- 19. Input data - Opportunities and limitations Accessibility model and data processing What does our model tell
- 20. Walking to the train station
- 21. Travel time to work: Average: 51 min Shortest: 12 min Longest: 122 min
- 22. 70 % of all Scanians can travel to work without a car… …yet only 42 %
- 23. Input data - Opportunities and limitations Accessibility model and data processing What does our model tell
- 24. Coordinates that don’t match reality Poor data quality for bicycling and walking infrastructure Modelling public transport
- 25. Coordinates that don’t match reality Poor data quality for bicycling and walking infrastructure Modelling public transport
- 26. Mixed-traffic cycling Regional cycling routes
- 28. Скачать презентацию
Input data - Opportunities and limitations
Accessibility model and data processing
What does
Input data - Opportunities and limitations
Accessibility model and data processing
What does
Pairs of coordinates for all registered residents in Skåne
Home address
Work address
Pairs of coordinates for all registered residents in Skåne
Home address
Work address
Networks
How can people move from A to B?
Networks
How can people move from A to B?
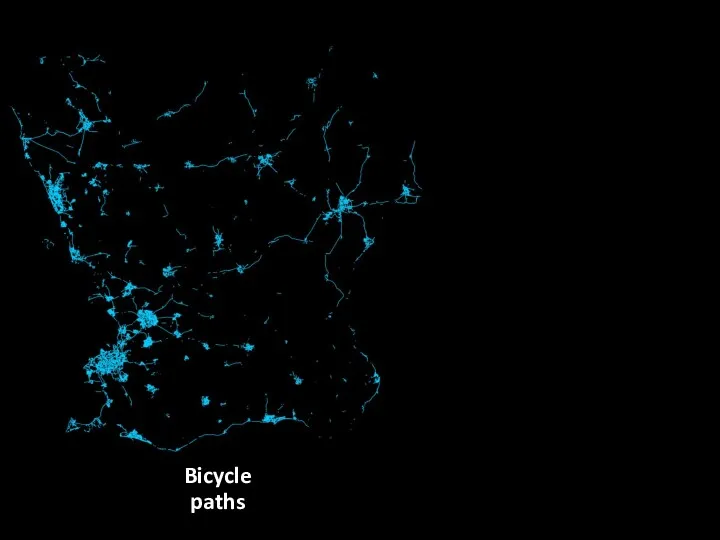
Bicycle
paths
Bicycle
paths
Bicycle
paths
Trains and
buses
Bicycle
paths
Trains and
buses
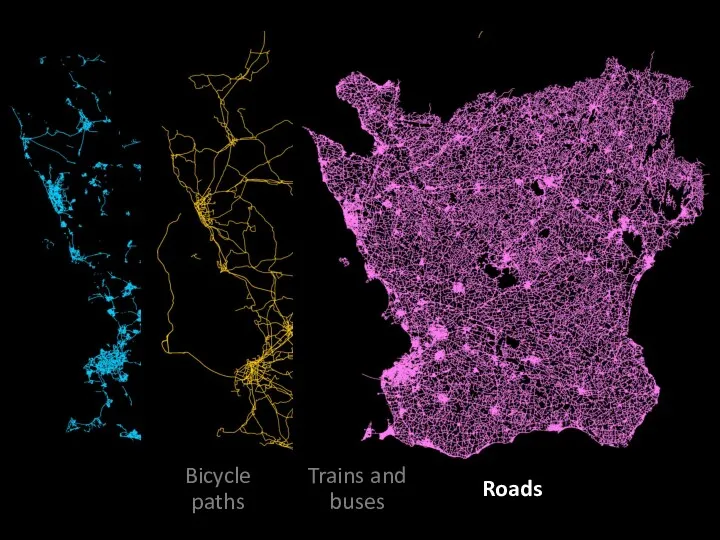
Bicycle
paths
Trains and
buses
Roads
Bicycle
paths
Trains and
buses
Roads
Input data - Opportunities and limitations
Accessibility model and data processing
What does
Input data - Opportunities and limitations
Accessibility model and data processing
What does
20min
20min
Four main mode shares:
Walk
Bicycle
Car
Public Transport
Four main mode shares:
Walk
Bicycle
Car
Public Transport
Now we’ve calculated routes for each individual’s journey from home to
Now we’ve calculated routes for each individual’s journey from home to
Now we’ve calculated routes for each individual’s journey from home to
Now we’ve calculated routes for each individual’s journey from home to
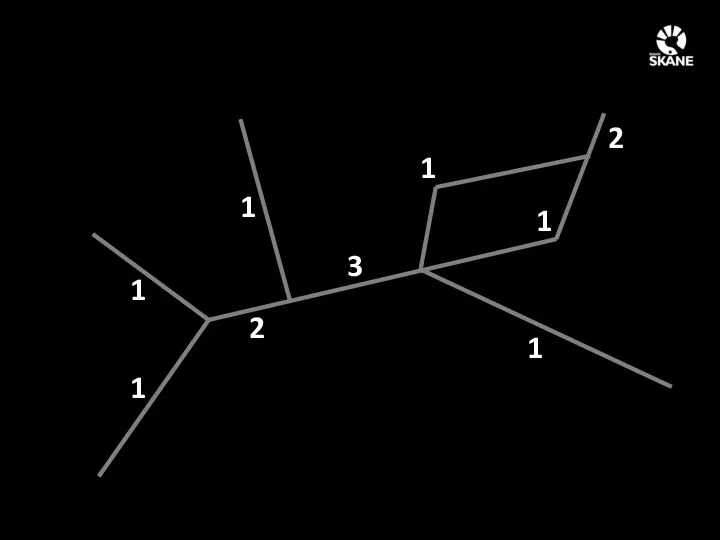
3
1
1
1
1
1
1
2
2
3
1
1
1
1
1
1
2
2
Input data - Opportunities and limitations
Accessibility model and data processing
What does
Input data - Opportunities and limitations
Accessibility model and data processing
What does
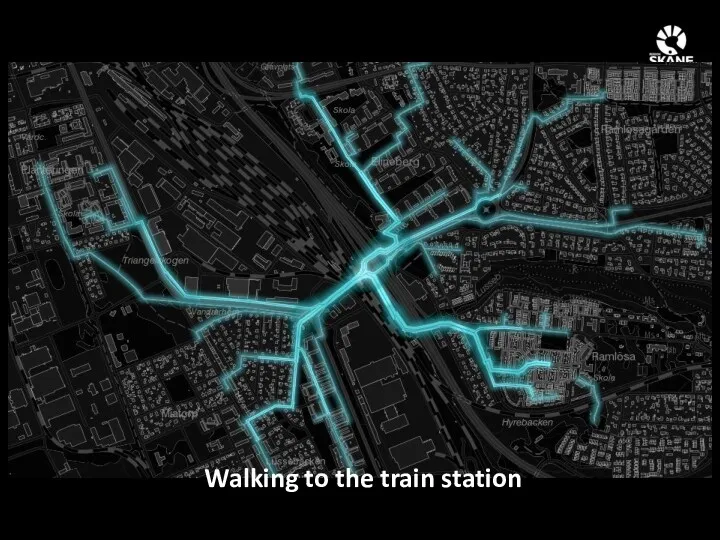
Walking to the train station
Walking to the train station
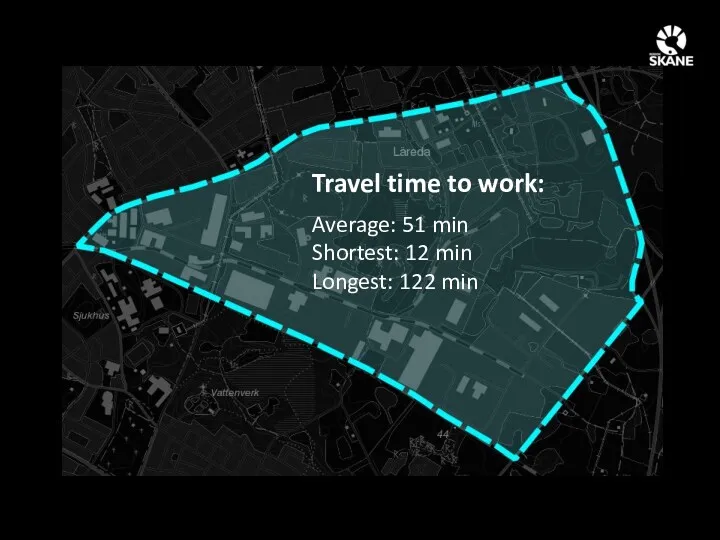
Travel time to work:
Average: 51 min
Shortest: 12 min
Longest: 122 min
Travel time to work:
Average: 51 min
Shortest: 12 min
Longest: 122 min
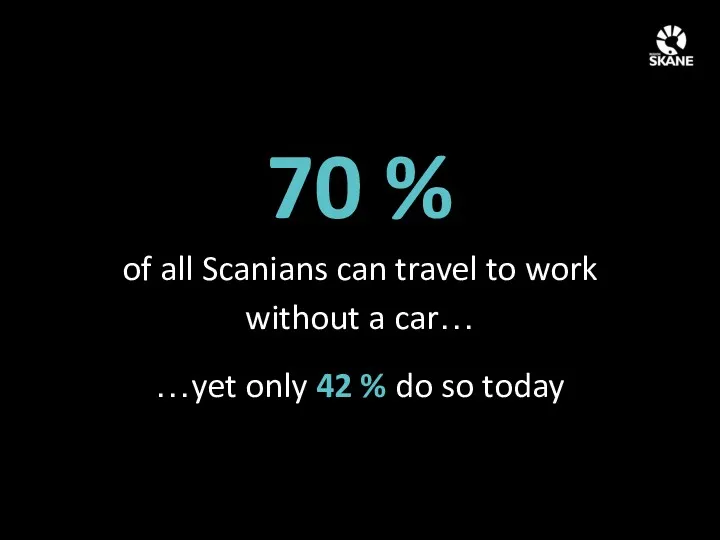
70 %
of all Scanians can travel to work
without a car…
…yet only
70 %
of all Scanians can travel to work
without a car…
…yet only
Input data - Opportunities and limitations
Accessibility model and data processing
What does
Input data - Opportunities and limitations
Accessibility model and data processing
What does
Coordinates that don’t match reality
Poor data quality for bicycling and walking
Coordinates that don’t match reality
Poor data quality for bicycling and walking
Coordinates that don’t match reality
Poor data quality for bicycling and walking
Coordinates that don’t match reality
Poor data quality for bicycling and walking
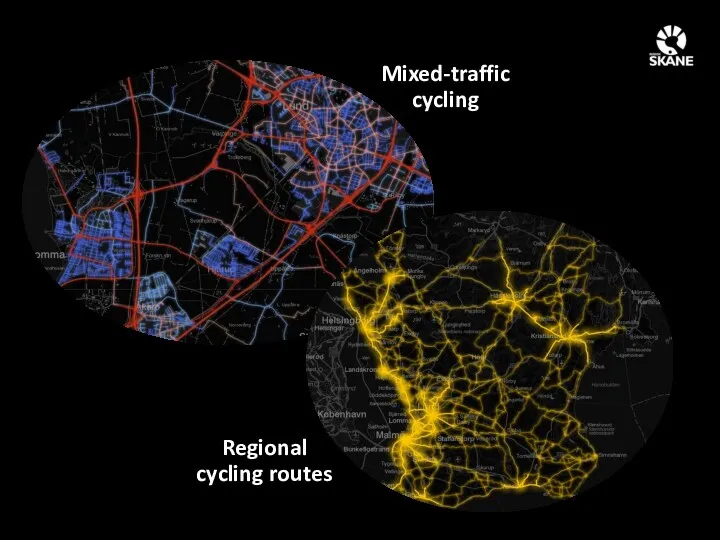
Mixed-traffic
cycling
Regional
cycling routes
Mixed-traffic
cycling
Regional
cycling routes
 Издательство Elsevier
 Специфічні методи наукових досліджень
 Циклы (повтор) в программах. Научиться составлять программы, используя циклический оператор
 Проект Книжный магазин
 Алгоритмизация и программирование. Язык Python
 Технология создания программы с использованием алгоритмической структуры развилка
 Компьютерные презентации. Анимация. 5 класс
 Основи Інтернету. Засоби пошуку інформації в Інтернеті
 Разработка сайта
 Алгоритм работы с программой Photo Booth (авторская работа)
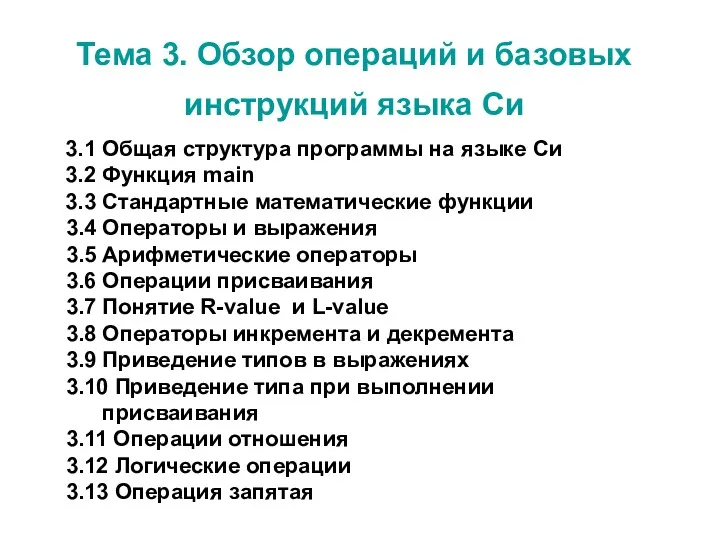 Обзор операций и базовых инструкций языка Си. (Тема 3)
 Создание полноцветной брошюры. Лабораторная работа №3
 Основы программирования для многозадачных операционных систем
 Алгоритмы в жизни
 Организация глобальных сетей. (Глава 2)
 Лекция 2. Моделирование технологических процессов. Аналитические аппроксимации распределения ионов
 Создание анимации Подводный мир
 Правила оформления библиографического аппарата в научных публикациях, курсовых работах и ВКР
 Облачные технологии
 Исследование явления Джулиан Ассанж, Сноуден
 Технологии проектирования компьютерных систем. История создания VHDL. (Лекция 2)
 Двумерные массивы. Матрицы
 Диаграммы. Виды диаграмм
 Кроссворд и ребусы по информатике
 Этика в Интернете
 КОМПЬЮТЕРНЫЕ ВИРУСЫ И АНТИВИРУСНЫЕ ПРОГРАММЫ
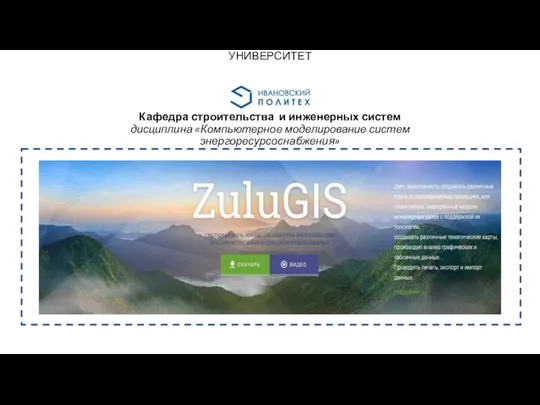 Геоинформационная система ZuluGIS
 Ребенок и компьютер