- Introduction to Statistics. Week 1 (1)

Содержание
- 2. Practical information My office: A 202 IYBF-building Office hours: Tuesdays: 11:00 – 12:00 and 17:00 –
- 3. C Course syllabus Basic course in statistical thinking and analysis. The primary goals are to help
- 4. Class attendance policy Students are expected to attend all scheduled classes as well as to bring
- 5. Tardiness Policy Students are permitted to arrive to the class in the first 15 minutes after
- 6. How I calculate your semester grade DR SUSANNE HANSEN SARAL
- 7. Calculation of class attendance DR SUSANNE HANSEN SARAL
- 8. Course textbook Sharpe: Business Statistics, 3/e, Global Edition, Pearson Newbold, Carlson, Thorne, Statistics for Business and
- 9. Homework on Khan Academy Every week I will assign new homework on www.khanacademy.org I give you
- 10. Create your account in Khan Academy Go to www.khanacademy.org create an account with your email address
- 11. PIAZZA.COM Piazza.com – class platform for: Posting class lectures, course syllabus, class announcement DR SUSANNE HANSEN
- 12. Send me an email to the following address: susanne.saral@okan.edu.tr DR SUSANNE HANSEN SARAL
- 13. What is statistics? What is the average age of the students in this class-room? DR SUSANNE
- 14. What is statistics? Every statistical problem starts with a question! What was the overall customer satisfaction
- 15. What is statistics? Every statistical problem starts with a question! Why would companies or individuals want
- 16. What is statistics? To make good business decisions to help improve company revenues DR SUSANNE HANSEN
- 17. What is statistics? How in Statistics do we go about answering such questions? What was the
- 18. What is statistics? We need to collect information from the source we are interested in to
- 19. What is statistics? Statistics concern populations In the former examples the populations are : All customers
- 20. Statistical key definitions POPULATION A population is the collection of all items of interest under investigation.
- 21. Examples of Populations Incomes of all families in Izmir All children in all elementary schools of
- 22. Statistical key definitions SAMPLE A sample is an observed subset of the population n represents the
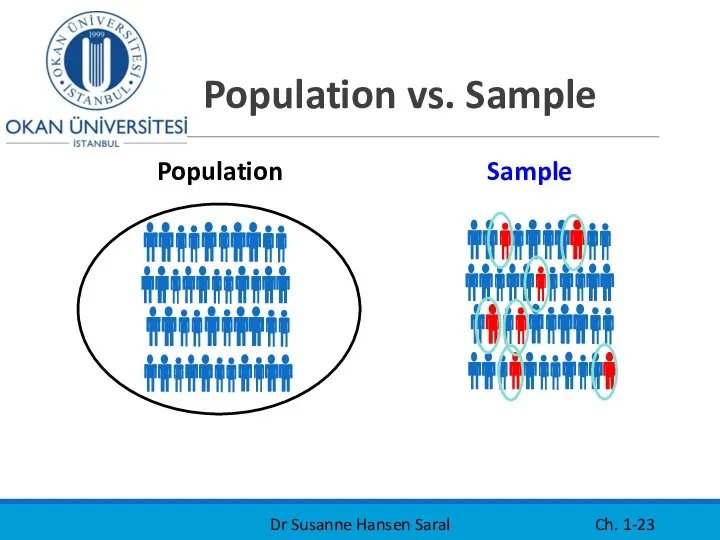
- 23. Population vs. Sample Dr Susanne Hansen Saral Ch. 1- Population Sample
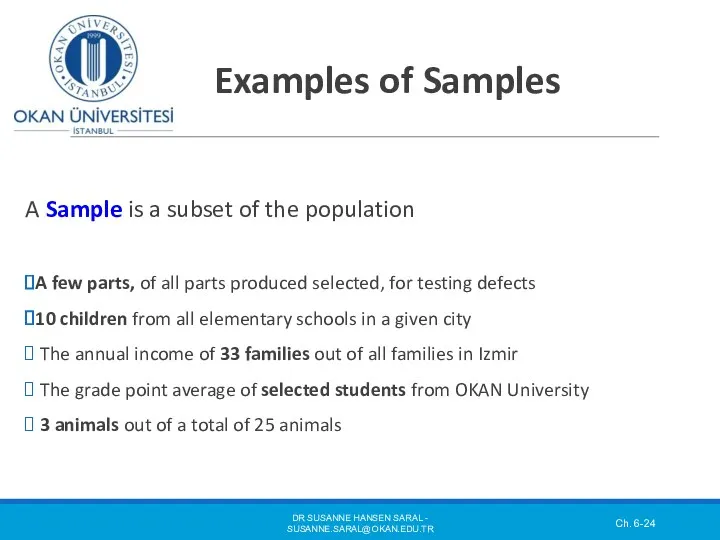
- 24. Examples of Samples A Sample is a subset of the population A few parts, of all
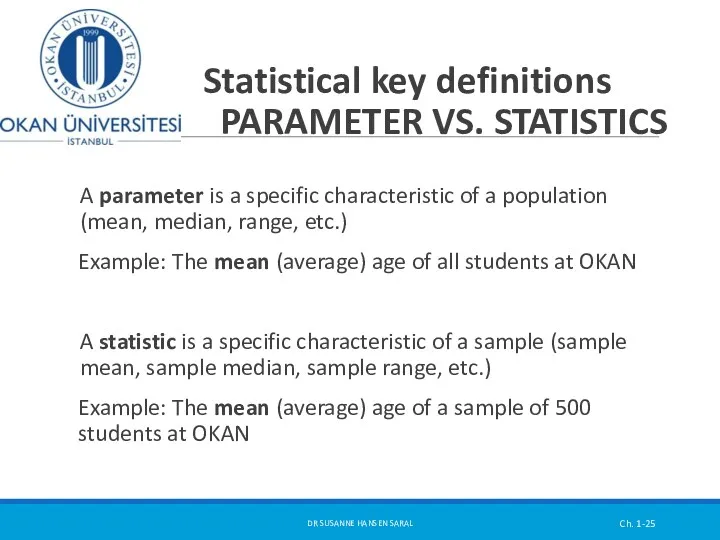
- 25. Statistical key definitions PARAMETER VS. STATISTICS A parameter is a specific characteristic of a population (mean,
- 26. Why is it necessary to collect samples? Populations are indefinite and their parameters are rarely known.
- 27. Why is it necessary to collect samples? Populations are usually infinite. Therefore impossible to investigate the
- 28. Randomness (Turkish: Rasgelelik) Our final objective in statistics is to make valid and reliable statements about
- 29. Main sampling techniques Simple random sampling Systematic sampling Both techniques respect randomness and therefore provide reliable
- 30. Random Sampling Simple random sampling is a procedure in which: Each member/item in the population is
- 31. Sampling error In statistics we make decision about a population based on sample data, because the
- 32. Non-sampling error Non-sampling errors: Are errors not connected to the sampling procedure Population is not properly
- 33. Inferential statistics Drawing conclusion about a population based a sample information. DR SUSANNE HANSEN SARAL Ch.
- 34. Inferential statistics To draw conclusions about the population based on a sample we need to collect
- 35. What is data? Data = information Data can be numbers: Size of a hotel bill, number
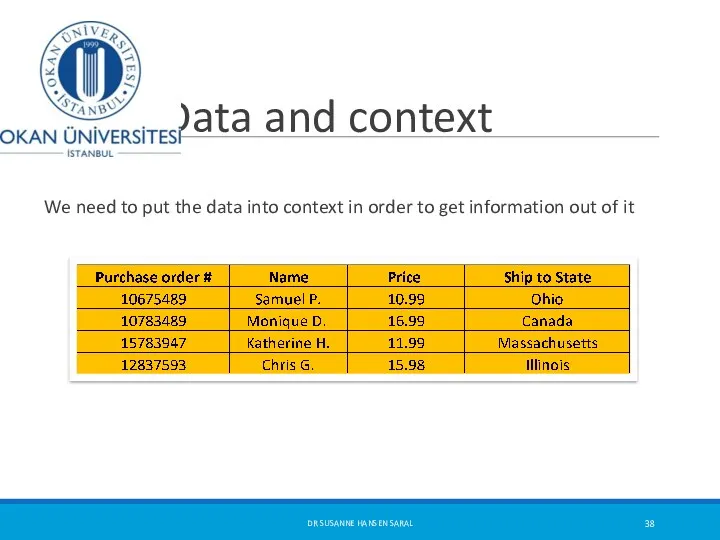
- 36. Data and context Data are useless without a context. When we deal with data we need
- 37. Data and context Data values are useless without their context Consider the following: Amazon.com may collect
- 38. Data and context We need to put the data into context in order to get information
- 39. What is statistics? It is a basic study of transforming data into information : how to
- 40. Where does data come from? Market research Survey (online questionnaires, paper questionnaires, etc.) Interviews Research experiments
- 42. Скачать презентацию
Practical information
My office: A 202 IYBF-building
Office hours:
Practical information
My office: A 202 IYBF-building
Office hours:
C
Course syllabus
Basic course in statistical thinking and analysis. The primary
C
Course syllabus
Basic course in statistical thinking and analysis. The primary
Class attendance policy
Students are expected to attend all scheduled classes
Class attendance policy
Students are expected to attend all scheduled classes
Tardiness Policy
Students are permitted to arrive to the class in
Tardiness Policy
Students are permitted to arrive to the class in
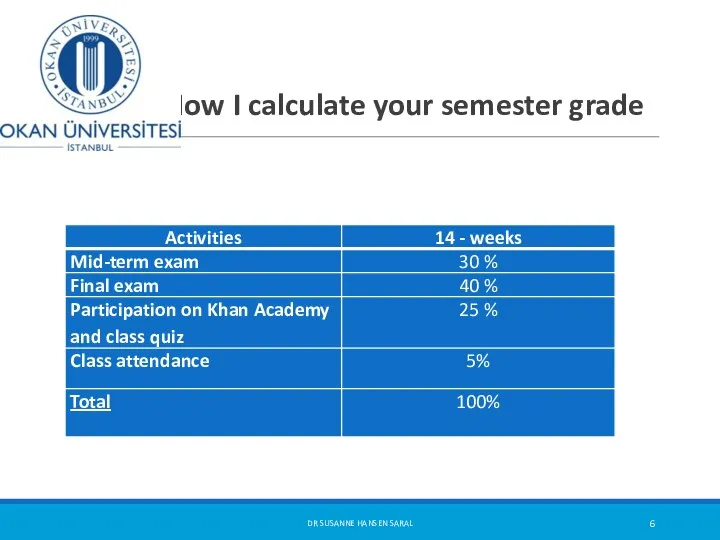
How I calculate your semester grade
DR SUSANNE HANSEN SARAL
How I calculate your semester grade
DR SUSANNE HANSEN SARAL
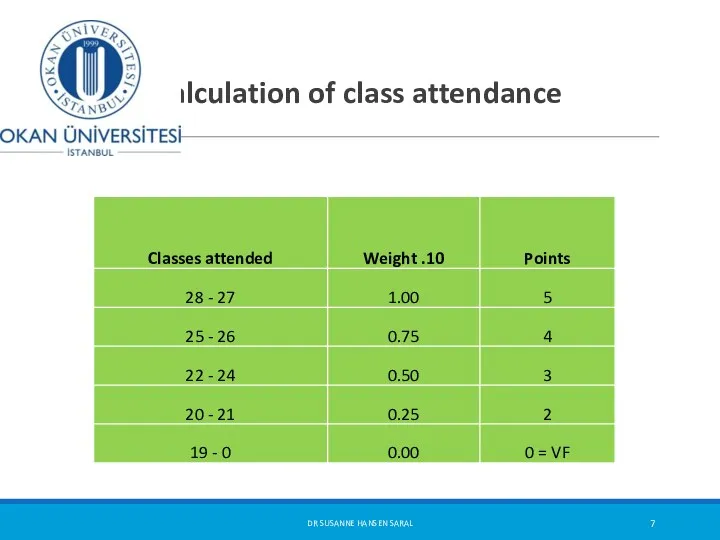
Calculation of class attendance
DR SUSANNE HANSEN SARAL
Calculation of class attendance
DR SUSANNE HANSEN SARAL
Course textbook
Sharpe: Business Statistics, 3/e, Global Edition, Pearson
Newbold, Carlson, Thorne, Statistics
Course textbook
Sharpe: Business Statistics, 3/e, Global Edition, Pearson
Newbold, Carlson, Thorne, Statistics
Homework on Khan Academy
Every week I will assign new homework
Homework on Khan Academy
Every week I will assign new homework
Create your account in
Khan Academy
Go to www.khanacademy.org create an
Create your account in
Khan Academy
Go to www.khanacademy.org create an
PIAZZA.COM
Piazza.com – class platform for:
Posting class lectures, course syllabus, class
PIAZZA.COM
Piazza.com – class platform for:
Posting class lectures, course syllabus, class
Send me an email to the following address:
susanne.saral@okan.edu.tr
DR SUSANNE HANSEN
susanne.saral@okan.edu.tr
DR SUSANNE HANSEN
What is statistics?
What is the average age of the students
What is statistics?
What is the average age of the students
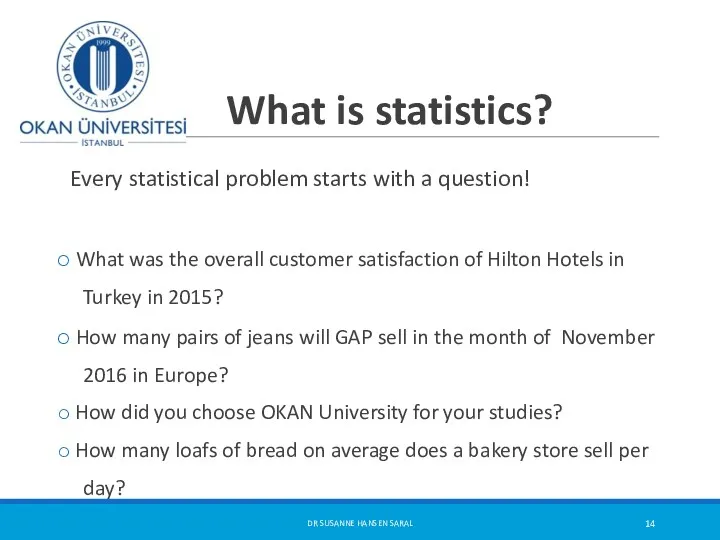
What is statistics?
Every statistical problem starts with a question!
What
What is statistics?
Every statistical problem starts with a question!
What
What is statistics?
Every statistical problem starts with a question!
Why would
What is statistics?
Every statistical problem starts with a question!
Why would
What is statistics?
To make good business decisions to help improve
What is statistics?
To make good business decisions to help improve
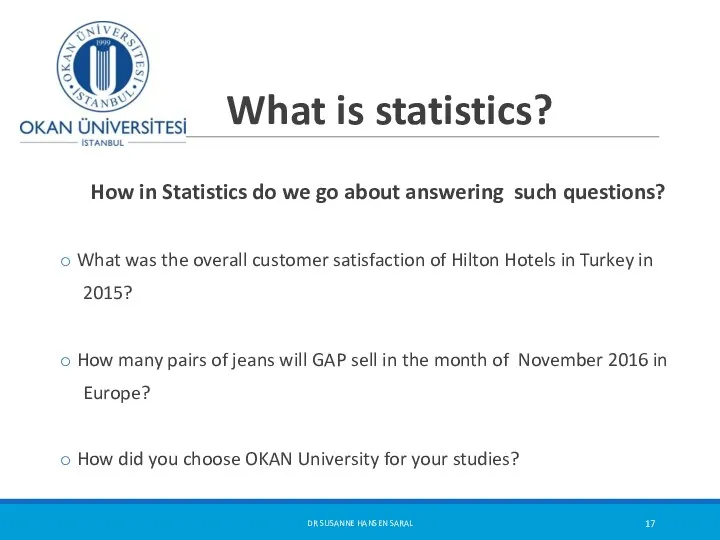
What is statistics?
How in Statistics do we go about
What is statistics?
How in Statistics do we go about
What is statistics?
We need to collect information from the source
What is statistics?
We need to collect information from the source
What is statistics?
Statistics concern populations
In the former examples the populations
What is statistics?
Statistics concern populations
In the former examples the populations
Statistical key definitions
POPULATION
A population is the collection of all
Statistical key definitions
POPULATION
A population is the collection of all
Examples of Populations
Incomes of all families in Izmir
All
Examples of Populations
Incomes of all families in Izmir
All
Statistical key definitions SAMPLE
A sample is an observed subset of
Statistical key definitions SAMPLE
A sample is an observed subset of
Population vs. Sample
Dr Susanne Hansen Saral
Ch. 1-
Population
Sample
Population vs. Sample
Dr Susanne Hansen Saral
Ch. 1-
Population
Sample
Examples of Samples
A Sample is a subset of the population
A
Examples of Samples
A Sample is a subset of the population
A
Statistical key definitions
PARAMETER VS. STATISTICS
A parameter is a specific
Statistical key definitions
PARAMETER VS. STATISTICS
A parameter is a specific
Why is it necessary to collect samples?
Populations are indefinite
Why is it necessary to collect samples?
Populations are indefinite
Why is it necessary to collect samples?
Populations are usually
Why is it necessary to collect samples?
Populations are usually
Randomness (Turkish: Rasgelelik)
Our final objective in statistics is to make valid
Randomness (Turkish: Rasgelelik)
Our final objective in statistics is to make valid
Main sampling techniques
Simple random sampling
Systematic sampling
Both techniques respect randomness and therefore
Main sampling techniques
Simple random sampling
Systematic sampling
Both techniques respect randomness and therefore
Random Sampling
Simple random sampling is a procedure in which:
Each member/item
Random Sampling
Simple random sampling is a procedure in which:
Each member/item
Sampling error
In statistics we make decision about a population based on
Sampling error
In statistics we make decision about a population based on
Non-sampling error
Non-sampling errors: Are errors not connected to the sampling procedure
Population
Non-sampling error
Non-sampling errors: Are errors not connected to the sampling procedure
Population
Inferential statistics
Drawing conclusion about a population
based a sample information.
DR
Inferential statistics
Drawing conclusion about a population
based a sample information.
DR
Inferential statistics
To draw conclusions about the population based on a
sample
Inferential statistics
To draw conclusions about the population based on a
sample
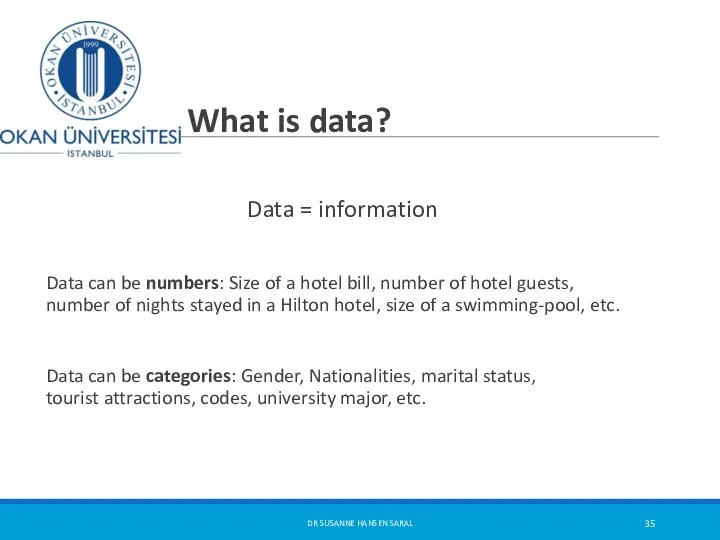
What is data?
Data = information
Data can be numbers: Size
What is data?
Data = information
Data can be numbers: Size
Data and context
Data are useless without a context.
When we
Data and context
Data are useless without a context.
When we
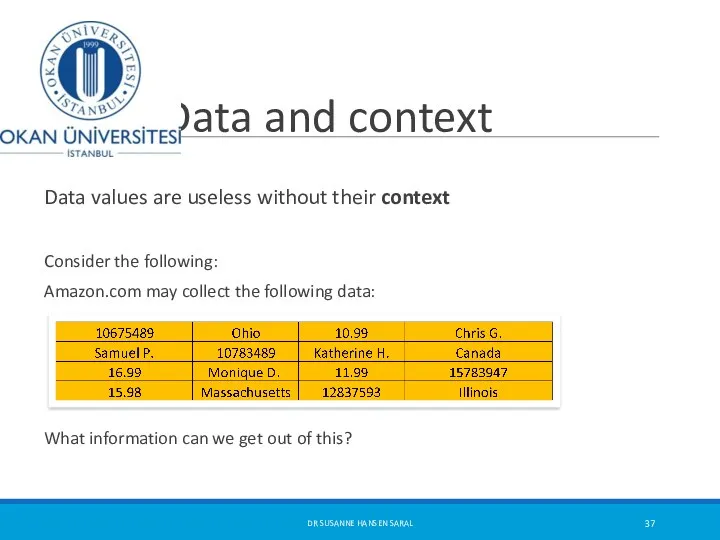
Data and context
Data values are useless without their context
Consider
Data and context
Data values are useless without their context
Consider
Data and context
We need to put the data into
Data and context
We need to put the data into
What is statistics?
It is a basic study of transforming data
What is statistics?
It is a basic study of transforming data
Where does data come from?
Market research
Survey (online questionnaires,
Where does data come from?
Market research
Survey (online questionnaires,
 Правило умножения. Перестановки и факториалы
 Урок математики.Решение задач и выражений
 Числовые и буквенные выражения
 Подобные треугольники. Пропорциональные отрезки
 График квадратичной функции
 Задачи повышенной сложности .
 Повторение и закрепление изученного материала по математике (1 класс)
 Дидактическая игра -Собери грибы
 Как собрать кубик Рубика (и другие головоломки)
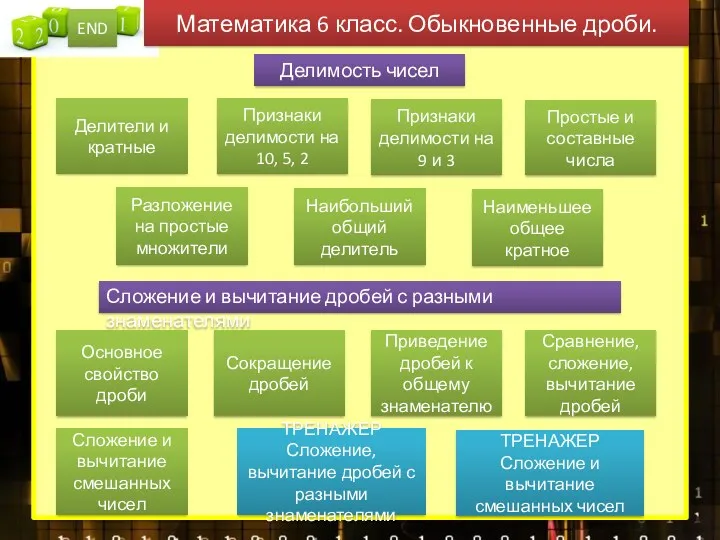 Математика 6 класс. Обыкновенные дроби
 Решение задач на применение аксиом стереометрии
 Математические ребусы
 Открытый урок (презентация)
 Автокорреляция
 Внеклассное мероприятие по математике Звездный час
 Санау жұйесі
 Пирамида. Правильная пирамида
 Презентация к уроку математики во 2 классе по теме: Час.Минута. Определение времени по часам
 Системы нелинейных уравнений с двумя неизвестными
 Презентация к уроку математики в 3 классе по теме Закрепление. Решение задач.
 Презентация Лесенка неделька (Учим дни недели)
 Приближение десятичных дробей
 Деление с остатком
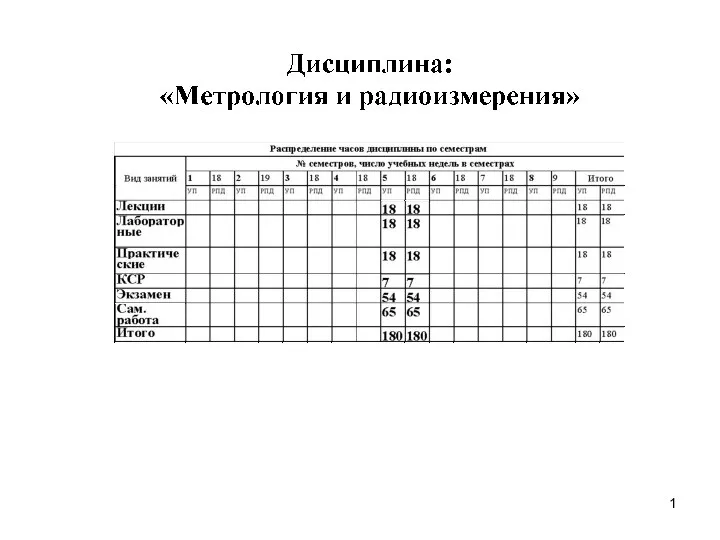 Основные понятия и термины метрологии
 Внеклассное мероприятие по математике в 6 классе
 Работа по геометрии по теме Тела вращения - Гиперсфера (пояснительная записка + презентация)
 Анимашки для оформления презентаций в Microsoft Power Point. Сборник №3
 Дружок. Правила по математике для учащихся 1 класса