- Measures of variation. Week 4 (1)

Содержание
- 2. Numerical measures to describe data COPYRIGHT © 2013 PEARSON EDUCATION, INC. PUBLISHING AS PRENTICE HALL Ch.
- 3. Interquatile range, IQR Alternative way to calculate the IQR Khan Academy
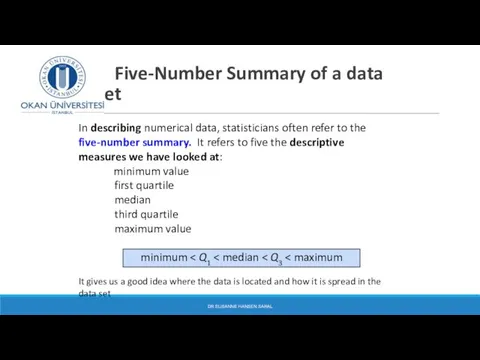
- 5. Five-Number Summary of a data set DR SUSANNE HANSEN SARAL In describing numerical data, statisticians often
- 6. Five-Number Summary: Example DR SUSANNE HANSEN SARAL minimum 6 Sample Ranked Data: 6 7 8 9
- 7. Exercise Consider the data given below: 110 125 99 115 119 95 110 132 85 a.
- 8. Exercise Consider the data given below. 85 95 99 110 110 115 119 125 132 a.
- 9. Five number summary and Boxplots Boxplot is created from the five-number summary A boxplot is a
- 10. Five number summary and Boxplots Boxplot is created from the five-number summary The central box shows
- 11. Five number summary and boxplot
- 12. Five number summary and boxplot
- 13. Boxplot COPYRIGHT © 2013 PEARSON EDUCATION, INC. PUBLISHING AS PRENTICE HALL Ch. 2- Median (Q2) maximum
- 14. Gilotti’s Pizza Sales in $100s
- 15. Gilotti’s Pizza Sales What are the shapes of the distribution of the four data set?
- 16. Gilotti’s Pizza Sales - boxplot
- 17. Gilotti’s Pizza Sales in $100s
- 18. Measuring variation in a data set that follows a normal distribution COPYRIGHT © 2013 PEARSON EDUCATION,
- 19. Measuring variation in a data set Data set 1 : 23 19 21 18 24 21
- 20. Average distance to the mean: Standard deviation Most commonly used measure of variability Measures the standard
- 21. Calculating the average distance to the mean 2/22/2017
- 22. Calculating the average distance to the mean 2/22/2017
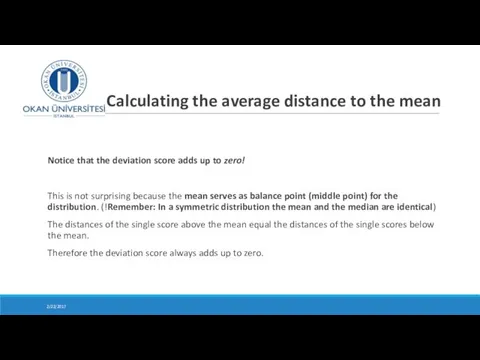
- 23. Calculating the average distance to the mean Notice that the deviation score adds up to zero!
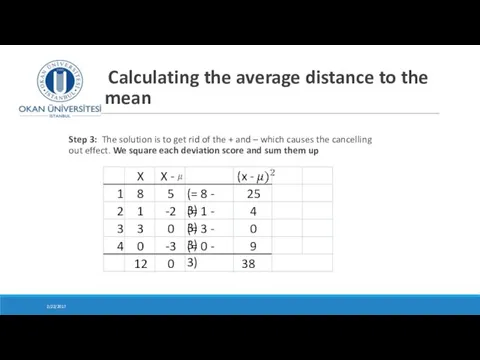
- 24. Calculating the average distance to the mean Step 3: The solution is to get rid of
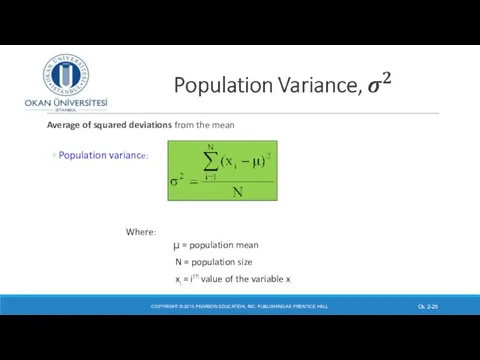
- 25. Average of squared deviations from the mean Population variance: COPYRIGHT © 2013 PEARSON EDUCATION, INC. PUBLISHING
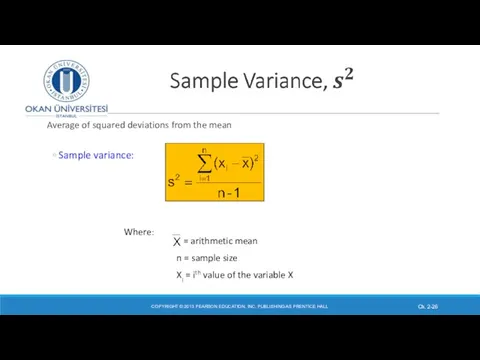
- 26. Average of squared deviations from the mean Sample variance: COPYRIGHT © 2013 PEARSON EDUCATION, INC. PUBLISHING
- 27. Most commonly used measure of variation in a population Shows variation about the mean in a
- 28. Sample Standard Deviation, s Most commonly used measure of variation in a sample Shows variation about
- 29. Calculation Example: Sample Standard Deviation, s COPYRIGHT © 2013 PEARSON EDUCATION, INC. PUBLISHING AS PRENTICE HALL
- 30. Class example Calculating sample variance and standard deviation DR SUSANNE HANSEN SARAL
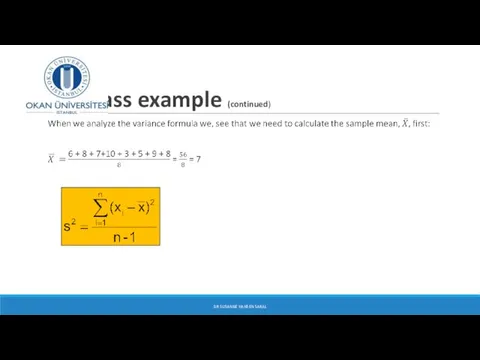
- 31. Class example (continued) DR SUSANNE HANSEN SARAL
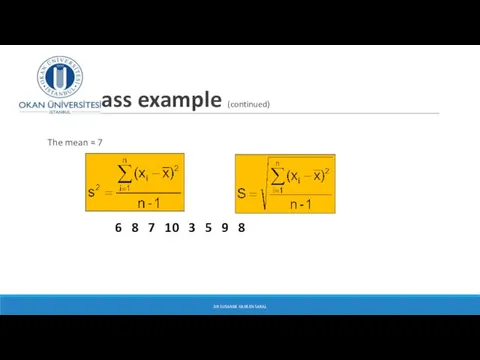
- 32. Class example (continued) The mean = 7 DR SUSANNE HANSEN SARAL 6 8 7 10 3
- 34. Скачать презентацию
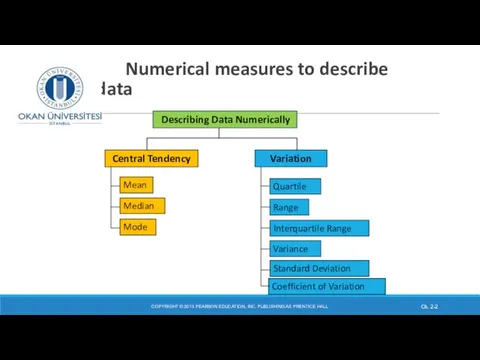
Numerical measures to describe data
COPYRIGHT © 2013 PEARSON EDUCATION,
Numerical measures to describe data
COPYRIGHT © 2013 PEARSON EDUCATION,
Interquatile range, IQR
Alternative way to calculate the IQR
Khan
Interquatile range, IQR
Alternative way to calculate the IQR
Khan
Five-Number Summary of a data set
DR SUSANNE HANSEN SARAL
In describing numerical
Five-Number Summary of a data set
DR SUSANNE HANSEN SARAL
In describing numerical
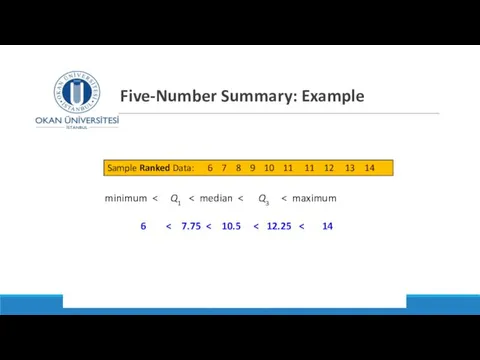
Five-Number Summary: Example
DR SUSANNE HANSEN SARAL
minimum < Q1 <
Five-Number Summary: Example
DR SUSANNE HANSEN SARAL
minimum < Q1 <
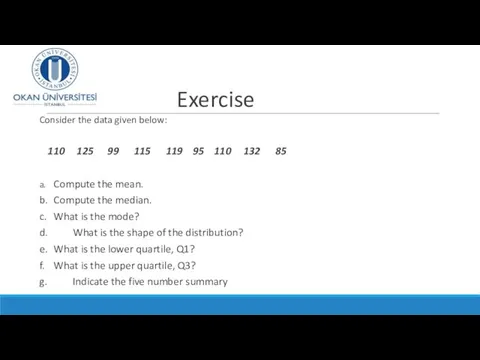
Exercise
Consider the data given below:
110 125 99 115 119 95
Exercise
Consider the data given below:
110 125 99 115 119 95
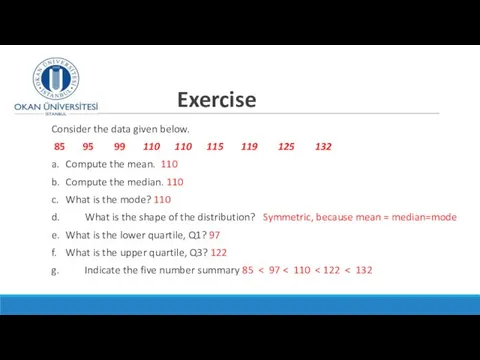
Exercise
Consider the data given below.
85 95 99 110 110 115
Exercise
Consider the data given below.
85 95 99 110 110 115
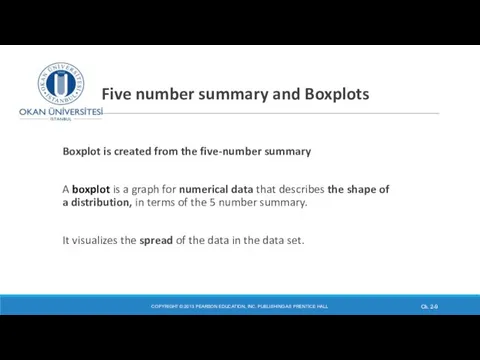
Five number summary and Boxplots
Boxplot is created from the five-number summary
A
Five number summary and Boxplots
Boxplot is created from the five-number summary
A
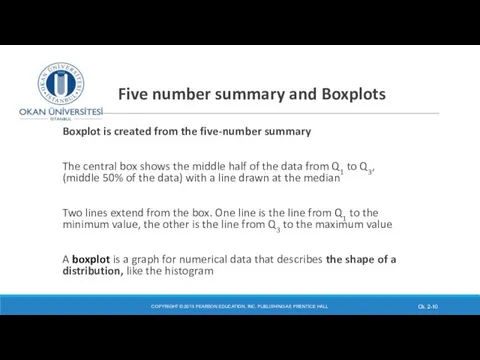
Five number summary and Boxplots
Boxplot is created from the five-number summary
The
Five number summary and Boxplots
Boxplot is created from the five-number summary
The
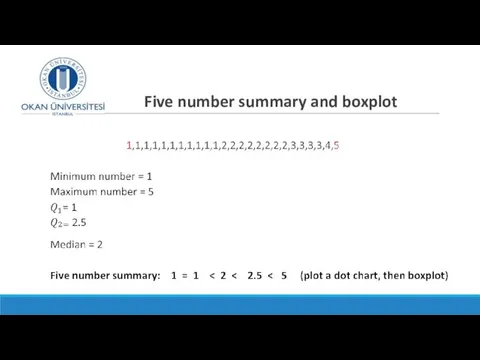
Five number summary and boxplot
Five number summary and boxplot
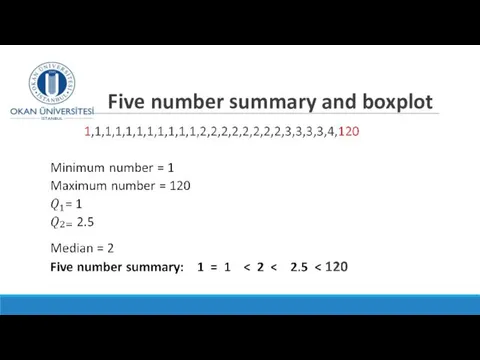
Five number summary and boxplot
Five number summary and boxplot
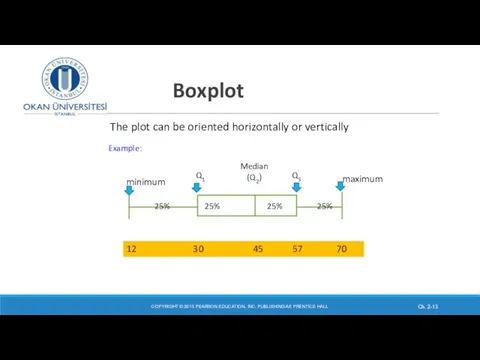
Boxplot
COPYRIGHT © 2013 PEARSON EDUCATION, INC. PUBLISHING AS PRENTICE HALL
Ch.
Boxplot
COPYRIGHT © 2013 PEARSON EDUCATION, INC. PUBLISHING AS PRENTICE HALL
Ch.
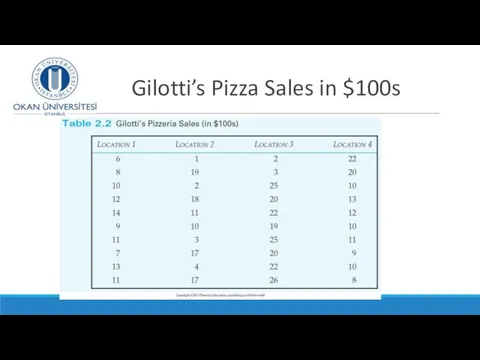
Gilotti’s Pizza Sales in $100s
Gilotti’s Pizza Sales in $100s
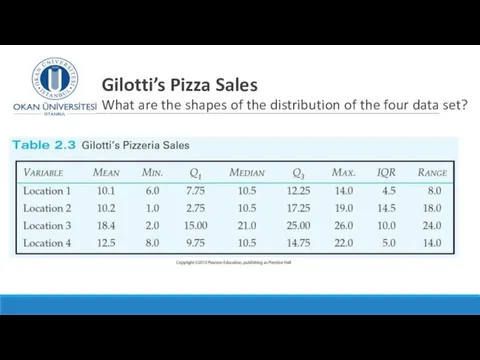
Gilotti’s Pizza Sales
What are the shapes of the distribution
Gilotti’s Pizza Sales What are the shapes of the distribution
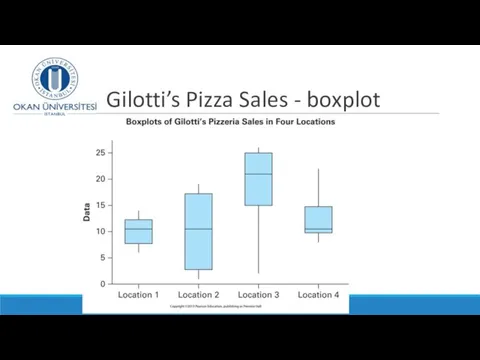
Gilotti’s Pizza Sales - boxplot
Gilotti’s Pizza Sales - boxplot

Gilotti’s Pizza Sales in $100s
Gilotti’s Pizza Sales in $100s
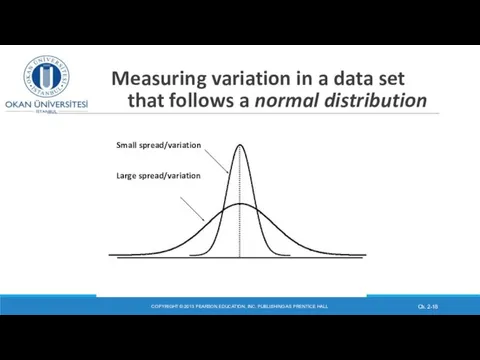
Measuring variation in a data set
that follows a normal distribution
COPYRIGHT
Measuring variation in a data set
that follows a normal distribution
COPYRIGHT
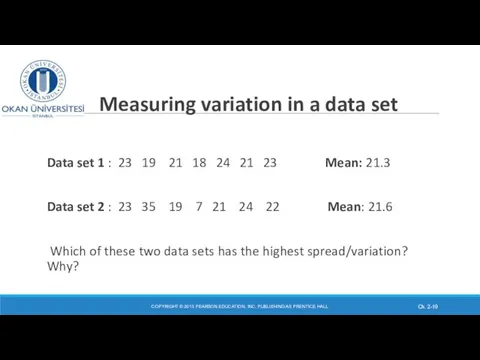
Measuring variation in a data set
Data set 1 : 23 19
Measuring variation in a data set
Data set 1 : 23 19
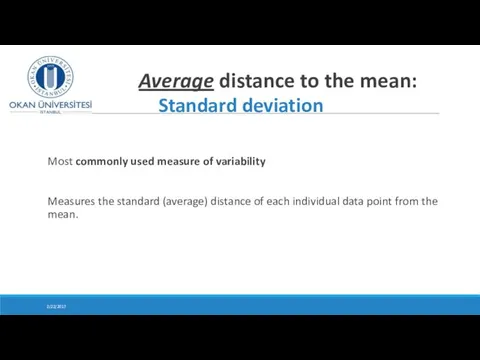
Average distance to the mean:
Standard deviation
Most commonly used measure
Average distance to the mean:
Standard deviation
Most commonly used measure
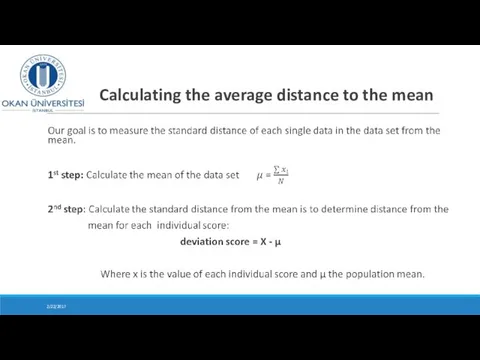
Calculating the average distance to the mean
2/22/2017
Calculating the average distance to the mean
2/22/2017
Calculating the average distance to the mean
2/22/2017
Calculating the average distance to the mean
2/22/2017
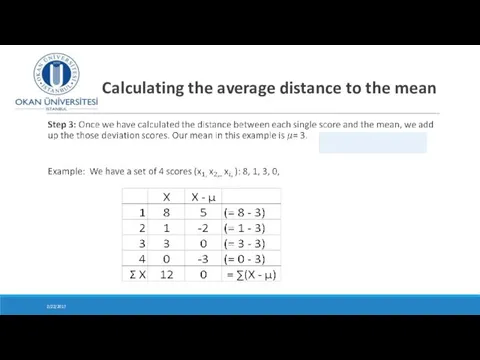
Calculating the average distance to the mean
Notice that the deviation
Calculating the average distance to the mean
Notice that the deviation
Calculating the average distance to the mean
Step 3: The
Calculating the average distance to the mean
Step 3: The
Average of squared deviations from the mean
Population variance:
COPYRIGHT © 2013 PEARSON
Average of squared deviations from the mean
Population variance:
COPYRIGHT © 2013 PEARSON
Average of squared deviations from the mean
Sample variance:
COPYRIGHT © 2013 PEARSON
Average of squared deviations from the mean
Sample variance:
COPYRIGHT © 2013 PEARSON
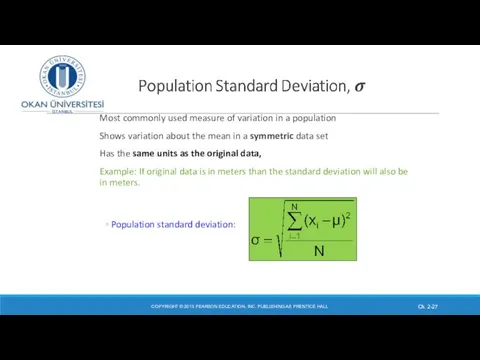
Most commonly used measure of variation in a population
Shows variation
Most commonly used measure of variation in a population
Shows variation
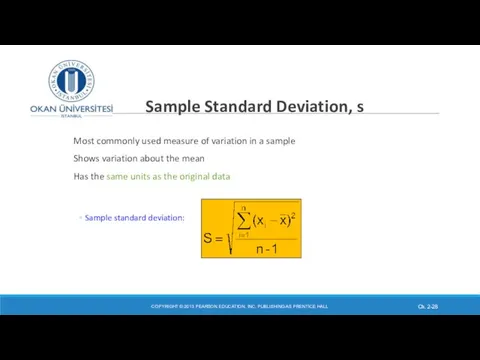
Sample Standard Deviation, s
Most commonly used measure of variation in
Sample Standard Deviation, s
Most commonly used measure of variation in
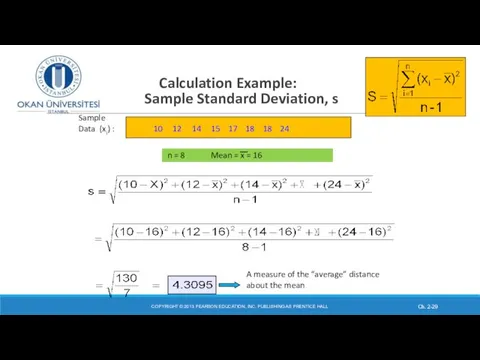
Calculation Example:
Sample Standard Deviation, s
COPYRIGHT © 2013 PEARSON EDUCATION, INC.
Calculation Example:
Sample Standard Deviation, s
COPYRIGHT © 2013 PEARSON EDUCATION, INC.
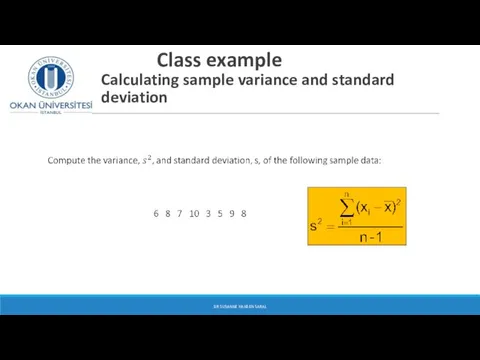
Class example
Calculating sample variance and standard deviation
DR SUSANNE HANSEN SARAL
Class example
Calculating sample variance and standard deviation
DR SUSANNE HANSEN SARAL
Class example (continued)
DR SUSANNE HANSEN SARAL
Class example (continued)
DR SUSANNE HANSEN SARAL
Class example (continued)
The mean = 7
DR SUSANNE HANSEN SARAL
6 8
Class example (continued)
The mean = 7
DR SUSANNE HANSEN SARAL
6 8
 Рівняння х^2=a
 Свойства степени с рациональным показателем. 9 класс
 Многочлены. Действия с многочленами
 Статистика
 Деление окружности на равные части
 Математическая раскраска Колобок
 Кривые второго порядка
 Сумма углов треугольника
 Касательная. Уравнение касательной
 Умножение десятичных дробей
 Математичний диктант
 Корреляция теориясының элементтері
 Модуль Алгебра №12
 презентация к уроку Точка, прямая, кривая
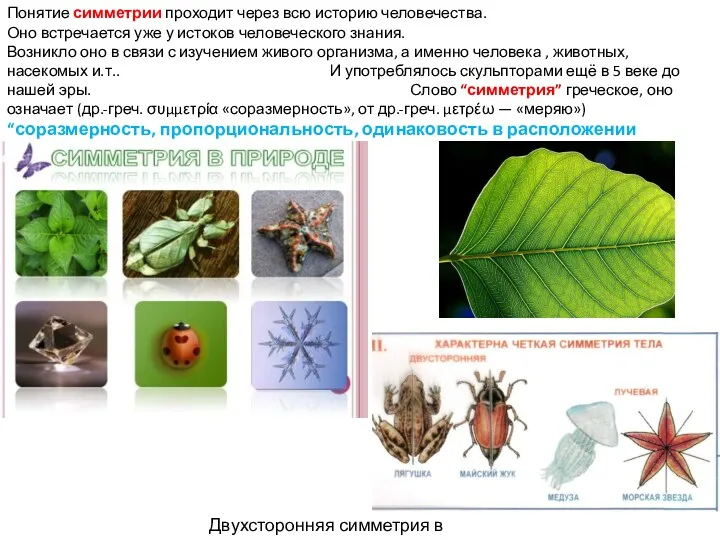 Понятие симметрии
 Рациональные числа и действия над ними. 6 класс
 Числа Фибоначчи
 Состав двузначных чисел(Математика 2 класс)
 Презентация для урока математики во 2 классе. Числа 11 - 13. Закрепление
 Обобщение материала по теме Умножение и деление обыкновенных дробей 6 класс
 Теорема Виета
 Десятичные дроби
 Урок математики в 4 классе Решение задач. Когда количество одинаковое ПНШ
 Математика. Матрицы
 Задачи на движение. (6 класс)
 Прямокутний трикутник. Властивості прямокутного трикутника
 Неделя математики, физики, информатики
 Палочки-выручалочки.