- Basics of ECG

Содержание
- 2. HISTORY 1842- Italian scientist Carlo Matteucci realizes that electricity is associated with the heart beat 1876-
- 3. CONTD… 1924 - the noble prize for physiology or medicine is given to William Einthoven for
- 5. MODERN ECG INSTRUMENT
- 6. What is an EKG? The electrocardiogram (EKG) is a representation of the electrical events of the
- 7. With EKGs we can identify Arrhythmias Myocardial ischemia and infarction Pericarditis Chamber hypertrophy Electrolyte disturbances (i.e.
- 8. Depolarization Contraction of any muscle is associated with electrical changes called depolarization These changes can be
- 9. Pacemakers of the Heart SA Node - Dominant pacemaker with an intrinsic rate of 60 -
- 10. Standard calibration 25 mm/s 0.1 mV/mm Electrical impulse that travels towards the electrode produces an upright
- 11. Impulse Conduction & the ECG Sinoatrial node AV node Bundle of His Bundle Branches Purkinje fibers
- 12. The “PQRST” P wave - Atrial depolarization T wave - Ventricular repolarization QRS - Ventricular depolarization
- 13. The PR Interval Atrial depolarization + delay in AV junction (AV node/Bundle of His) (delay allows
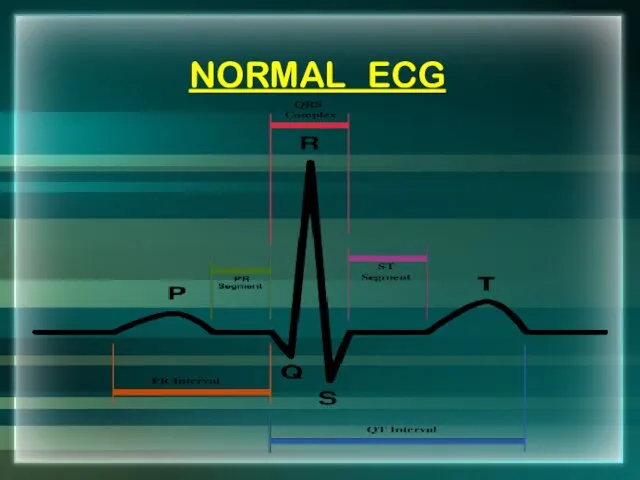
- 14. NORMAL ECG
- 15. The ECG Paper Horizontally One small box - 0.04 s One large box - 0.20 s
- 16. EKG Leads which measure the difference in electrical potential between two points 1. Bipolar Leads: Two
- 17. EKG Leads The standard EKG has 12 leads: 3 Standard Limb Leads 3 Augmented Limb Leads
- 18. Standard Limb Leads
- 19. Standard Limb Leads
- 20. Augmented Limb Leads
- 21. All Limb Leads
- 22. Precordial Leads
- 23. Precordial Leads
- 24. Right Sided & Posterior Chest Leads
- 25. Arrangement of Leads on the EKG
- 26. Anatomic Groups (Septum)
- 27. Anatomic Groups (Anterior Wall)
- 28. Anatomic Groups (Lateral Wall)
- 29. Anatomic Groups (Inferior Wall)
- 30. Anatomic Groups (Summary)
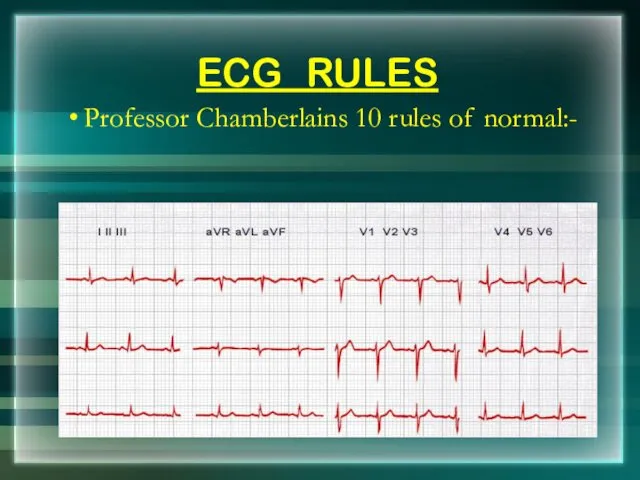
- 31. ECG RULES Professor Chamberlains 10 rules of normal:-
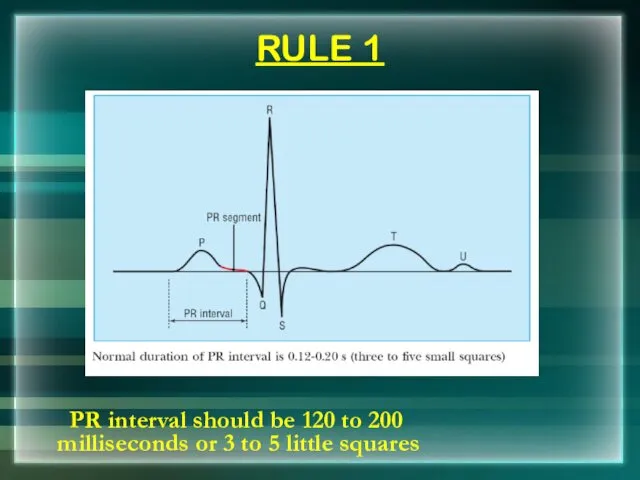
- 32. RULE 1 PR interval should be 120 to 200 milliseconds or 3 to 5 little squares
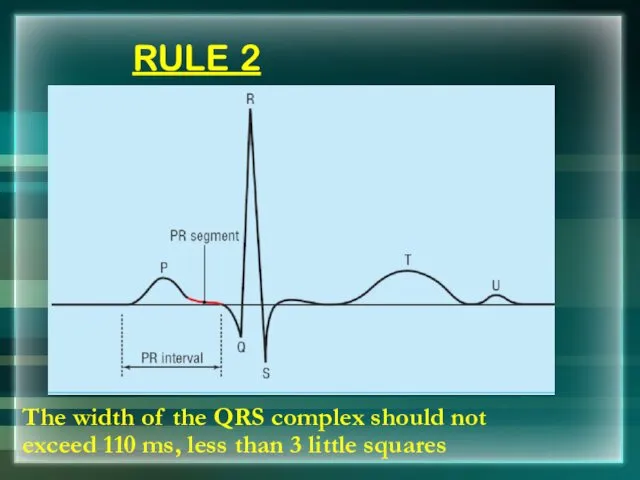
- 33. RULE 2 The width of the QRS complex should not exceed 110 ms, less than 3
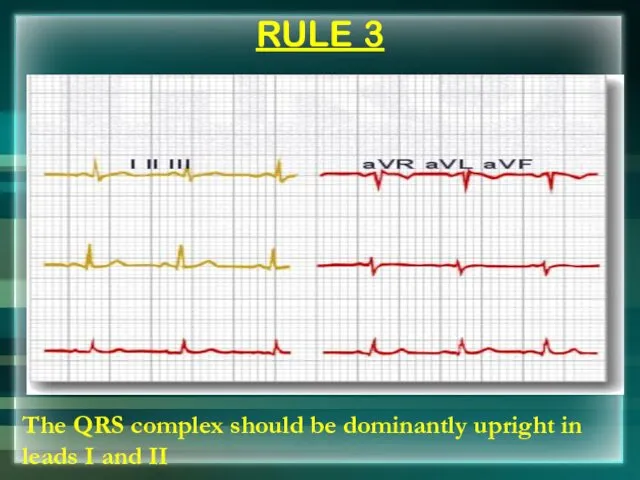
- 34. RULE 3 The QRS complex should be dominantly upright in leads I and II
- 35. RULE 4 QRS and T waves tend to have the same general direction in the limb
- 36. RULE 5 All waves are negative in lead aVR
- 37. RULE 6 The R wave must grow from V1 to at least V4 The S wave
- 38. RULE 7 The ST segment should start isoelectric except in V1 and V2 where it may
- 39. RULE 8 The P waves should be upright in I, II, and V2 to V6
- 40. RULE 9 There should be no Q wave or only a small q less than 0.04
- 41. RULE 10 The T wave must be upright in I, II, V2 to V6
- 42. P wave Always positive in lead I and II Always negative in lead aVR Commonly biphasic
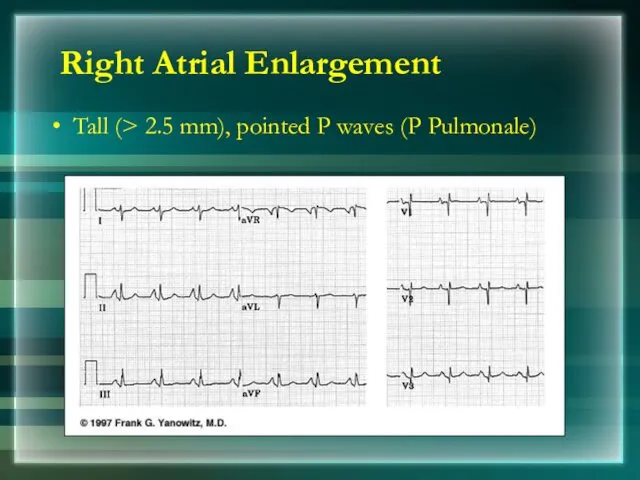
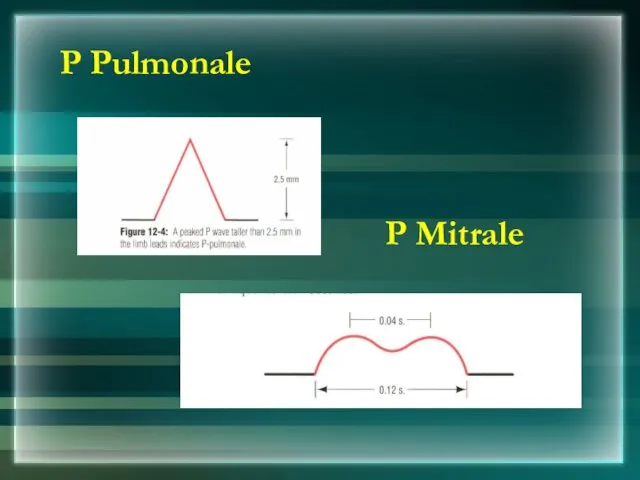
- 43. Right Atrial Enlargement Tall (> 2.5 mm), pointed P waves (P Pulmonale)
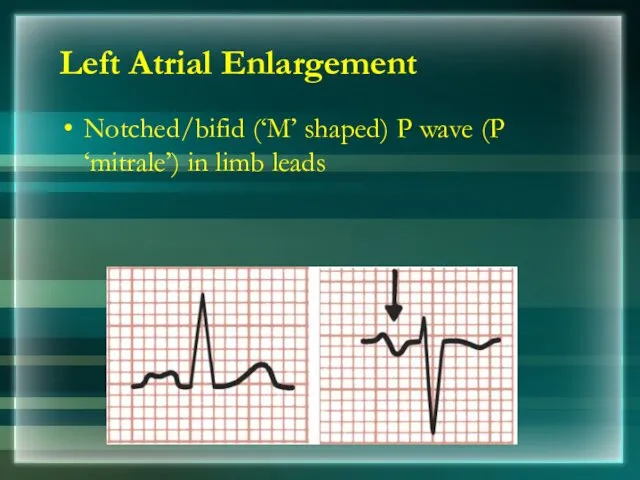
- 44. Notched/bifid (‘M’ shaped) P wave (P ‘mitrale’) in limb leads Left Atrial Enlargement
- 45. P Pulmonale P Mitrale
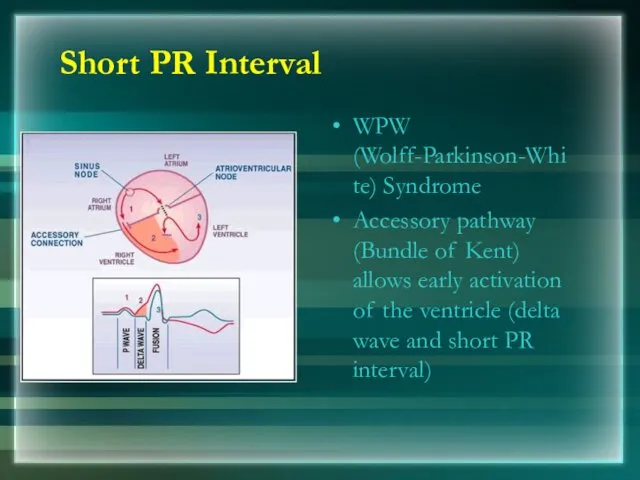
- 46. Short PR Interval WPW (Wolff-Parkinson-White) Syndrome Accessory pathway (Bundle of Kent) allows early activation of the
- 47. Long PR Interval First degree Heart Block
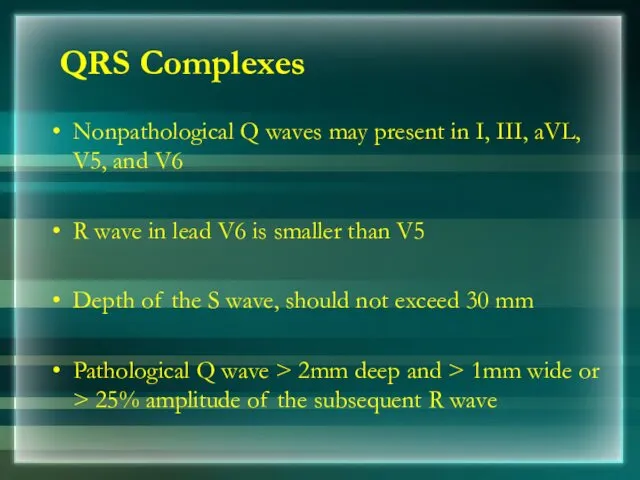
- 48. QRS Complexes Nonpathological Q waves may present in I, III, aVL, V5, and V6 R wave
- 49. QRS in LVH & RVH
- 50. Conditions with Tall R in V1
- 51. Right Atrial and Ventricular Hypertrophy
- 52. Left Ventricular Hypertrophy Sokolow & Lyon Criteria S in V1+ R in V5 or V6 >
- 54. ST Segment ST Segment is flat (isoelectric) Elevation or depression of ST segment by 1 mm
- 55. Variable Shapes Of ST Segment Elevations in AMI Goldberger AL. Goldberger: Clinical Electrocardiography: A Simplified Approach.
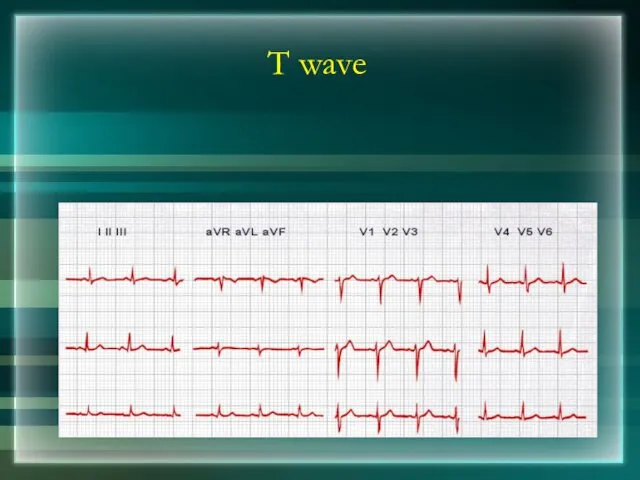
- 56. T wave Normal T wave is asymmetrical, first half having a gradual slope than the second
- 57. T wave
- 58. QT interval Total duration of Depolarization and Repolarization QT interval decreases when heart rate increases For
- 59. QT Interval
- 60. U wave U wave related to afterdepolarizations which follow repolarization U waves are small, round, symmetrical
- 61. Determining the Heart Rate Rule of 300/1500 10 Second Rule
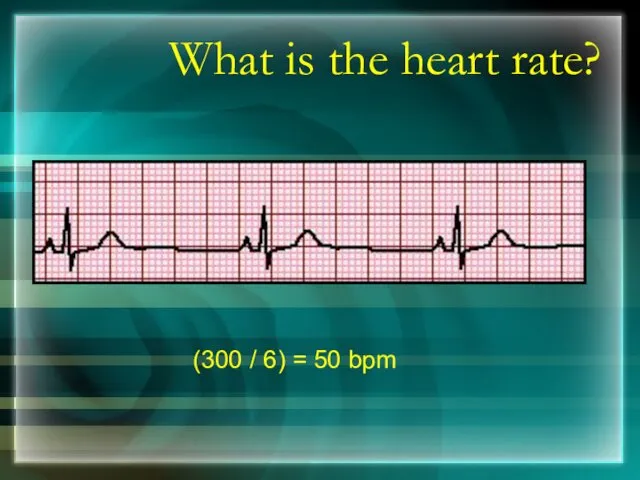
- 62. Rule of 300 Count the number of “big boxes” between two QRS complexes, and divide this
- 63. What is the heart rate? (300 / 6) = 50 bpm
- 64. What is the heart rate? (300 / ~ 4) = ~ 75 bpm
- 65. What is the heart rate? (300 / 1.5) = 200 bpm
- 66. The Rule of 300 It may be easiest to memorize the following table:
- 67. 10 Second Rule EKGs record 10 seconds of rhythm per page, Count the number of beats
- 68. What is the heart rate? 33 x 6 = 198 bpm
- 69. Calculation of Heart Rate
- 70. Question Calculate the heart rate
- 71. The QRS Axis The QRS axis represents overall direction of the heart’s electrical activity. Abnormalities hint
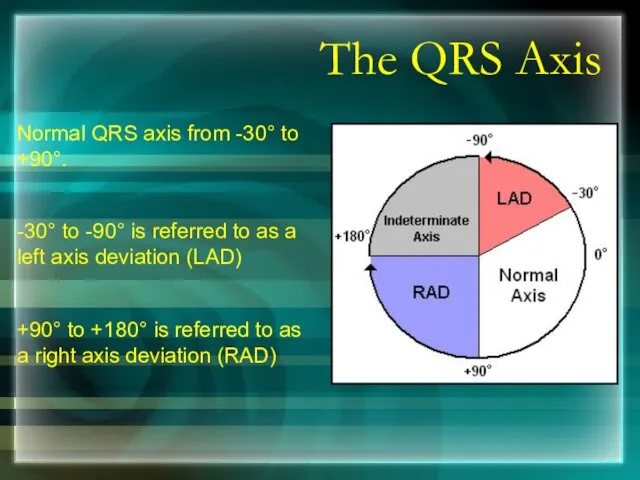
- 72. The QRS Axis Normal QRS axis from -30° to +90°. -30° to -90° is referred to
- 73. Determining the Axis The Quadrant Approach The Equiphasic Approach
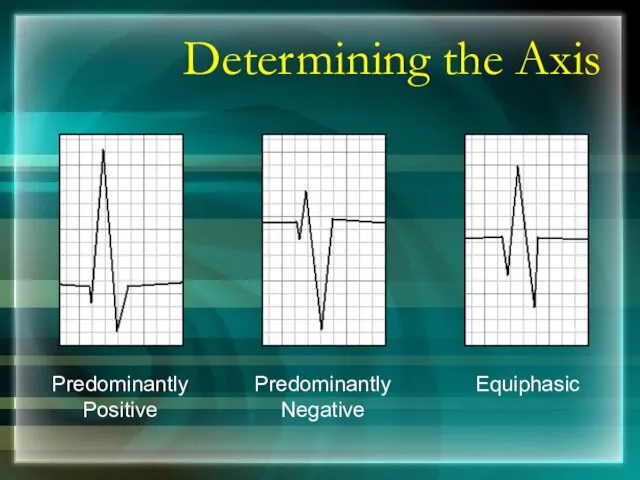
- 74. Determining the Axis Predominantly Positive Predominantly Negative Equiphasic
- 75. The Quadrant Approach QRS complex in leads I and aVF determine if they are predominantly positive
- 76. The Quadrant Approach When LAD is present, If the QRS in II is positive, the LAD
- 77. Quadrant Approach: Example 1 Negative in I, positive in aVF ? RAD
- 78. Quadrant Approach: Example 2 Positive in I, negative in aVF ? Predominantly positive in II ?
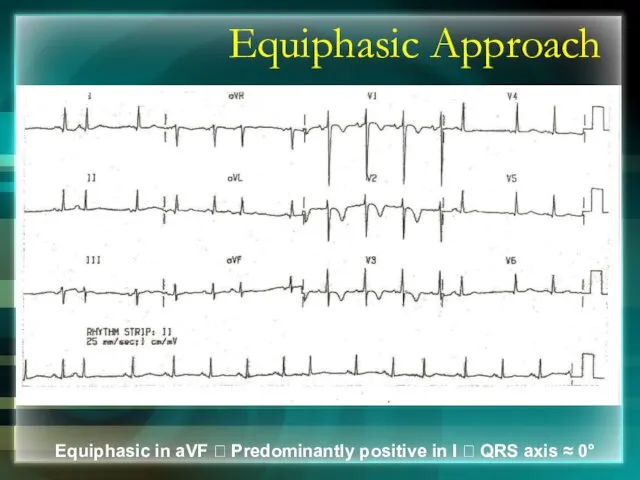
- 79. The Equiphasic Approach 1. Most equiphasic QRS complex. 2. Identified Lead lies 90° away from the
- 80. QRS Axis = -30 degrees
- 81. QRS Axis = +90 degrees-KH
- 83. Equiphasic Approach Equiphasic in aVF ? Predominantly positive in I ? QRS axis ≈ 0°
- 84. Thank You
- 85. BRADYARRYTHMIA Dr Subroto Mandal, MD, DM, DC Associate Professor, Cardiology
- 86. Classification Sinus Bradycardia Junctional Rhythm Sino Atrial Block Atrioventricular block
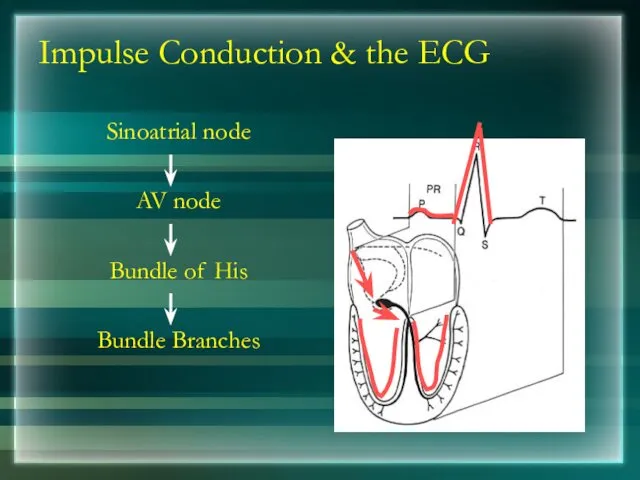
- 87. Impulse Conduction & the ECG Sinoatrial node AV node Bundle of His Bundle Branches
- 88. Sinus Bradycardia
- 89. Junctional Rhythm
- 90. SA Block Sinus impulses is blocked within the SA junction Between SA node and surrounding myocardium
- 91. AV Block First Degree AV Block Second Degree AV Block Third Degree AV Block
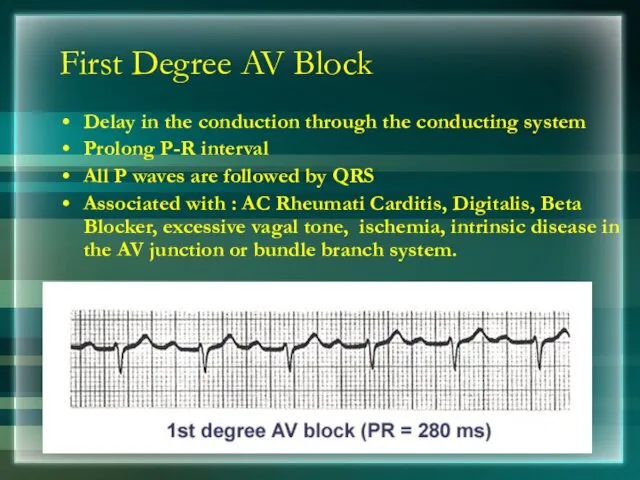
- 92. First Degree AV Block Delay in the conduction through the conducting system Prolong P-R interval All
- 93. Second Degree AV Block Intermittent failure of AV conduction Impulse blocked by AV node Types: Mobitz
- 94. The 3 rules of "classic AV Wenckebach" Decreasing RR intervals until pause; 2. Pause is less
- 95. Mobitz type 1 (Wenckebach Phenomenon)
- 96. Mobitz type 2 Usually a sign of bilateral bundle branch disease. One of the branches should
- 97. Third Degree Heart Block CHB evidenced by the AV dissociation A junctional escape rhythm at 45
- 98. Third Degree Heart Block 3rd degree AV block with a left ventricular escape rhythm, 'B' the
- 99. The nonconducted PAC's set up a long pause which is terminated by ventricular escapes; Wider QRS
- 100. AV Dissociation Due to Accelerated ventricular rhythm
- 101. Thank You
- 102. Putting it all Together Do you think this person is having a myocardial infarction. If so,
- 103. Interpretation Yes, this person is having an acute anterior wall myocardial infarction.
- 104. Putting it all Together Now, where do you think this person is having a myocardial infarction?
- 105. Inferior Wall MI This is an inferior MI. Note the ST elevation in leads II, III
- 106. Putting it all Together How about now?
- 107. Anterolateral MI This person’s MI involves both the anterior wall (V2-V4) and the lateral wall (V5-V6,
- 108. Rhythm #6 70 bpm Rate? Regularity? regular flutter waves 0.06 s P waves? PR interval? none
- 109. Rhythm #7 74 ?148 bpm Rate? Regularity? Regular ? regular Normal ? none 0.08 s P
- 110. PSVT Deviation from NSR The heart rate suddenly speeds up, often triggered by a PAC (not
- 111. Ventricular Arrhythmias Ventricular Tachycardia Ventricular Fibrillation
- 112. Rhythm #8 160 bpm Rate? Regularity? regular none wide (> 0.12 sec) P waves? PR interval?
- 113. Ventricular Tachycardia Deviation from NSR Impulse is originating in the ventricles (no P waves, wide QRS).
- 114. Rhythm #9 none Rate? Regularity? irregularly irreg. none wide, if recognizable P waves? PR interval? none
- 115. Ventricular Fibrillation Deviation from NSR Completely abnormal.
- 116. Arrhythmia Formation Arrhythmias can arise from problems in the: Sinus node Atrial cells AV junction Ventricular
- 117. SA Node Problems The SA Node can: fire too slow fire too fast Sinus Bradycardia Sinus
- 118. Atrial Cell Problems Atrial cells can: fire occasionally from a focus fire continuously due to a
- 119. AV Junctional Problems The AV junction can: fire continuously due to a looping re-entrant circuit block
- 120. Rhythm #1 30 bpm Rate? Regularity? regular normal 0.10 s P waves? PR interval? 0.12 s
- 121. Rhythm #2 130 bpm Rate? Regularity? regular normal 0.08 s P waves? PR interval? 0.16 s
- 122. Rhythm #3 70 bpm Rate? Regularity? occasionally irreg. 2/7 different contour 0.08 s P waves? PR
- 123. Premature Atrial Contractions Deviation from NSR These ectopic beats originate in the atria (but not in
- 124. Rhythm #4 60 bpm Rate? Regularity? occasionally irreg. none for 7th QRS 0.08 s (7th wide)
- 125. Ventricular Conduction Normal Signal moves rapidly through the ventricles Abnormal Signal moves slowly through the ventricles
- 126. AV Nodal Blocks 1st Degree AV Block 2nd Degree AV Block, Type I 2nd Degree AV
- 127. Rhythm #10 60 bpm Rate? Regularity? regular normal 0.08 s P waves? PR interval? 0.36 s
- 128. 1st Degree AV Block Etiology: Prolonged conduction delay in the AV node or Bundle of His.
- 129. Rhythm #11 50 bpm Rate? Regularity? regularly irregular nl, but 4th no QRS 0.08 s P
- 130. Rhythm #12 40 bpm Rate? Regularity? regular nl, 2 of 3 no QRS 0.08 s P
- 131. 2nd Degree AV Block, Type II Deviation from NSR Occasional P waves are completely blocked (P
- 132. Rhythm #13 40 bpm Rate? Regularity? regular no relation to QRS wide (> 0.12 s) P
- 133. 3rd Degree AV Block Deviation from NSR The P waves are completely blocked in the AV
- 134. Supraventricular Arrhythmias Atrial Fibrillation Atrial Flutter Paroxysmal Supraventricular Tachycardia
- 135. Rhythm #5 100 bpm Rate? Regularity? irregularly irregular none 0.06 s P waves? PR interval? none
- 136. Atrial Fibrillation Deviation from NSR No organized atrial depolarization, so no normal P waves (impulses are
- 137. Rhythm #6 70 bpm Rate? Regularity? regular flutter waves 0.06 s P waves? PR interval? none
- 138. Rhythm #7 74 ?148 bpm Rate? Regularity? Regular ? regular Normal ? none 0.08 s P
- 139. PSVT Deviation from NSR The heart rate suddenly speeds up, often triggered by a PAC (not
- 140. Ventricular Arrhythmias Ventricular Tachycardia Ventricular Fibrillation
- 141. Rhythm #8 160 bpm Rate? Regularity? regular none wide (> 0.12 sec) P waves? PR interval?
- 142. Ventricular Tachycardia Deviation from NSR Impulse is originating in the ventricles (no P waves, wide QRS).
- 143. Rhythm #9 none Rate? Regularity? irregularly irreg. none wide, if recognizable P waves? PR interval? none
- 144. Ventricular Fibrillation Deviation from NSR Completely abnormal.
- 145. Diagnosing a MI To diagnose a myocardial infarction you need to go beyond looking at a
- 146. Views of the Heart Some leads get a good view of the: Anterior portion of the
- 147. ST Elevation One way to diagnose an acute MI is to look for elevation of the
- 148. ST Elevation (cont) Elevation of the ST segment (greater than 1 small box) in 2 leads
- 149. Anterior View of the Heart The anterior portion of the heart is best viewed using leads
- 150. Anterior Myocardial Infarction If you see changes in leads V1 - V4 that are consistent with
- 151. Putting it all Together Do you think this person is having a myocardial infarction. If so,
- 152. Interpretation Yes, this person is having an acute anterior wall myocardial infarction.
- 153. Other MI Locations Now that you know where to look for an anterior wall myocardial infarction
- 154. Other MI Locations First, take a look again at this picture of the heart.
- 155. Other MI Locations Second, remember that the 12-leads of the ECG look at different portions of
- 156. Other MI Locations Now, using these 3 diagrams let’s figure where to look for a lateral
- 157. Anterior MI Remember the anterior portion of the heart is best viewed using leads V1- V4.
- 158. Lateral MI So what leads do you think the lateral portion of the heart is best
- 159. Inferior MI Now how about the inferior portion of the heart? Limb Leads Augmented Leads Precordial
- 160. Putting it all Together Now, where do you think this person is having a myocardial infarction?
- 161. Inferior Wall MI This is an inferior MI. Note the ST elevation in leads II, III
- 162. Putting it all Together How about now?
- 163. Anterolateral MI This person’s MI involves both the anterior wall (V2-V4) and the lateral wall (V5-V6,
- 164. RIGHT ATRIAL ENLARGEMENT
- 165. Right atrial enlargement Take a look at this ECG. What do you notice about the P
- 166. Right atrial enlargement To diagnose RAE you can use the following criteria: II P > 2.5
- 167. Left atrial enlargement Take a look at this ECG. What do you notice about the P
- 168. Left atrial enlargement To diagnose LAE you can use the following criteria: II > 0.04 s
- 169. Left Ventricular Hypertrophy
- 170. Left Ventricular Hypertrophy Compare these two 12-lead ECGs. What stands out as different with the second
- 171. Left Ventricular Hypertrophy Criteria exists to diagnose LVH using a 12-lead ECG. For example: The R
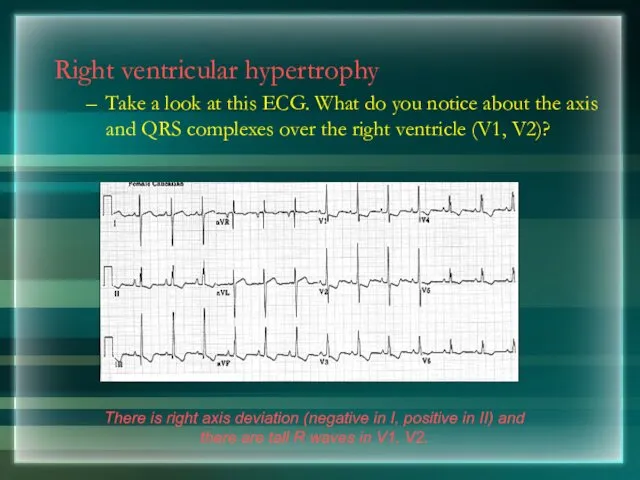
- 172. Right ventricular hypertrophy Take a look at this ECG. What do you notice about the axis
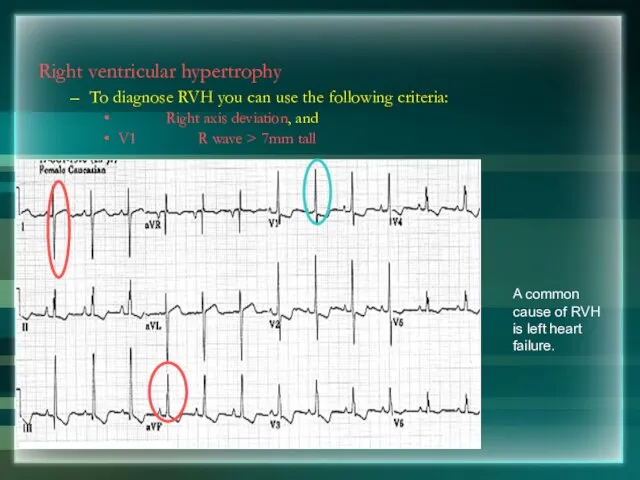
- 173. Right ventricular hypertrophy To diagnose RVH you can use the following criteria: Right axis deviation, and
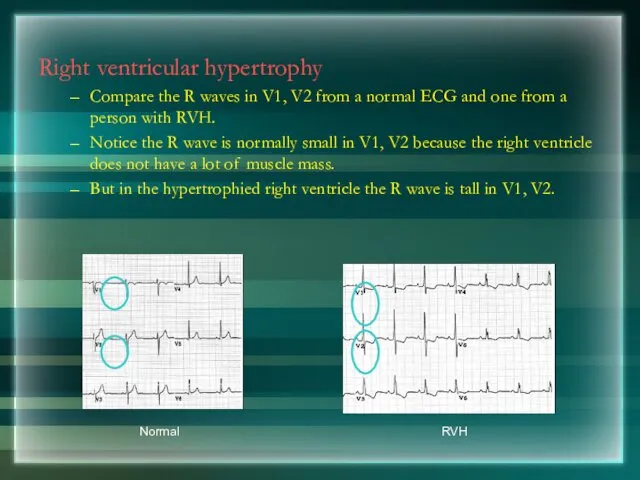
- 174. Right ventricular hypertrophy Compare the R waves in V1, V2 from a normal ECG and one
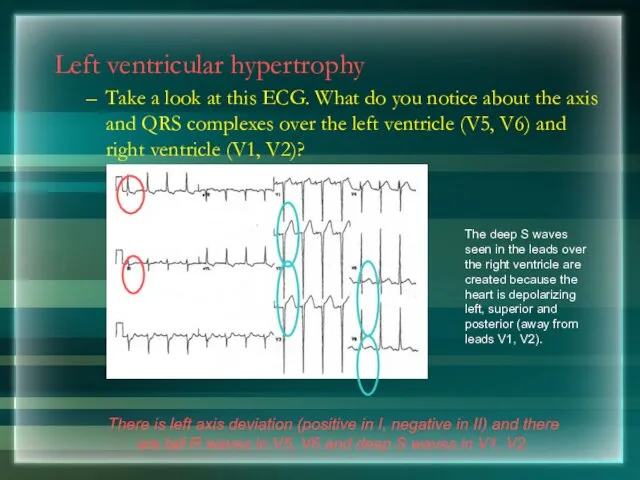
- 175. Left ventricular hypertrophy Take a look at this ECG. What do you notice about the axis
- 176. Left ventricular hypertrophy To diagnose LVH you can use the following criteria*: R in V5 (or
- 177. Bundle Branch Blocks
- 178. Normal Impulse Conduction Sinoatrial node AV node Bundle of His Bundle Branches Purkinje fibers
- 179. Bundle Branch Blocks So, conduction in the Bundle Branches and Purkinje fibers are seen as the
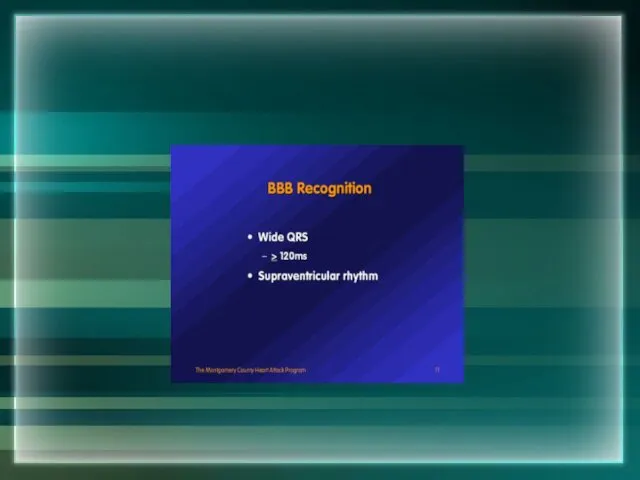
- 180. Bundle Branch Blocks With Bundle Branch Blocks you will see two changes on the ECG. QRS
- 182. Right Bundle Branch Blocks What QRS morphology is characteristic?
- 183. RBBB
- 185. Left Bundle Branch Blocks What QRS morphology is characteristic? Normal
- 191. HYPERKALEMIA
- 192. HYPERKALEMIA
- 194. SEVERE HYPERKALEMIA
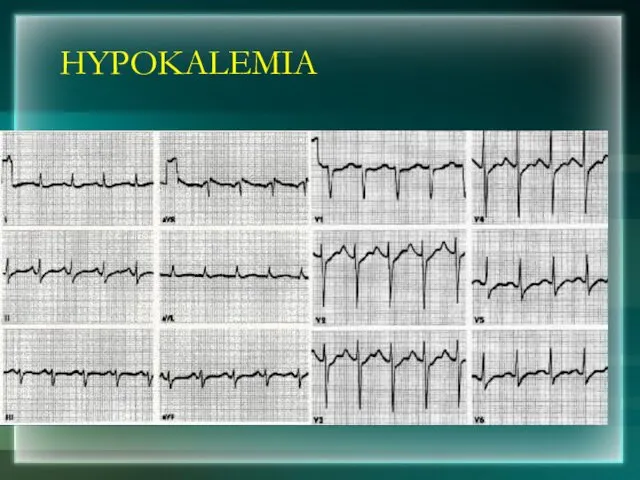
- 195. HYPOKALEMIA
- 196. HYPOKALEMIA
- 197. HYPOKALEMIA
- 198. HYPERCALCEMIA
- 199. HYPOCALCEMIA
- 201. ACUTE PERICARDITIS
- 202. ACUTE PERICARDITIS
- 203. CARDIAC TAMPONADE
- 204. PERICARDIAL EFFUSION-Electrical alterans
- 205. HYPOTHERMIA-OSBORNE WAVE
- 207. Скачать презентацию
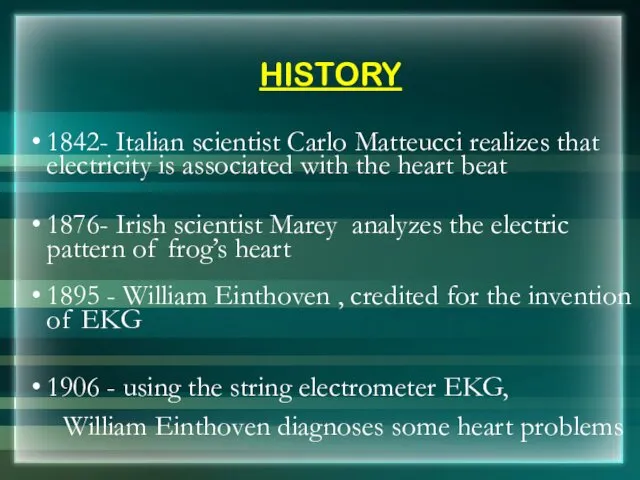
HISTORY
1842- Italian scientist Carlo Matteucci realizes that electricity is associated with
HISTORY
1842- Italian scientist Carlo Matteucci realizes that electricity is associated with
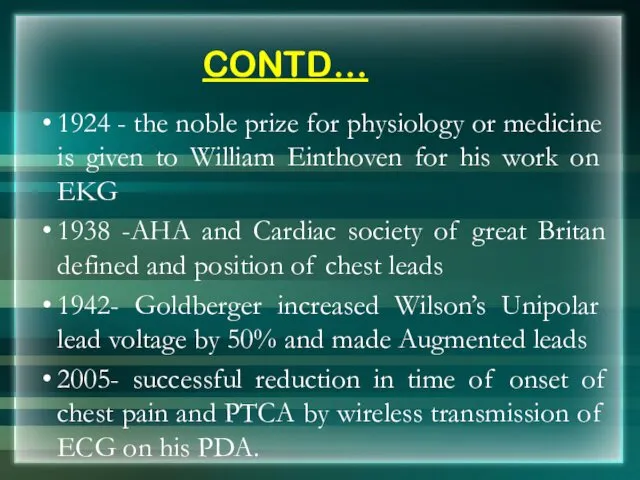
CONTD…
1924 - the noble prize for physiology or medicine is given
CONTD…
1924 - the noble prize for physiology or medicine is given
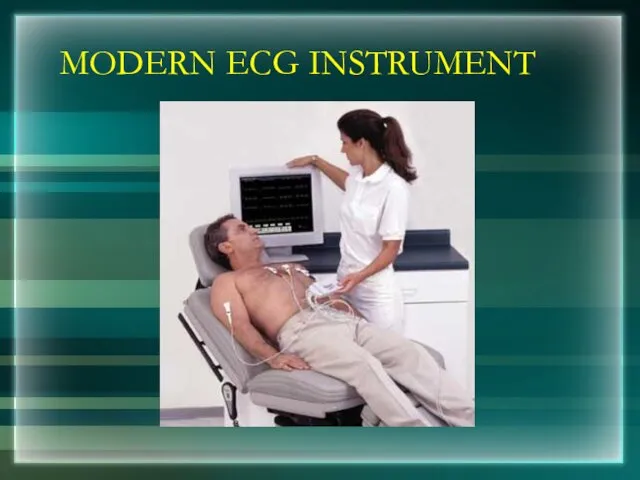
MODERN ECG INSTRUMENT
MODERN ECG INSTRUMENT
What is an EKG?
The electrocardiogram (EKG) is a representation of the
What is an EKG?
The electrocardiogram (EKG) is a representation of the
With EKGs we can identify
Arrhythmias
Myocardial ischemia and infarction
Pericarditis
Chamber hypertrophy
Electrolyte disturbances (i.e.
With EKGs we can identify
Arrhythmias
Myocardial ischemia and infarction
Pericarditis
Chamber hypertrophy
Electrolyte disturbances (i.e.
Depolarization
Contraction of any muscle is associated with electrical changes called
Depolarization
Contraction of any muscle is associated with electrical changes called
Pacemakers of the Heart
SA Node - Dominant pacemaker with an intrinsic
Pacemakers of the Heart
SA Node - Dominant pacemaker with an intrinsic
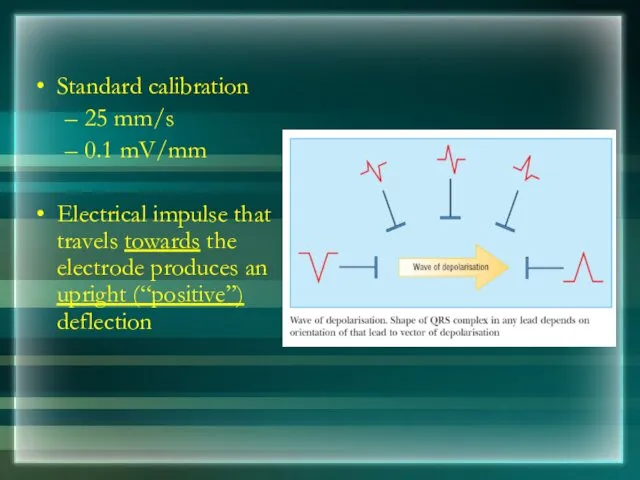
Standard calibration
25 mm/s
0.1 mV/mm
Electrical impulse that travels towards the electrode produces
Standard calibration
25 mm/s
0.1 mV/mm
Electrical impulse that travels towards the electrode produces
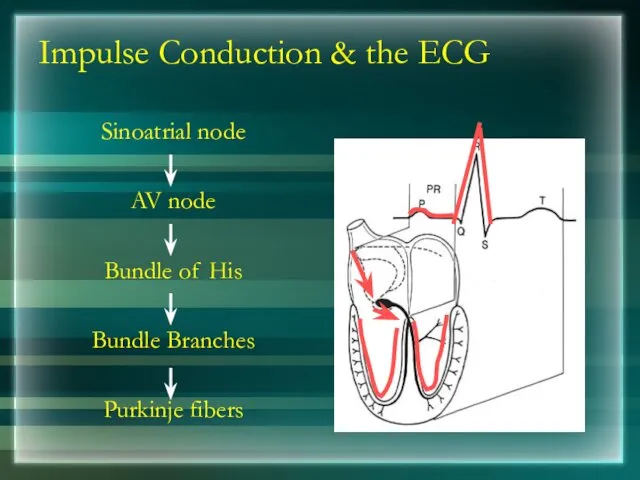
Impulse Conduction & the ECG
Sinoatrial node
AV node
Bundle of His
Bundle Branches
Purkinje fibers
Impulse Conduction & the ECG
Sinoatrial node
AV node
Bundle of His
Bundle Branches
Purkinje fibers
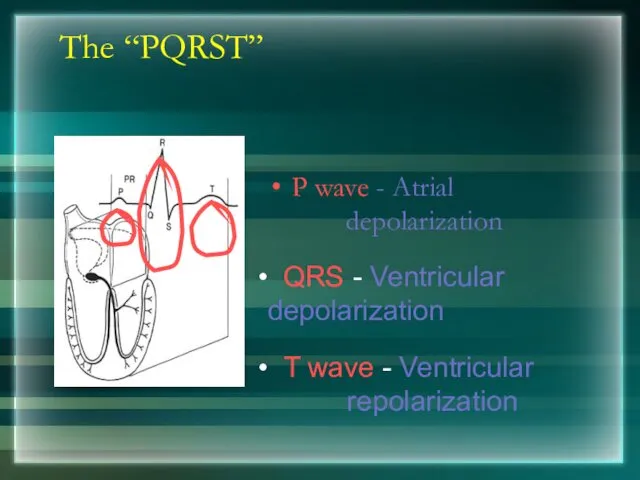
The “PQRST”
P wave - Atrial depolarization
T wave - Ventricular repolarization
The “PQRST”
P wave - Atrial depolarization
T wave - Ventricular repolarization
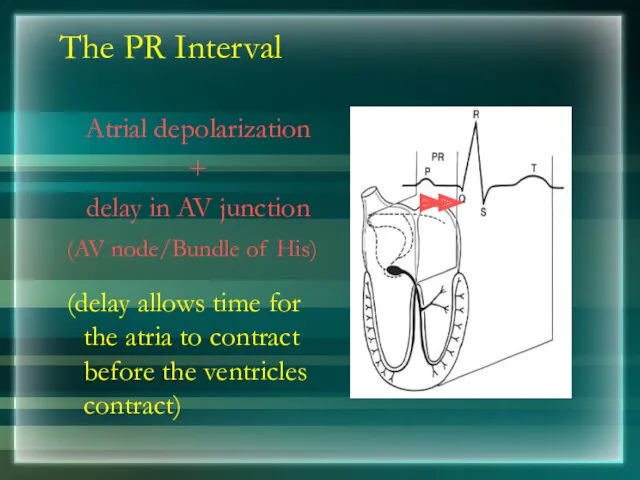
The PR Interval
Atrial depolarization
+
delay in AV junction
(AV node/Bundle of
The PR Interval
Atrial depolarization
+
delay in AV junction
(AV node/Bundle of
NORMAL ECG
NORMAL ECG
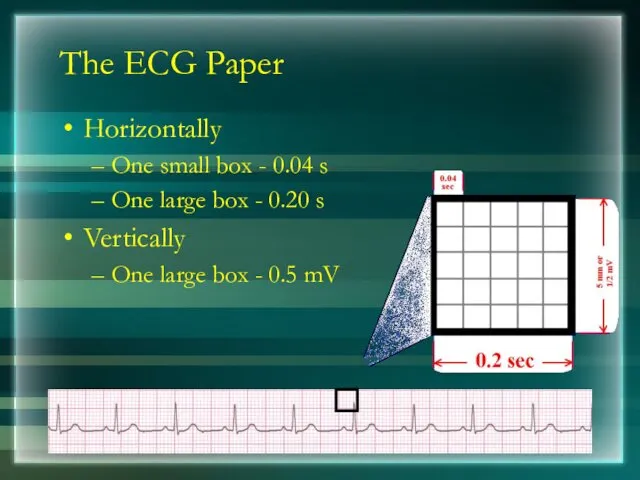
The ECG Paper
Horizontally
One small box - 0.04 s
One large box -
The ECG Paper
Horizontally
One small box - 0.04 s
One large box -
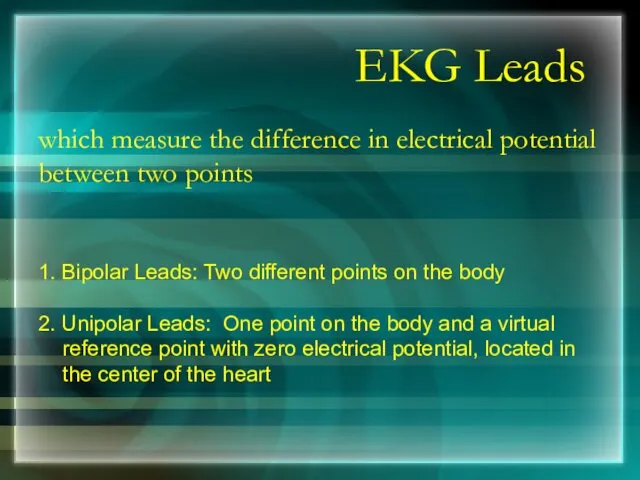
EKG Leads
which measure the difference in electrical potential between two points
1.
EKG Leads
which measure the difference in electrical potential between two points
1.
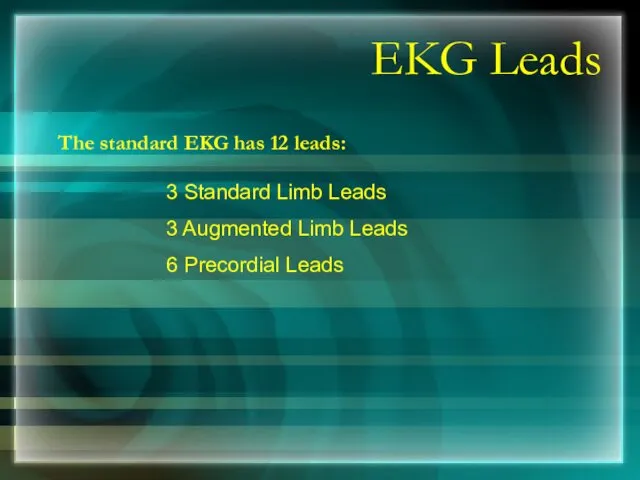
EKG Leads
The standard EKG has 12 leads:
3 Standard Limb Leads
3 Augmented
EKG Leads
The standard EKG has 12 leads:
3 Standard Limb Leads
3 Augmented
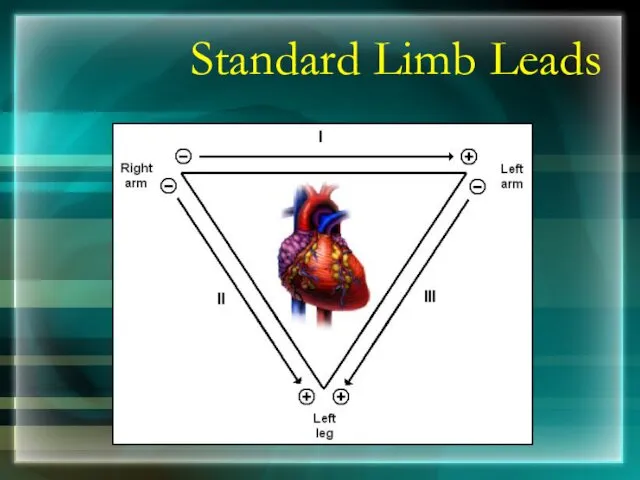
Standard Limb Leads
Standard Limb Leads
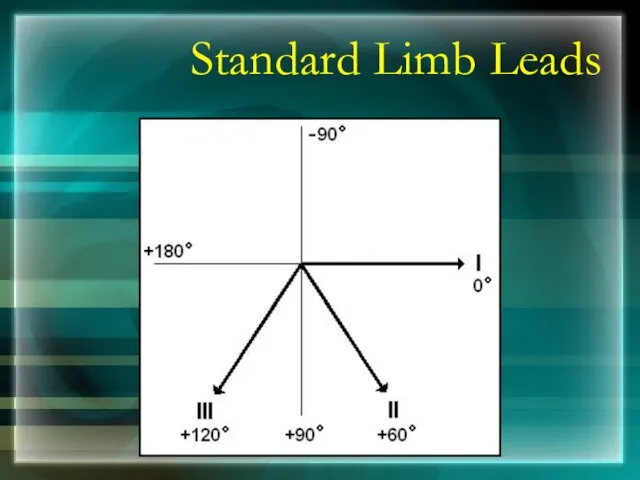
Standard Limb Leads
Standard Limb Leads
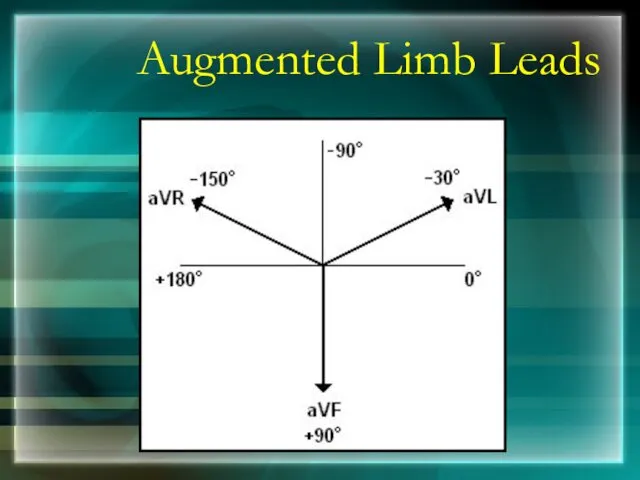
Augmented Limb Leads
Augmented Limb Leads
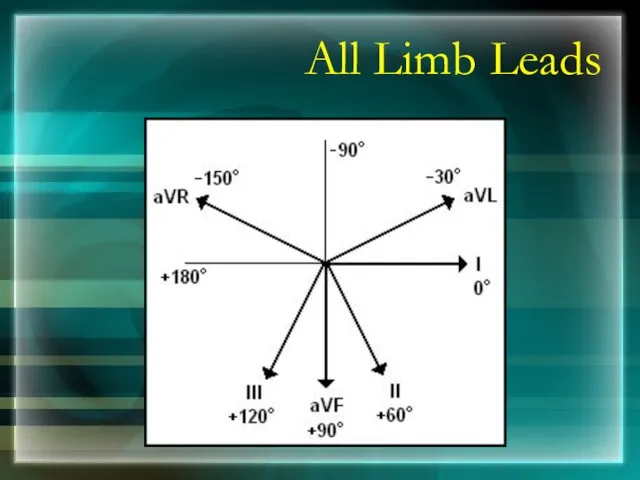
All Limb Leads
All Limb Leads
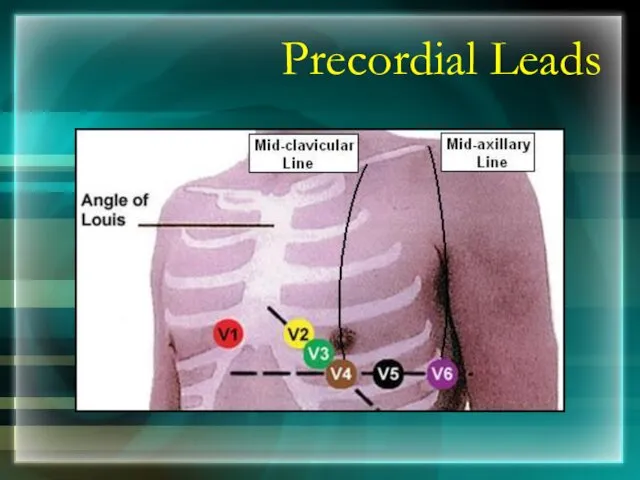
Precordial Leads
Precordial Leads
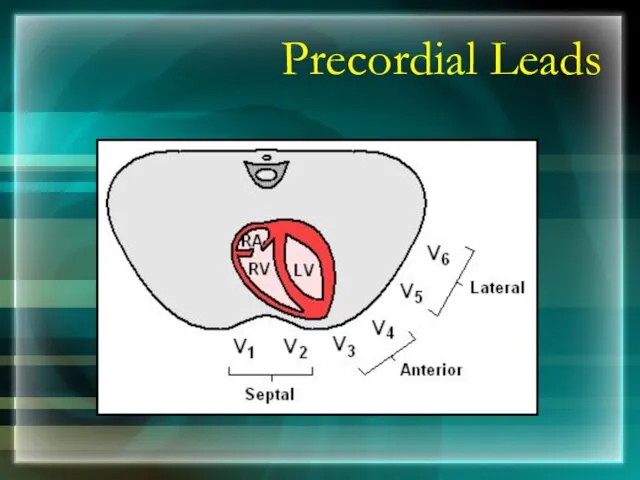
Precordial Leads
Precordial Leads
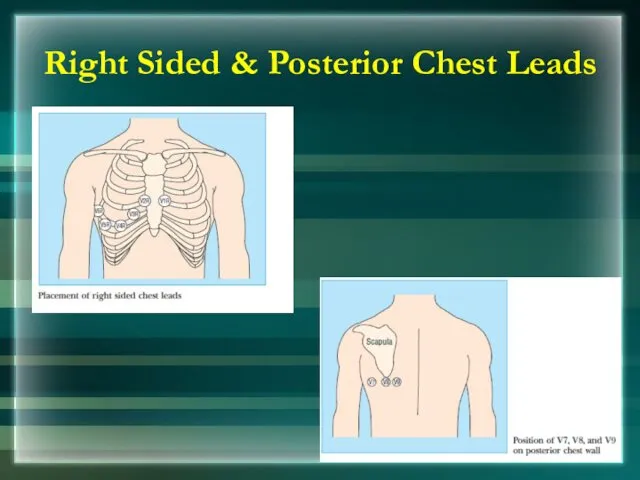
Right Sided & Posterior Chest Leads
Right Sided & Posterior Chest Leads
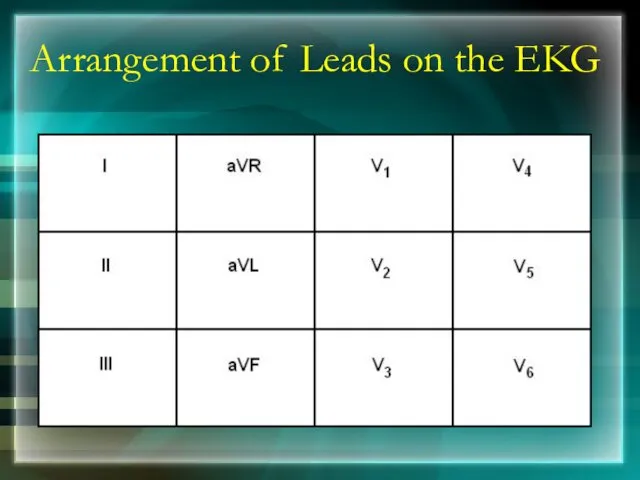
Arrangement of Leads on the EKG
Arrangement of Leads on the EKG
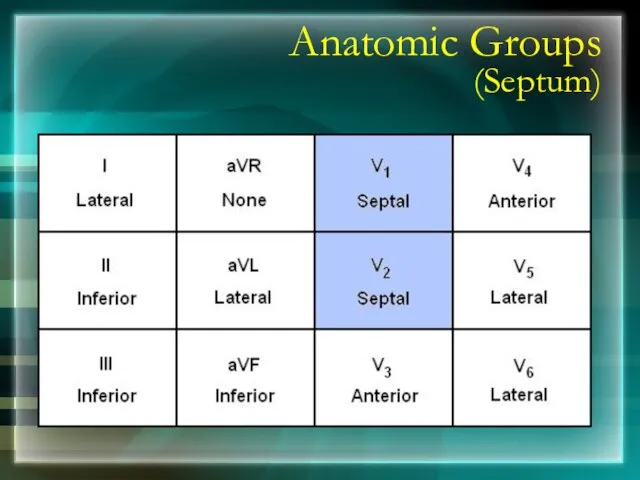
Anatomic Groups
(Septum)
Anatomic Groups
(Septum)
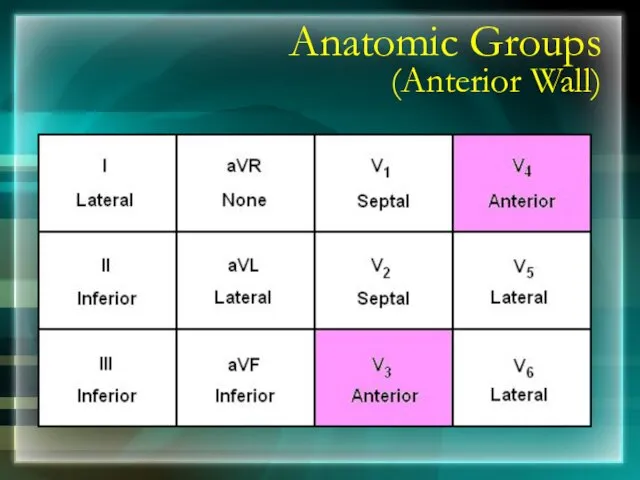
Anatomic Groups
(Anterior Wall)
Anatomic Groups
(Anterior Wall)

Anatomic Groups
(Lateral Wall)
Anatomic Groups
(Lateral Wall)
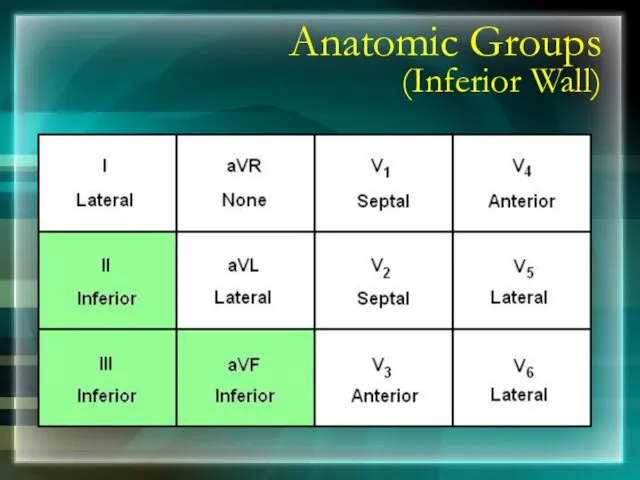
Anatomic Groups
(Inferior Wall)
Anatomic Groups
(Inferior Wall)
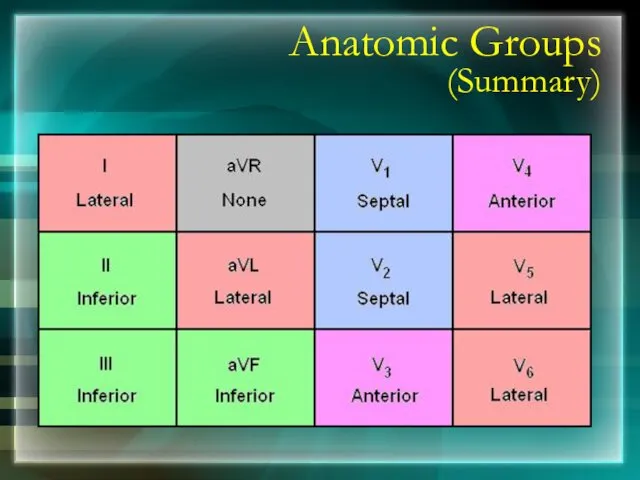
Anatomic Groups
(Summary)
Anatomic Groups
(Summary)
ECG RULES
Professor Chamberlains 10 rules of normal:-
ECG RULES
Professor Chamberlains 10 rules of normal:-
RULE 1
PR interval should be 120 to 200 milliseconds or
RULE 1
PR interval should be 120 to 200 milliseconds or
RULE 2
The width of the QRS complex should not exceed
RULE 2
The width of the QRS complex should not exceed
RULE 3
The QRS complex should be dominantly upright in leads
RULE 3
The QRS complex should be dominantly upright in leads
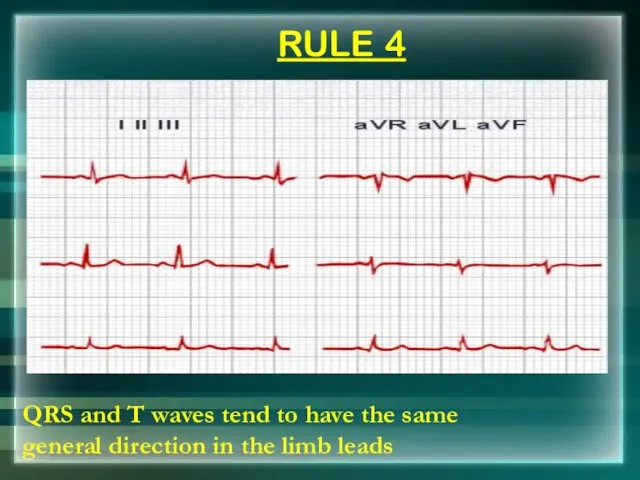
RULE 4
QRS and T waves tend to have the same
RULE 4
QRS and T waves tend to have the same
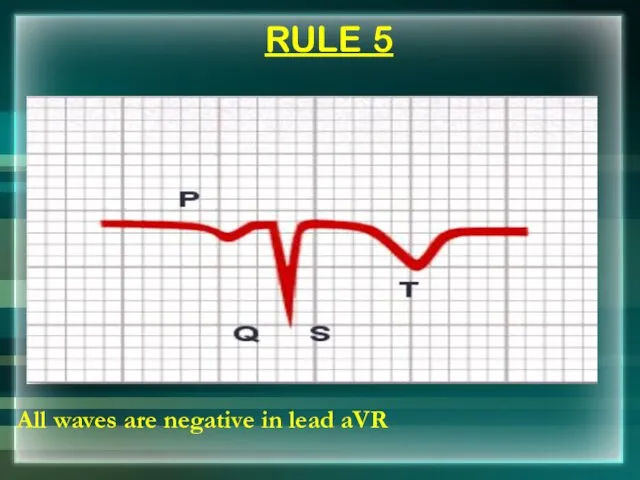
RULE 5
All waves are negative in lead aVR
RULE 5
All waves are negative in lead aVR
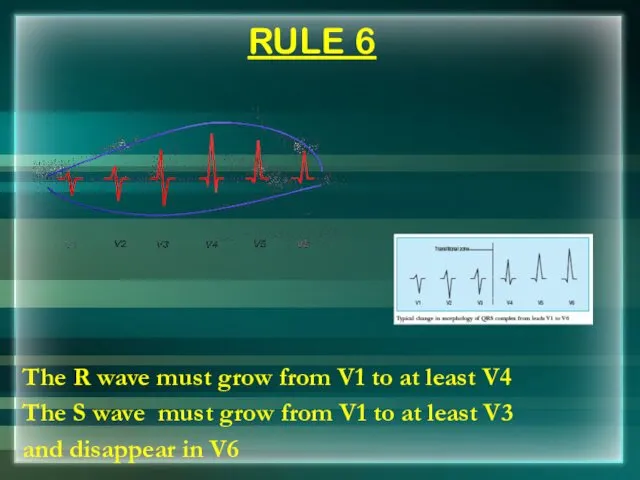
RULE 6
The R wave must grow from V1 to at least
RULE 6
The R wave must grow from V1 to at least
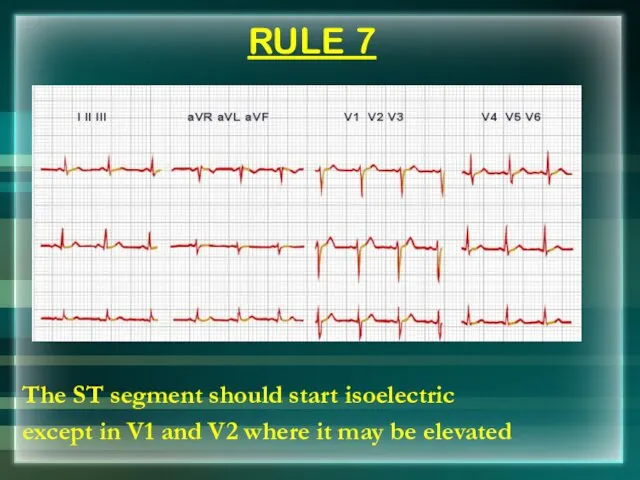
RULE 7
The ST segment should start isoelectric
except in V1 and
RULE 7
The ST segment should start isoelectric
except in V1 and
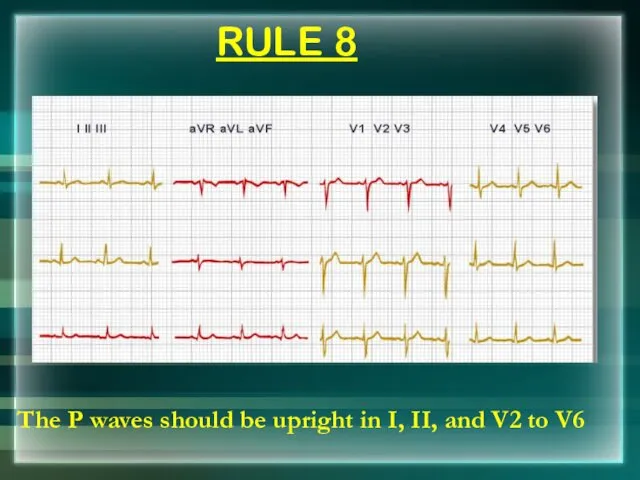
RULE 8
The P waves should be upright in I, II, and
RULE 8
The P waves should be upright in I, II, and
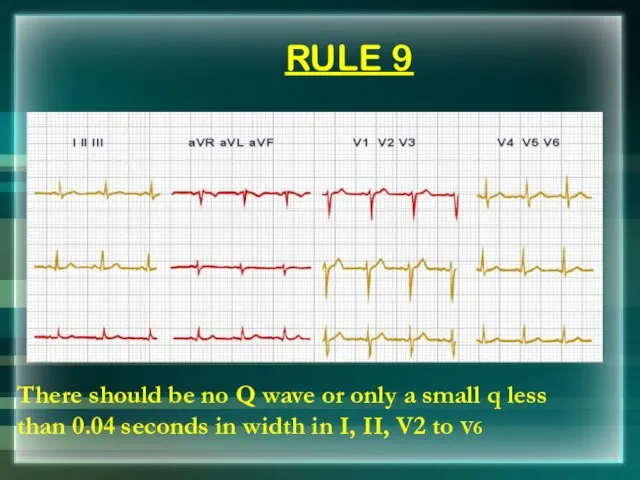
RULE 9
There should be no Q wave or only a small
RULE 9
There should be no Q wave or only a small
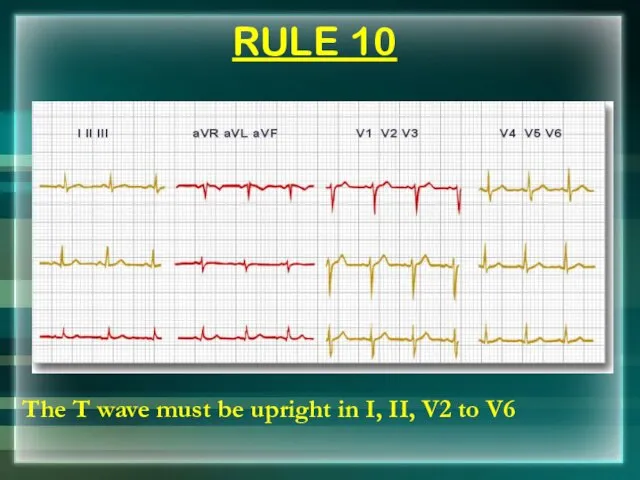
RULE 10
The T wave must be upright in I, II, V2
RULE 10
The T wave must be upright in I, II, V2
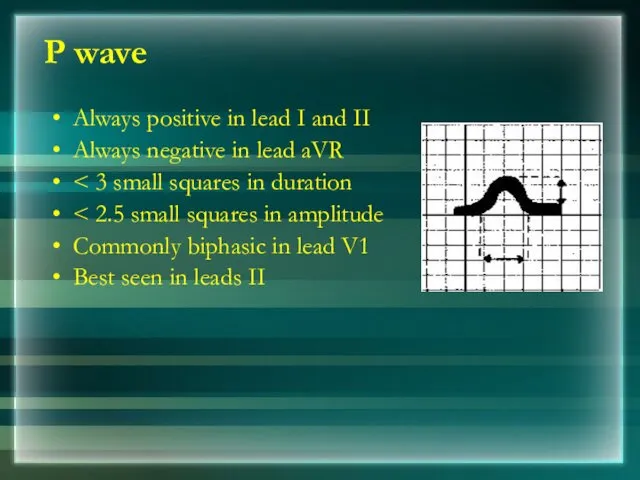
P wave
Always positive in lead I and II
Always negative in
P wave
Always positive in lead I and II
Always negative in
Right Atrial Enlargement
Tall (> 2.5 mm), pointed P waves (P Pulmonale)
Right Atrial Enlargement
Tall (> 2.5 mm), pointed P waves (P Pulmonale)
Notched/bifid (‘M’ shaped) P wave (P ‘mitrale’) in limb leads
Left Atrial
Notched/bifid (‘M’ shaped) P wave (P ‘mitrale’) in limb leads
Left Atrial
P Pulmonale
P Mitrale
P Pulmonale
P Mitrale
Short PR Interval
WPW (Wolff-Parkinson-White) Syndrome
Accessory pathway (Bundle of Kent) allows early
Short PR Interval
WPW (Wolff-Parkinson-White) Syndrome
Accessory pathway (Bundle of Kent) allows early
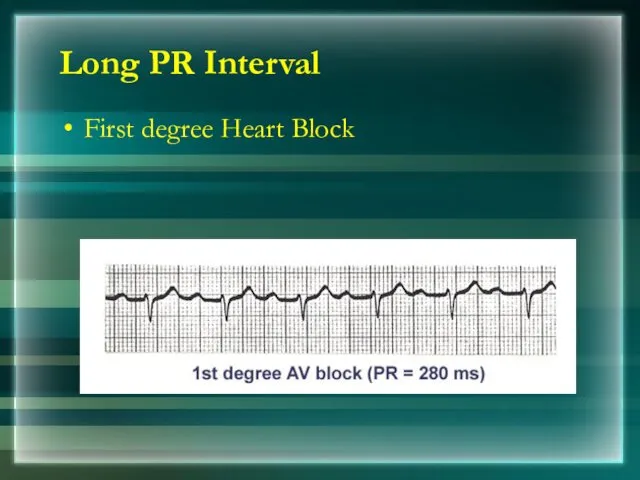
Long PR Interval
First degree Heart Block
Long PR Interval
First degree Heart Block
QRS Complexes
Nonpathological Q waves may present in I, III, aVL, V5,
QRS Complexes
Nonpathological Q waves may present in I, III, aVL, V5,
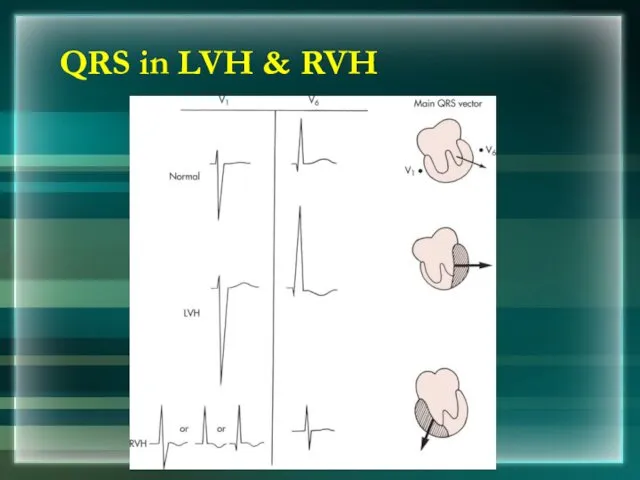
QRS in LVH & RVH
QRS in LVH & RVH
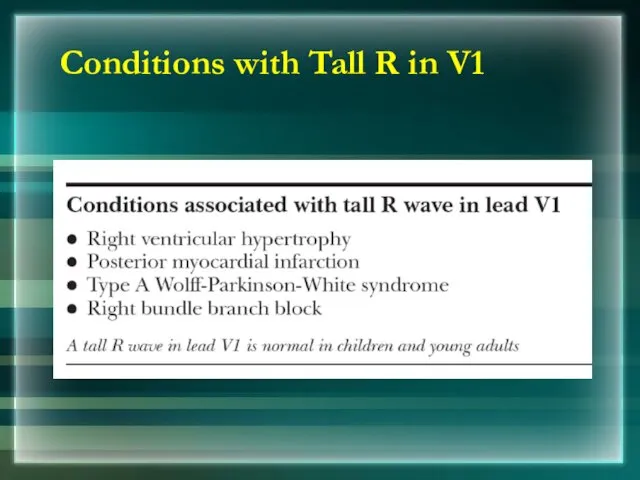
Conditions with Tall R in V1
Conditions with Tall R in V1
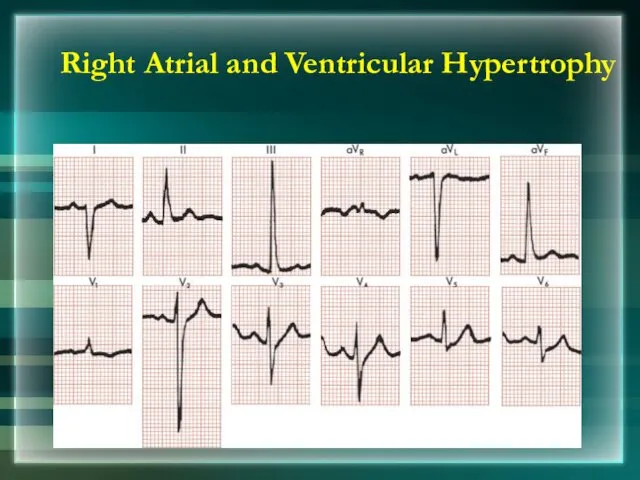
Right Atrial and Ventricular Hypertrophy
Right Atrial and Ventricular Hypertrophy
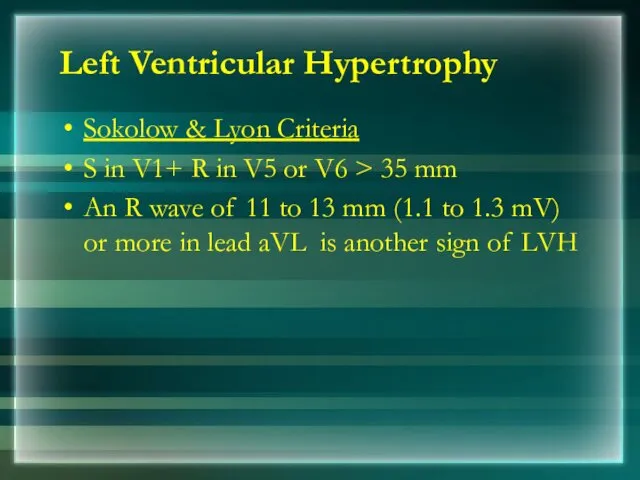
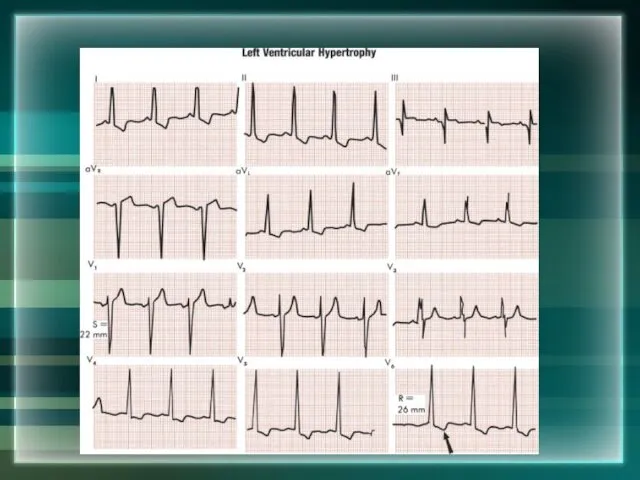
Left Ventricular Hypertrophy
Sokolow & Lyon Criteria
S in V1+ R in
Left Ventricular Hypertrophy
Sokolow & Lyon Criteria
S in V1+ R in
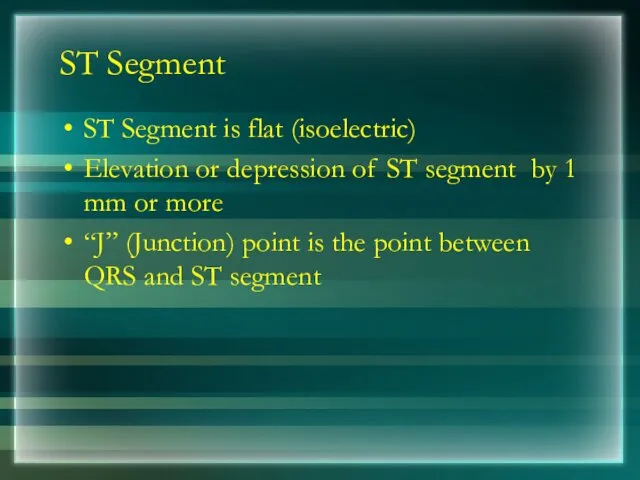
ST Segment
ST Segment is flat (isoelectric)
Elevation or depression of ST segment
ST Segment
ST Segment is flat (isoelectric)
Elevation or depression of ST segment
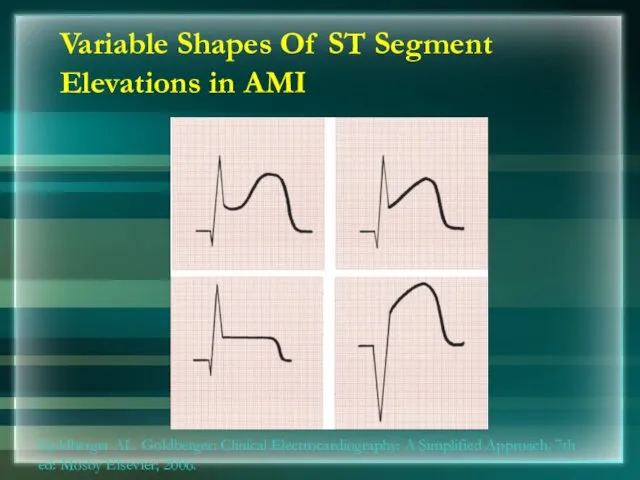
Variable Shapes Of ST Segment Elevations in AMI
Goldberger AL. Goldberger: Clinical
Variable Shapes Of ST Segment Elevations in AMI
Goldberger AL. Goldberger: Clinical
T wave
Normal T wave is asymmetrical, first half having a gradual
T wave
Normal T wave is asymmetrical, first half having a gradual
T wave
T wave
QT interval
Total duration of Depolarization and Repolarization
QT interval decreases when heart
QT interval
Total duration of Depolarization and Repolarization
QT interval decreases when heart
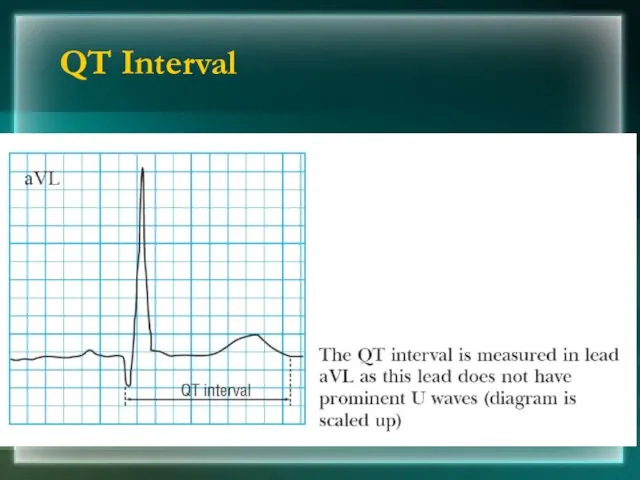
QT Interval
QT Interval
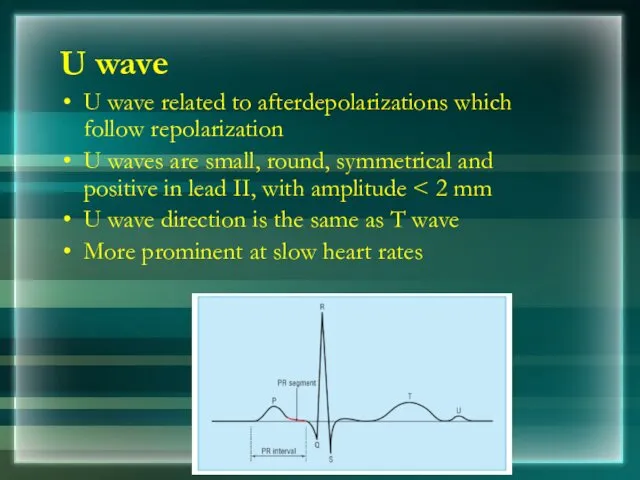
U wave
U wave related to afterdepolarizations which follow repolarization
U waves are
U wave
U wave related to afterdepolarizations which follow repolarization
U waves are
Determining the Heart Rate
Rule of 300/1500
10 Second Rule
Determining the Heart Rate
Rule of 300/1500
10 Second Rule
Rule of 300
Count the number of “big boxes” between two QRS
Rule of 300
Count the number of “big boxes” between two QRS
What is the heart rate?
(300 / 6) = 50 bpm
What is the heart rate?
(300 / 6) = 50 bpm
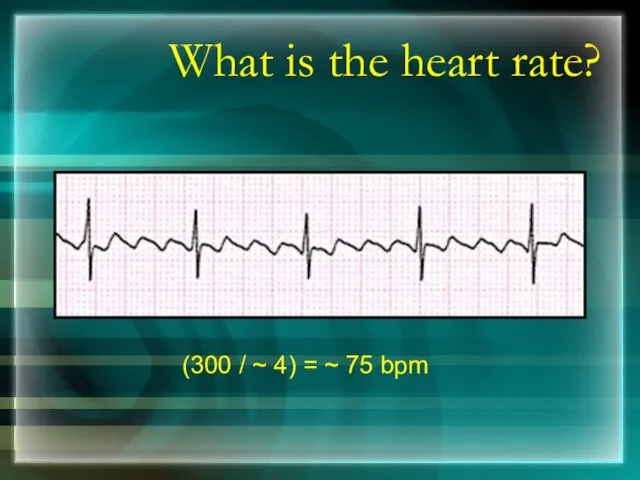
What is the heart rate?
(300 / ~ 4) = ~ 75
What is the heart rate?
(300 / ~ 4) = ~ 75
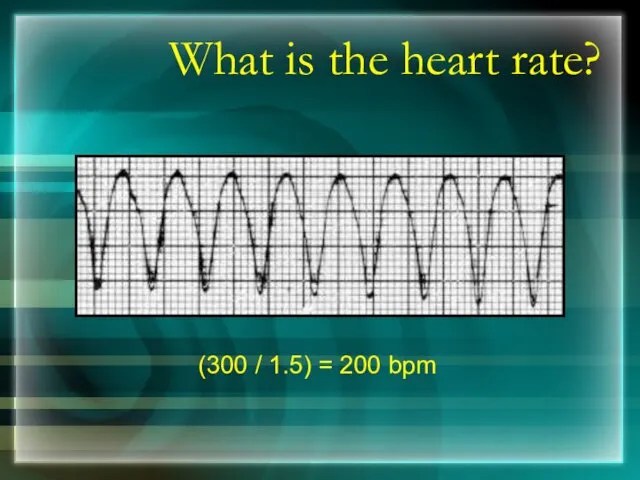
What is the heart rate?
(300 / 1.5) = 200 bpm
What is the heart rate?
(300 / 1.5) = 200 bpm
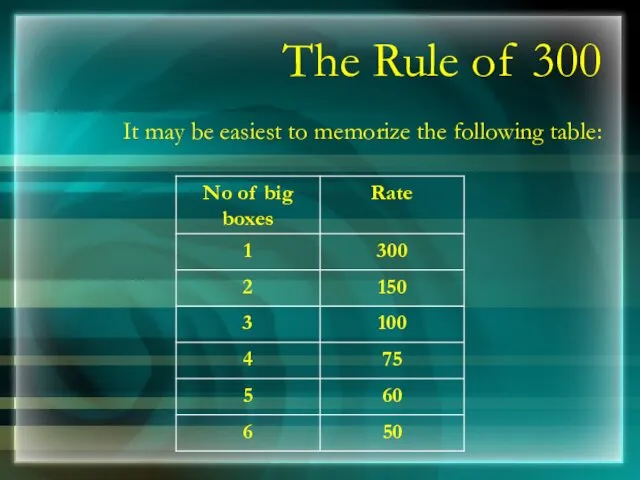
The Rule of 300
It may be easiest to memorize the following
The Rule of 300
It may be easiest to memorize the following
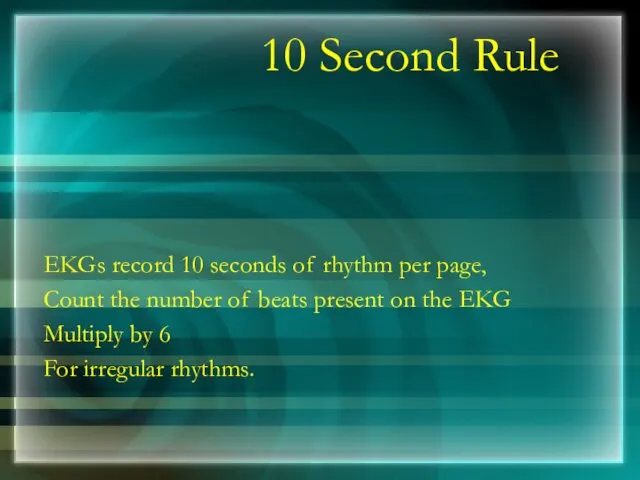
10 Second Rule
EKGs record 10 seconds of rhythm per page,
Count the
10 Second Rule
EKGs record 10 seconds of rhythm per page,
Count the
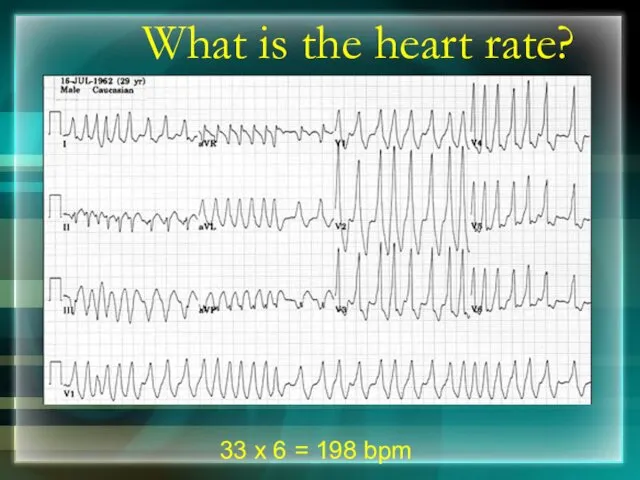
What is the heart rate?
33 x 6 = 198 bpm
What is the heart rate?
33 x 6 = 198 bpm
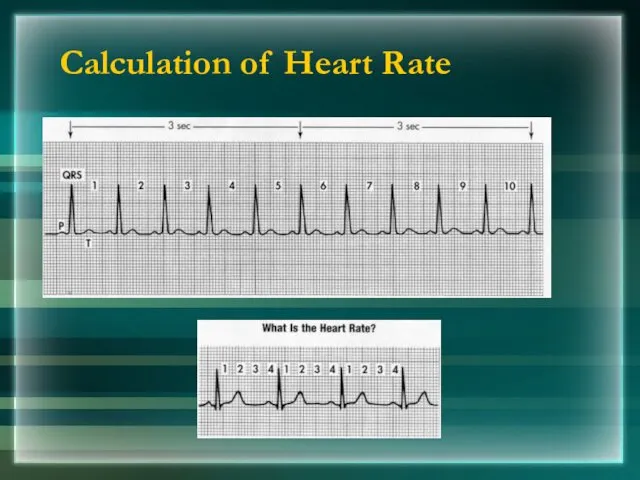
Calculation of Heart Rate
Calculation of Heart Rate
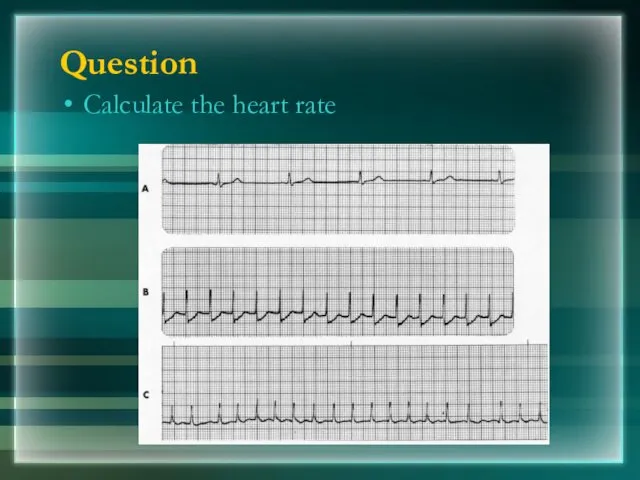
Question
Calculate the heart rate
Question
Calculate the heart rate
The QRS Axis
The QRS axis represents overall direction of the heart’s
The QRS Axis
The QRS axis represents overall direction of the heart’s
The QRS Axis
Normal QRS axis from -30° to +90°.
-30° to -90°
The QRS Axis
Normal QRS axis from -30° to +90°.
-30° to -90°
Determining the Axis
The Quadrant Approach
The Equiphasic Approach
Determining the Axis
The Quadrant Approach
The Equiphasic Approach
Determining the Axis
Predominantly Positive
Predominantly Negative
Equiphasic
Determining the Axis
Predominantly Positive
Predominantly Negative
Equiphasic
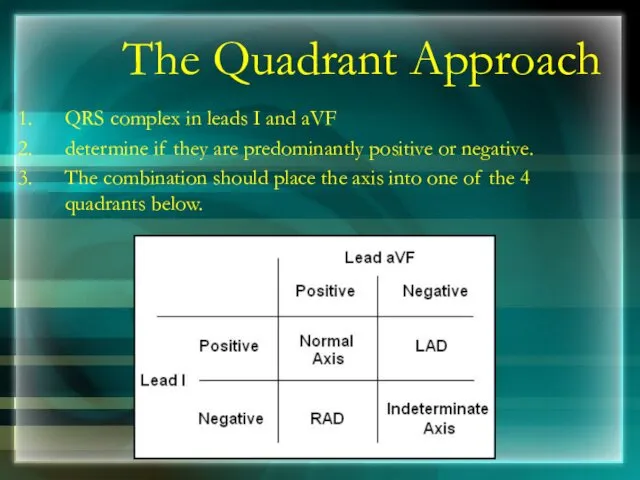
The Quadrant Approach
QRS complex in leads I and aVF
determine if
The Quadrant Approach
QRS complex in leads I and aVF
determine if
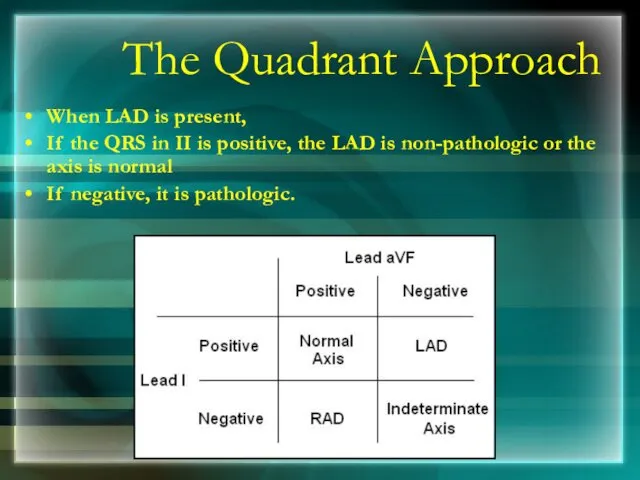
The Quadrant Approach
When LAD is present,
If the QRS in II
The Quadrant Approach
When LAD is present,
If the QRS in II
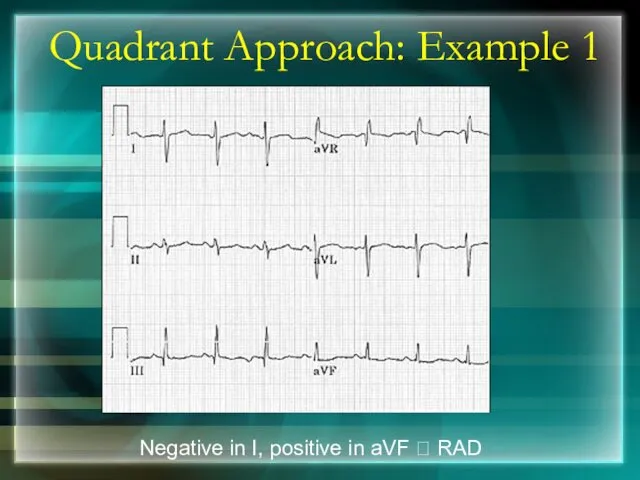
Quadrant Approach: Example 1
Negative in I, positive in aVF ? RAD
Quadrant Approach: Example 1
Negative in I, positive in aVF ? RAD
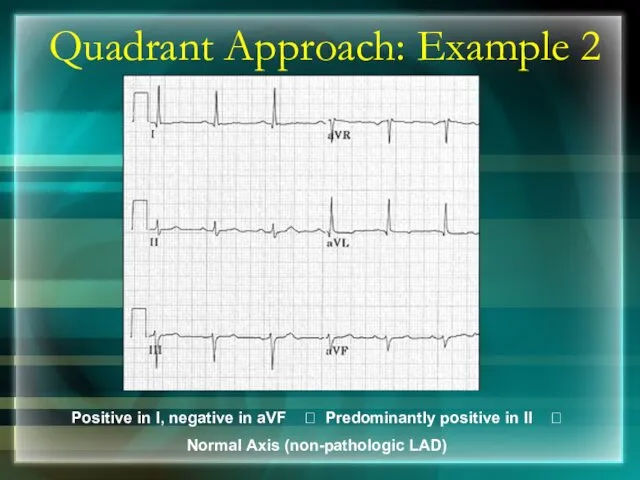
Quadrant Approach: Example 2
Positive in I, negative in aVF ? Predominantly
Quadrant Approach: Example 2
Positive in I, negative in aVF ? Predominantly
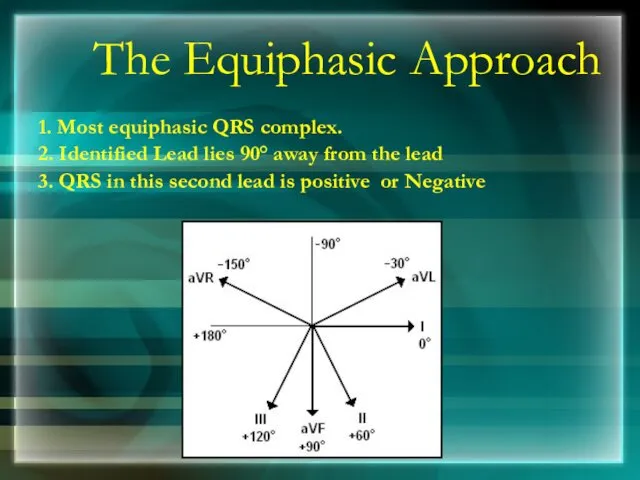
The Equiphasic Approach
1. Most equiphasic QRS complex.
2. Identified Lead lies
The Equiphasic Approach
1. Most equiphasic QRS complex.
2. Identified Lead lies
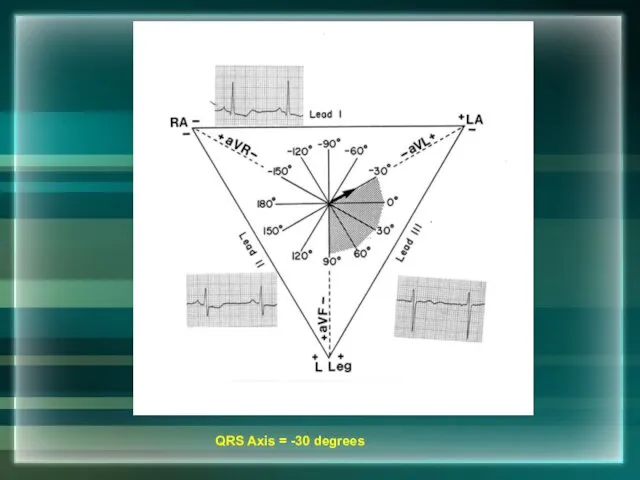
QRS Axis = -30 degrees
QRS Axis = -30 degrees
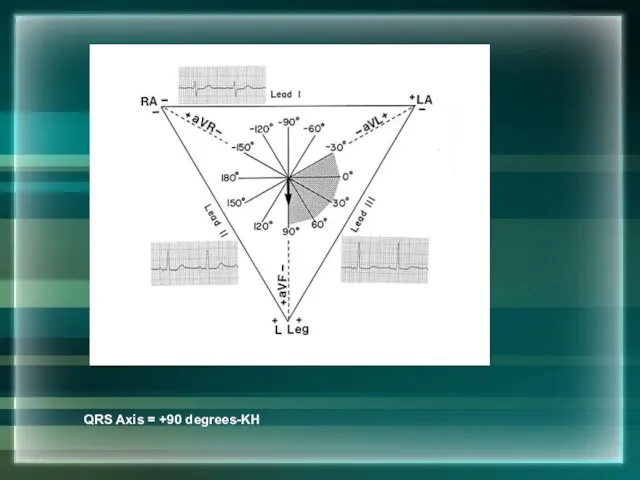
QRS Axis = +90 degrees-KH
QRS Axis = +90 degrees-KH
Equiphasic Approach
Equiphasic in aVF ? Predominantly positive in I ? QRS
Equiphasic Approach
Equiphasic in aVF ? Predominantly positive in I ? QRS

Thank You
Thank You
BRADYARRYTHMIA
Dr Subroto Mandal, MD, DM, DC
Associate Professor, Cardiology
BRADYARRYTHMIA
Dr Subroto Mandal, MD, DM, DC
Associate Professor, Cardiology
Classification
Sinus Bradycardia
Junctional Rhythm
Sino Atrial Block
Atrioventricular block
Classification
Sinus Bradycardia
Junctional Rhythm
Sino Atrial Block
Atrioventricular block
Impulse Conduction & the ECG
Sinoatrial node
AV node
Bundle of His
Bundle Branches
Impulse Conduction & the ECG
Sinoatrial node
AV node
Bundle of His
Bundle Branches
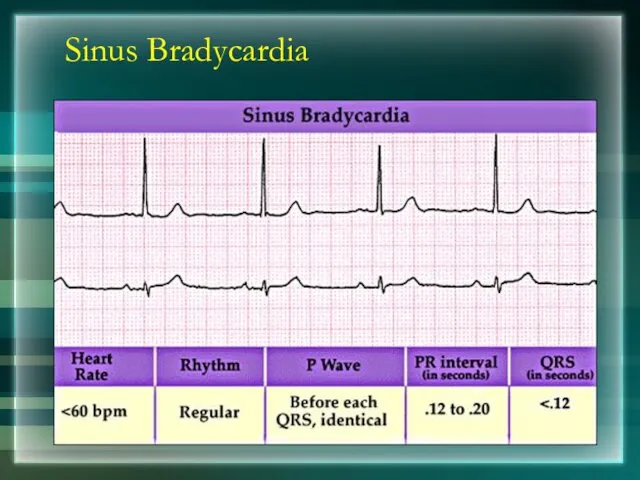
Sinus Bradycardia
Sinus Bradycardia
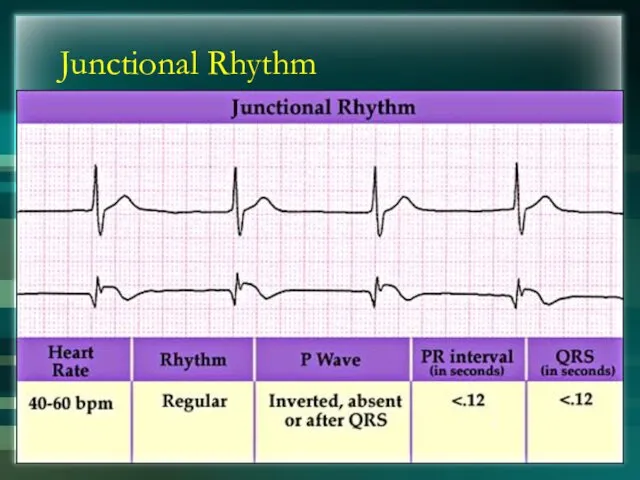
Junctional Rhythm
Junctional Rhythm
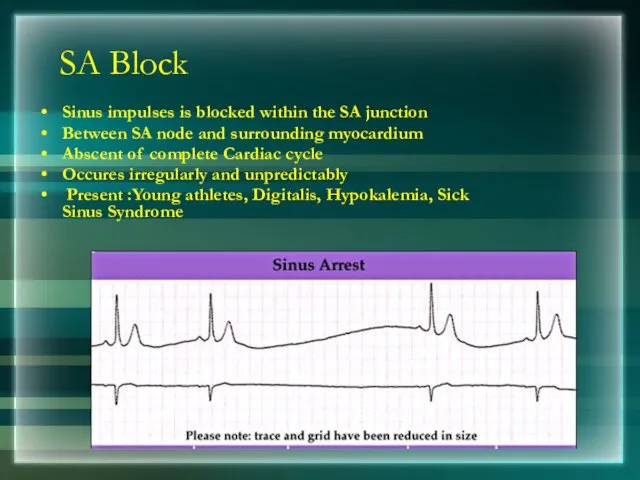
SA Block
Sinus impulses is blocked within the SA junction
Between SA node
SA Block
Sinus impulses is blocked within the SA junction
Between SA node
AV Block
First Degree AV Block
Second Degree AV Block
Third Degree AV Block
AV Block
First Degree AV Block
Second Degree AV Block
Third Degree AV Block
First Degree AV Block
Delay in the conduction through the conducting system
Prolong
First Degree AV Block
Delay in the conduction through the conducting system
Prolong
Second Degree AV Block
Intermittent failure of AV conduction
Impulse blocked by
Second Degree AV Block
Intermittent failure of AV conduction
Impulse blocked by
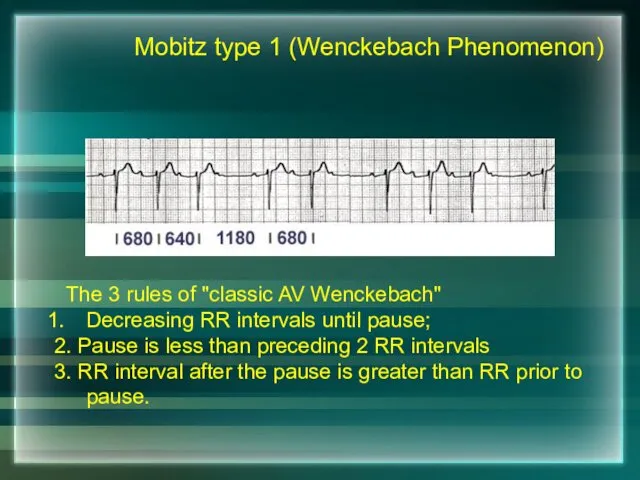
The 3 rules of "classic AV Wenckebach"
Decreasing RR intervals
The 3 rules of "classic AV Wenckebach"
Decreasing RR intervals
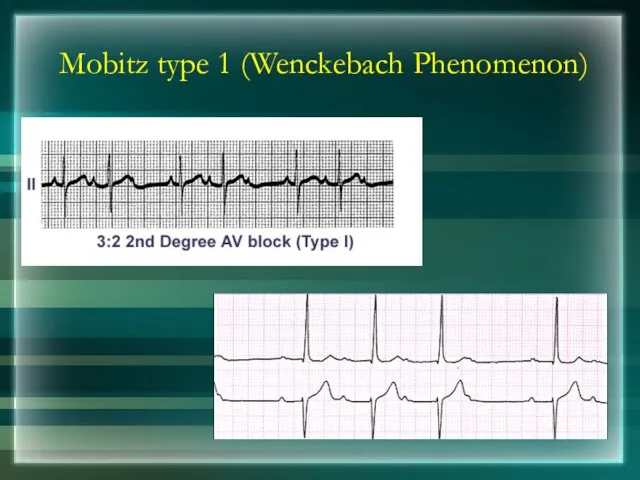
Mobitz type 1 (Wenckebach Phenomenon)
Mobitz type 1 (Wenckebach Phenomenon)
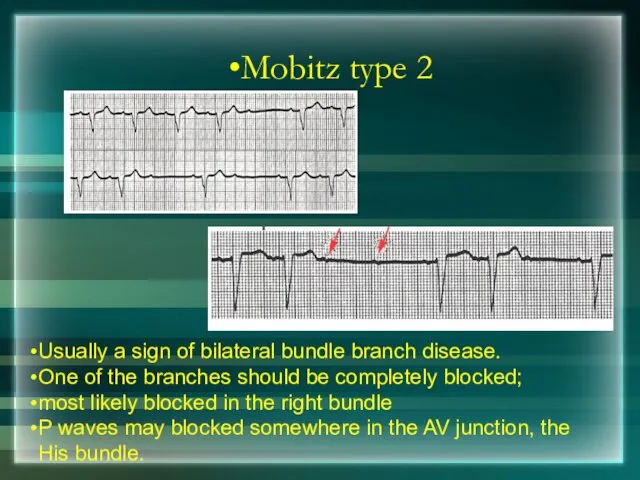
Mobitz type 2
Usually a sign of bilateral bundle branch disease.
One of
Mobitz type 2
Usually a sign of bilateral bundle branch disease.
One of
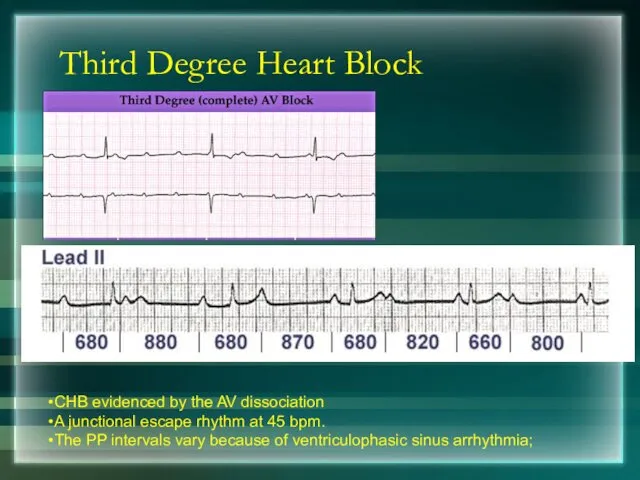
Third Degree Heart Block
CHB evidenced by the AV dissociation
A junctional escape
Third Degree Heart Block
CHB evidenced by the AV dissociation
A junctional escape
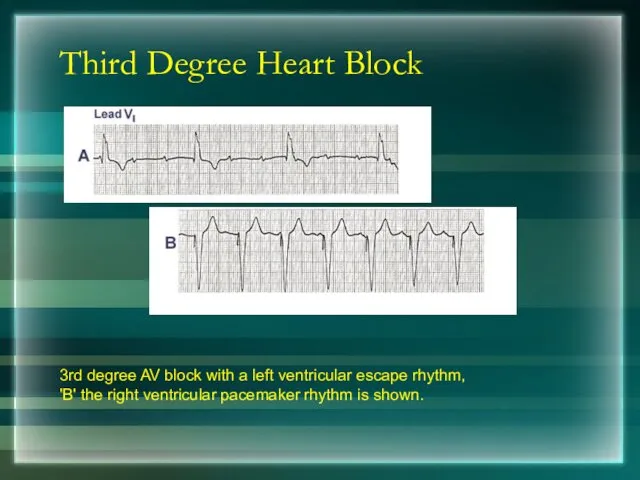
Third Degree Heart Block
3rd degree AV block with a left ventricular
Third Degree Heart Block
3rd degree AV block with a left ventricular
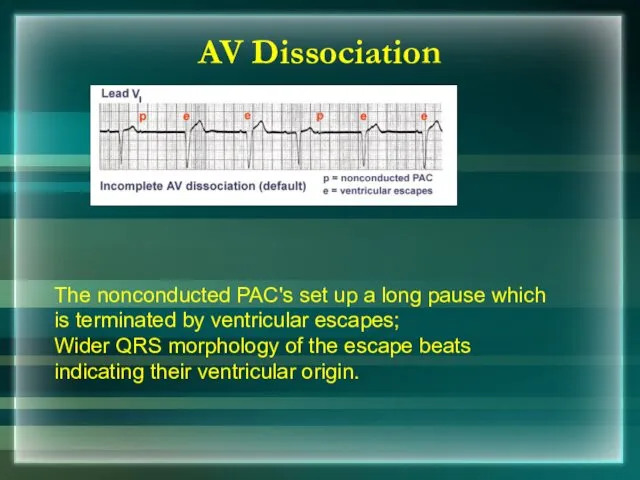
The nonconducted PAC's set up a long pause which is terminated
The nonconducted PAC's set up a long pause which is terminated
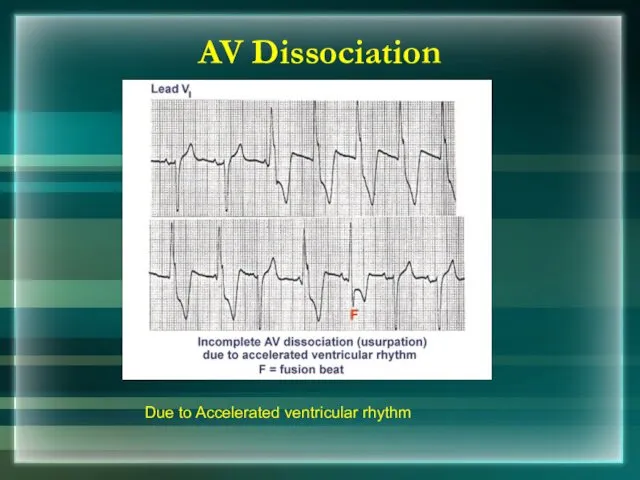
AV Dissociation
Due to Accelerated ventricular rhythm
AV Dissociation
Due to Accelerated ventricular rhythm
Thank You
Thank You
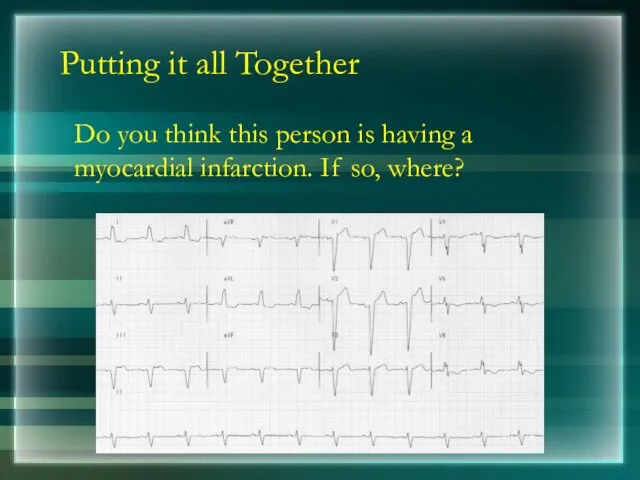
Putting it all Together
Do you think this person is having a
Putting it all Together
Do you think this person is having a

Interpretation
Yes, this person is having an acute anterior wall myocardial infarction.
Interpretation
Yes, this person is having an acute anterior wall myocardial infarction.
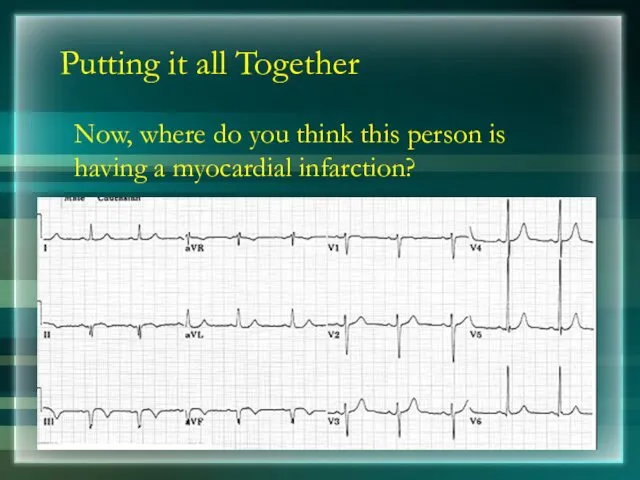
Putting it all Together
Now, where do you think this person is
Putting it all Together
Now, where do you think this person is
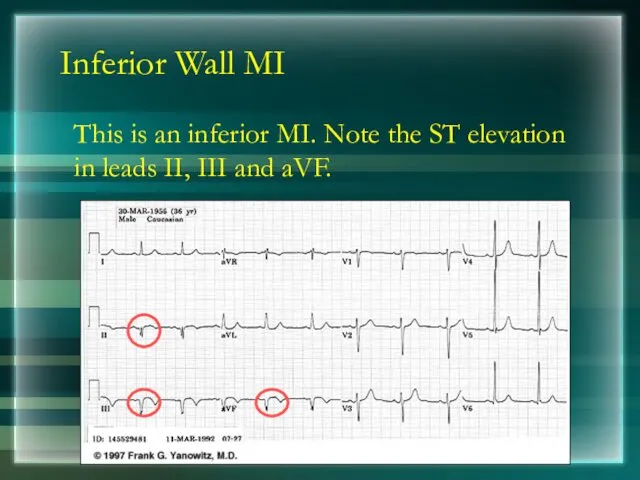
Inferior Wall MI
This is an inferior MI. Note the ST elevation
Inferior Wall MI
This is an inferior MI. Note the ST elevation

Putting it all Together
How about now?
Putting it all Together
How about now?

Anterolateral MI
This person’s MI involves both the anterior wall (V2-V4) and
Anterolateral MI
This person’s MI involves both the anterior wall (V2-V4) and
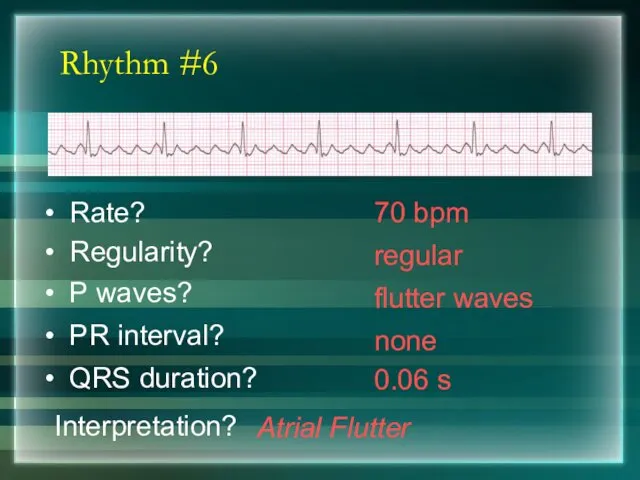
Rhythm #6
70 bpm
Rate?
Regularity?
regular
flutter waves
0.06 s
P waves?
PR interval?
none
Rhythm #6
70 bpm
Rate?
Regularity?
regular
flutter waves
0.06 s
P waves?
PR interval?
none

Rhythm #7
74 ?148 bpm
Rate?
Regularity?
Regular ? regular
Normal ? none
0.08 s
Rhythm #7
74 ?148 bpm
Rate?
Regularity?
Regular ? regular
Normal ? none
0.08 s

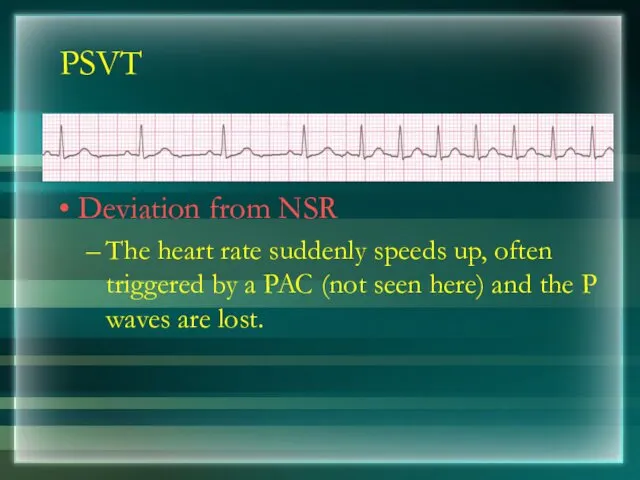
PSVT
Deviation from NSR
The heart rate suddenly speeds up, often triggered by
PSVT
Deviation from NSR
The heart rate suddenly speeds up, often triggered by

Ventricular Arrhythmias
Ventricular Tachycardia
Ventricular Fibrillation
Ventricular Arrhythmias
Ventricular Tachycardia
Ventricular Fibrillation

Rhythm #8
160 bpm
Rate?
Regularity?
regular
none
wide (> 0.12 sec)
P waves?
PR
Rhythm #8
160 bpm
Rate?
Regularity?
regular
none
wide (> 0.12 sec)
P waves?
PR

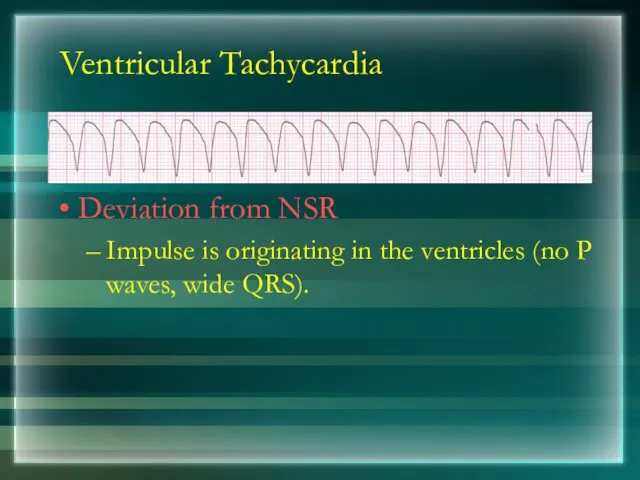
Ventricular Tachycardia
Deviation from NSR
Impulse is originating in the ventricles (no P
Ventricular Tachycardia
Deviation from NSR
Impulse is originating in the ventricles (no P

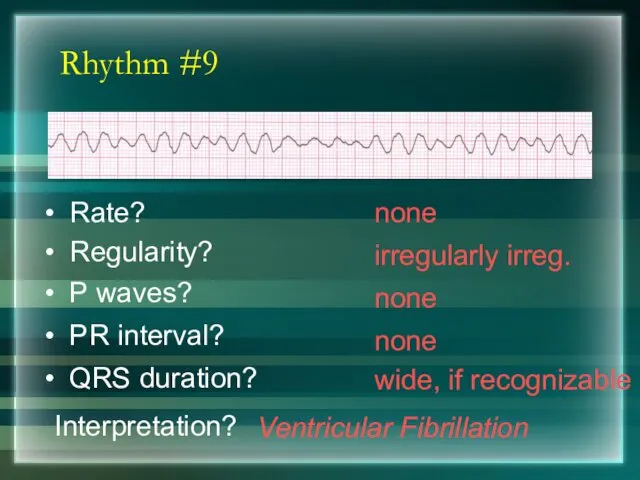
Rhythm #9
none
Rate?
Regularity?
irregularly irreg.
none
wide, if recognizable
P waves?
PR
Rhythm #9
none
Rate?
Regularity?
irregularly irreg.
none
wide, if recognizable
P waves?
PR
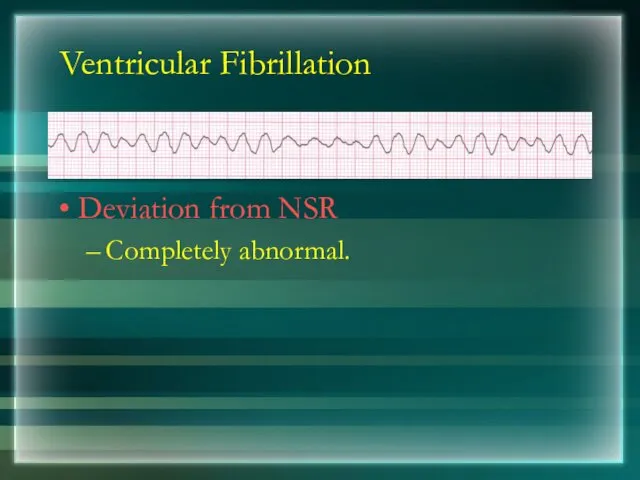
Ventricular Fibrillation
Deviation from NSR
Completely abnormal.
Ventricular Fibrillation
Deviation from NSR
Completely abnormal.
Arrhythmia Formation
Arrhythmias can arise from problems in the:
Sinus node
Atrial cells
AV junction
Ventricular
Arrhythmia Formation
Arrhythmias can arise from problems in the:
Sinus node
Atrial cells
AV junction
Ventricular
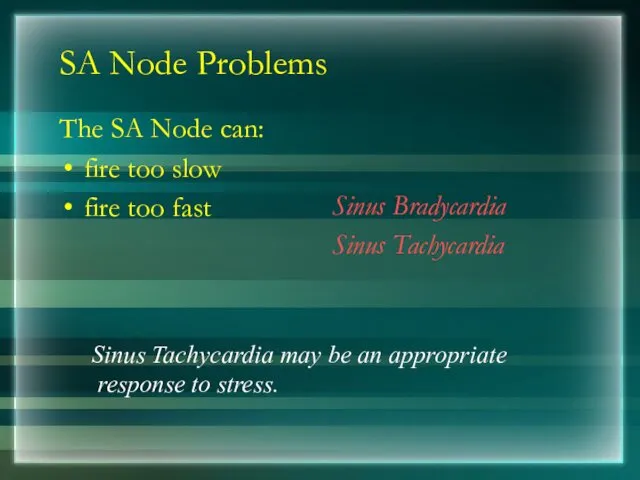
SA Node Problems
The SA Node can:
fire too slow
fire too fast
Sinus Bradycardia
Sinus
SA Node Problems
The SA Node can:
fire too slow
fire too fast
Sinus Bradycardia
Sinus
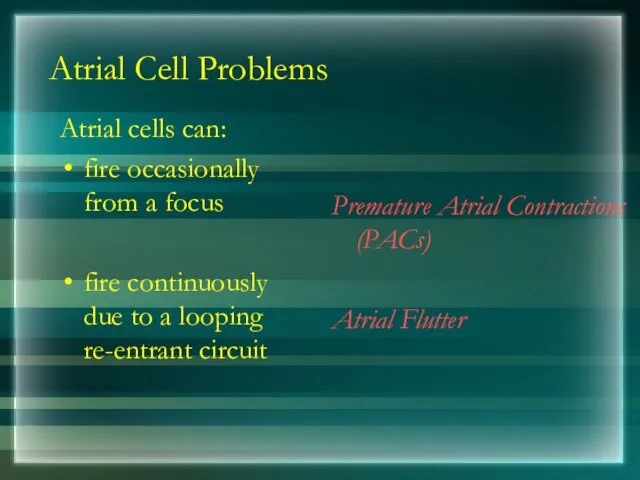
Atrial Cell Problems
Atrial cells can:
fire occasionally from a focus
fire continuously
Atrial Cell Problems
Atrial cells can:
fire occasionally from a focus
fire continuously
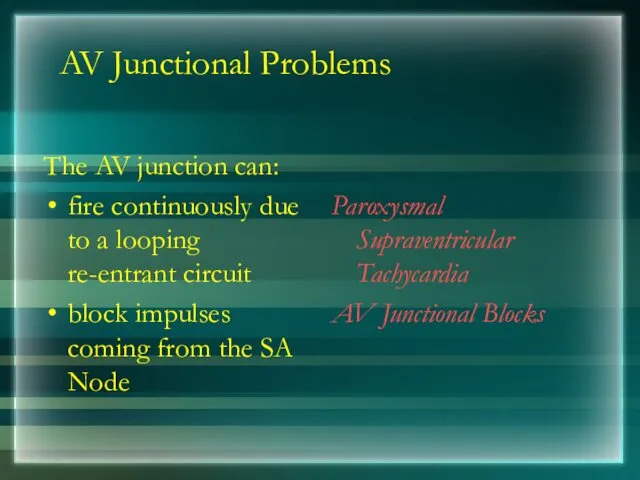
AV Junctional Problems
The AV junction can:
fire continuously due to a looping
AV Junctional Problems
The AV junction can:
fire continuously due to a looping
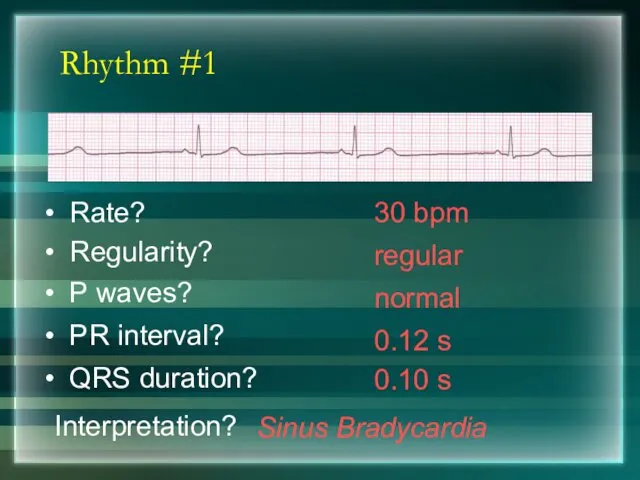
Rhythm #1
30 bpm
Rate?
Regularity?
regular
normal
0.10 s
P waves?
PR interval?
0.12 s
Rhythm #1
30 bpm
Rate?
Regularity?
regular
normal
0.10 s
P waves?
PR interval?
0.12 s
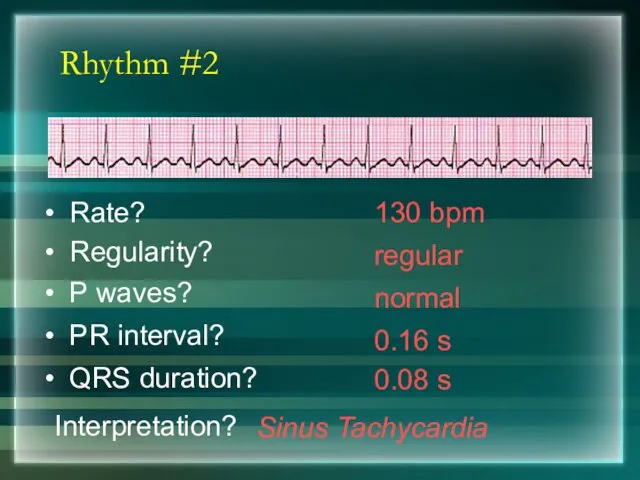
Rhythm #2
130 bpm
Rate?
Regularity?
regular
normal
0.08 s
P waves?
PR interval?
0.16 s
Rhythm #2
130 bpm
Rate?
Regularity?
regular
normal
0.08 s
P waves?
PR interval?
0.16 s
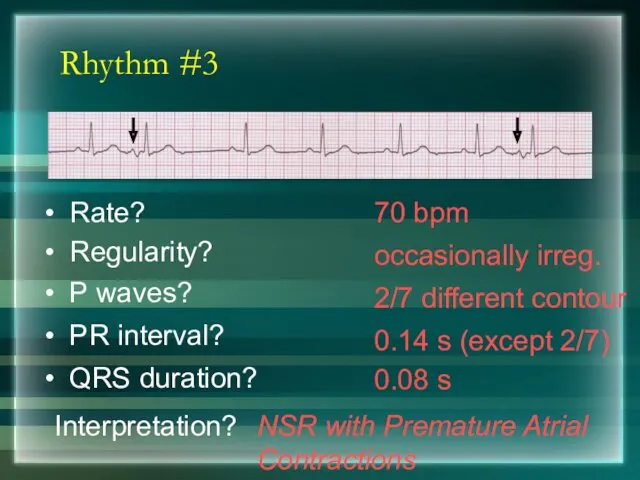
Rhythm #3
70 bpm
Rate?
Regularity?
occasionally irreg.
2/7 different contour
0.08 s
P waves?
Rhythm #3
70 bpm
Rate?
Regularity?
occasionally irreg.
2/7 different contour
0.08 s
P waves?
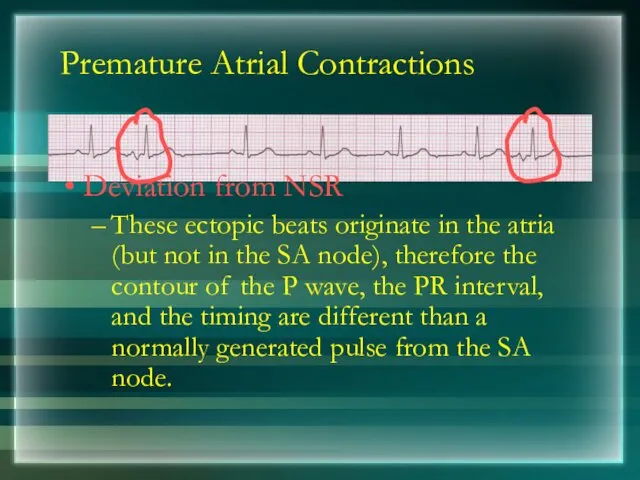
Premature Atrial Contractions
Deviation from NSR
These ectopic beats originate in the atria
Premature Atrial Contractions
Deviation from NSR
These ectopic beats originate in the atria
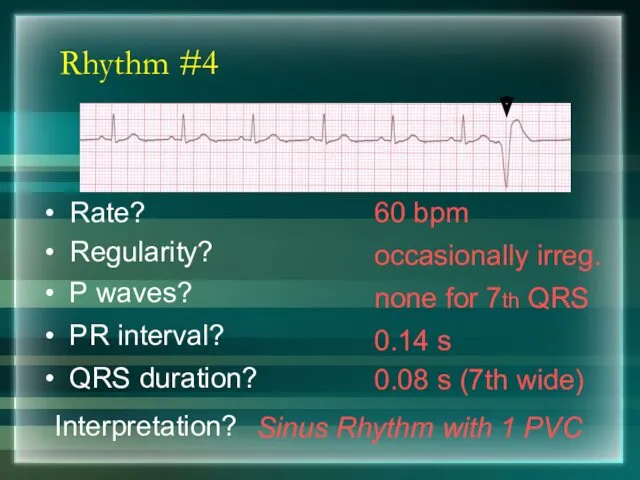
Rhythm #4
60 bpm
Rate?
Regularity?
occasionally irreg.
none for 7th QRS
0.08 s (7th
Rhythm #4
60 bpm
Rate?
Regularity?
occasionally irreg.
none for 7th QRS
0.08 s (7th
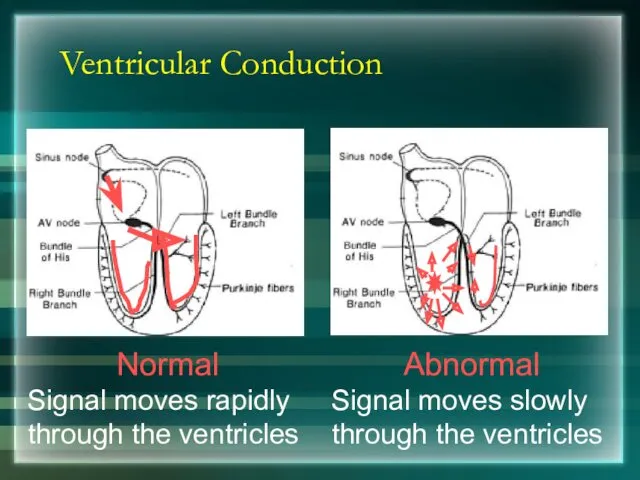
Ventricular Conduction
Normal
Signal moves rapidly through the ventricles
Abnormal
Signal moves slowly through the
Ventricular Conduction
Normal
Signal moves rapidly through the ventricles
Abnormal
Signal moves slowly through the
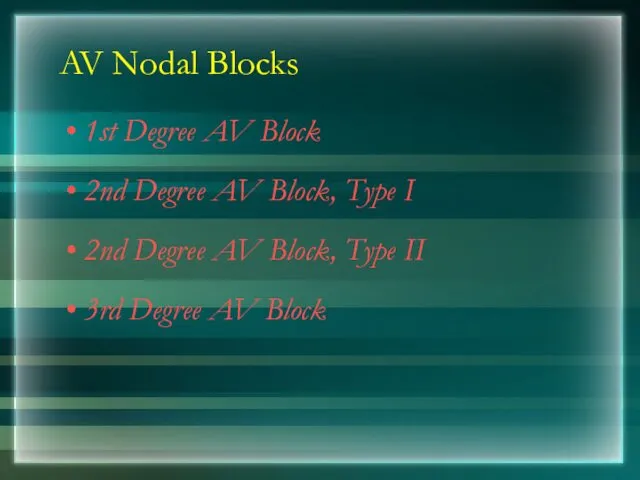
AV Nodal Blocks
1st Degree AV Block
2nd Degree AV Block, Type I
2nd
AV Nodal Blocks
1st Degree AV Block
2nd Degree AV Block, Type I
2nd
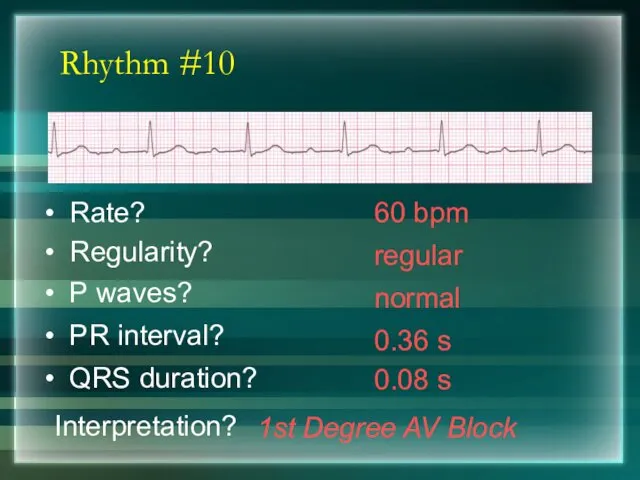
Rhythm #10
60 bpm
Rate?
Regularity?
regular
normal
0.08 s
P waves?
PR interval?
0.36 s
Rhythm #10
60 bpm
Rate?
Regularity?
regular
normal
0.08 s
P waves?
PR interval?
0.36 s
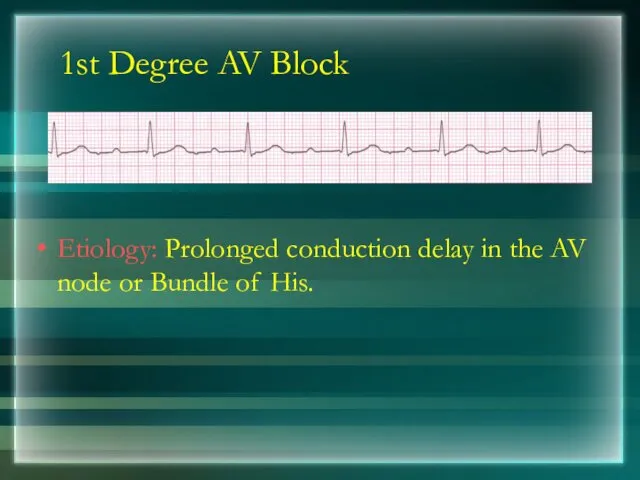
1st Degree AV Block
Etiology: Prolonged conduction delay in the AV node
1st Degree AV Block
Etiology: Prolonged conduction delay in the AV node
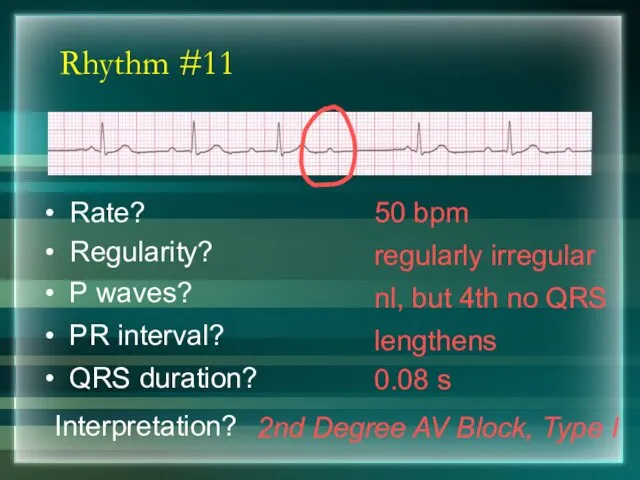
Rhythm #11
50 bpm
Rate?
Regularity?
regularly irregular
nl, but 4th no QRS
0.08 s
Rhythm #11
50 bpm
Rate?
Regularity?
regularly irregular
nl, but 4th no QRS
0.08 s
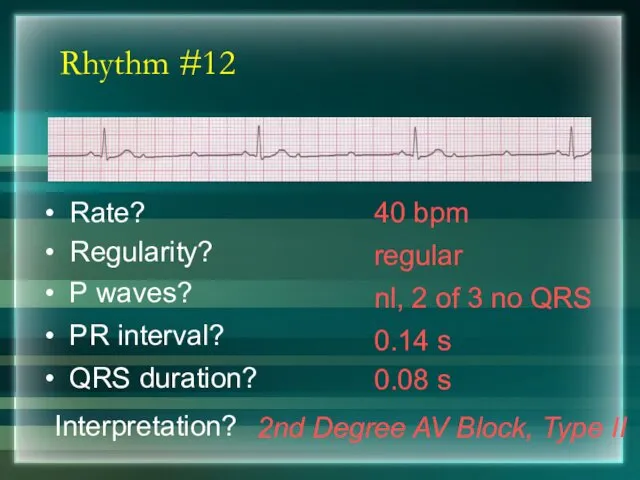
Rhythm #12
40 bpm
Rate?
Regularity?
regular
nl, 2 of 3 no QRS
0.08 s
Rhythm #12
40 bpm
Rate?
Regularity?
regular
nl, 2 of 3 no QRS
0.08 s
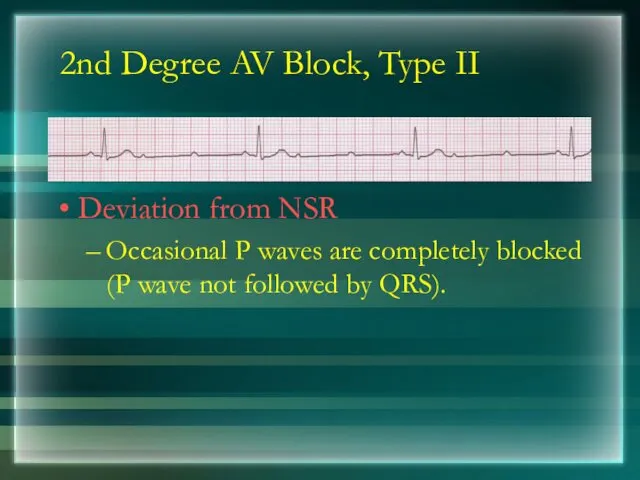
2nd Degree AV Block, Type II
Deviation from NSR
Occasional P waves are
2nd Degree AV Block, Type II
Deviation from NSR
Occasional P waves are

Rhythm #13
40 bpm
Rate?
Regularity?
regular
no relation to QRS
wide (> 0.12 s)
Rhythm #13
40 bpm
Rate?
Regularity?
regular
no relation to QRS
wide (> 0.12 s)
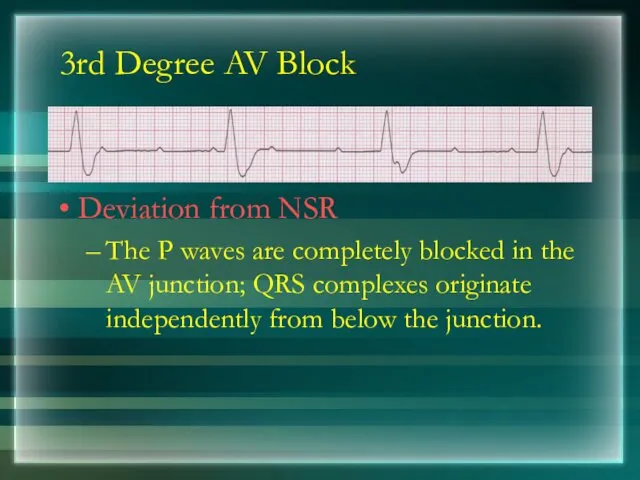
3rd Degree AV Block
Deviation from NSR
The P waves are completely blocked
3rd Degree AV Block
Deviation from NSR
The P waves are completely blocked
Supraventricular Arrhythmias
Atrial Fibrillation
Atrial Flutter
Paroxysmal Supraventricular Tachycardia
Supraventricular Arrhythmias
Atrial Fibrillation
Atrial Flutter
Paroxysmal Supraventricular Tachycardia
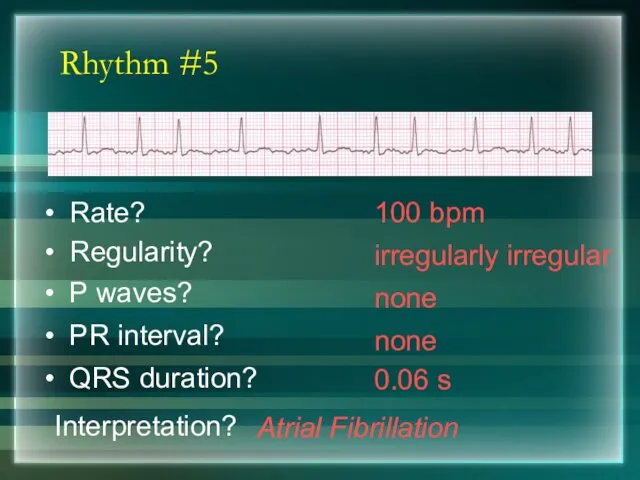
Rhythm #5
100 bpm
Rate?
Regularity?
irregularly irregular
none
0.06 s
P waves?
PR interval?
none
Rhythm #5
100 bpm
Rate?
Regularity?
irregularly irregular
none
0.06 s
P waves?
PR interval?
none
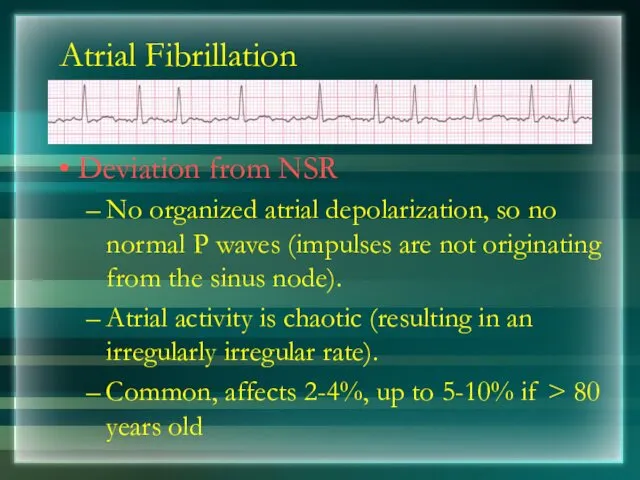
Atrial Fibrillation
Deviation from NSR
No organized atrial depolarization, so no normal P
Atrial Fibrillation
Deviation from NSR
No organized atrial depolarization, so no normal P

Rhythm #6
70 bpm
Rate?
Regularity?
regular
flutter waves
0.06 s
P waves?
PR interval?
none
Rhythm #6
70 bpm
Rate?
Regularity?
regular
flutter waves
0.06 s
P waves?
PR interval?
none
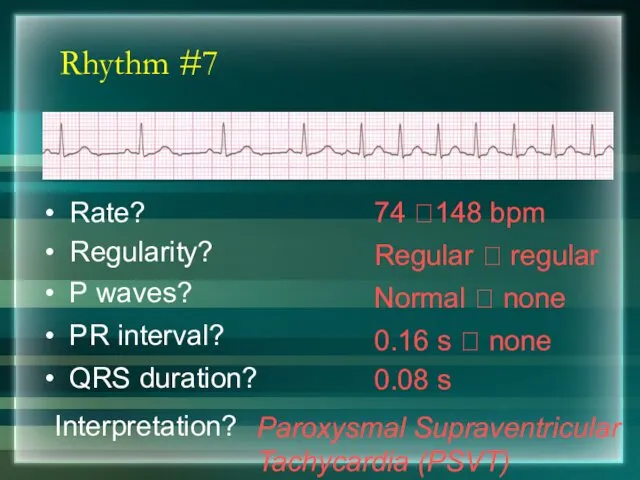
Rhythm #7
74 ?148 bpm
Rate?
Regularity?
Regular ? regular
Normal ? none
0.08 s
Rhythm #7
74 ?148 bpm
Rate?
Regularity?
Regular ? regular
Normal ? none
0.08 s
PSVT
Deviation from NSR
The heart rate suddenly speeds up, often triggered by
PSVT
Deviation from NSR
The heart rate suddenly speeds up, often triggered by
Ventricular Arrhythmias
Ventricular Tachycardia
Ventricular Fibrillation
Ventricular Arrhythmias
Ventricular Tachycardia
Ventricular Fibrillation

Rhythm #8
160 bpm
Rate?
Regularity?
regular
none
wide (> 0.12 sec)
P waves?
PR
Rhythm #8
160 bpm
Rate?
Regularity?
regular
none
wide (> 0.12 sec)
P waves?
PR
Ventricular Tachycardia
Deviation from NSR
Impulse is originating in the ventricles (no P
Ventricular Tachycardia
Deviation from NSR
Impulse is originating in the ventricles (no P
Rhythm #9
none
Rate?
Regularity?
irregularly irreg.
none
wide, if recognizable
P waves?
PR
Rhythm #9
none
Rate?
Regularity?
irregularly irreg.
none
wide, if recognizable
P waves?
PR

Ventricular Fibrillation
Deviation from NSR
Completely abnormal.
Ventricular Fibrillation
Deviation from NSR
Completely abnormal.
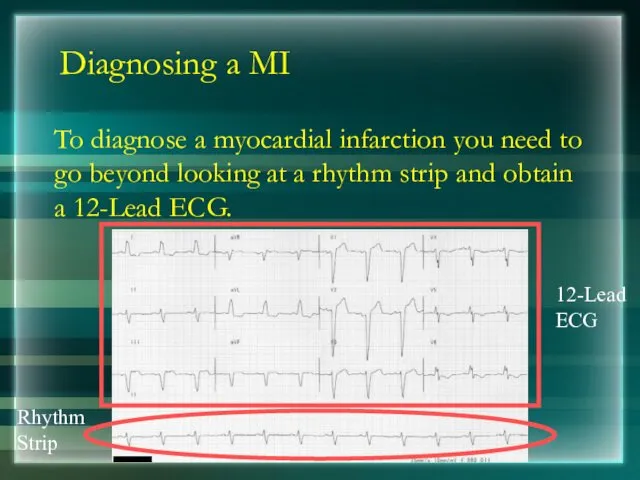
Diagnosing a MI
To diagnose a myocardial infarction you need to go
Diagnosing a MI
To diagnose a myocardial infarction you need to go
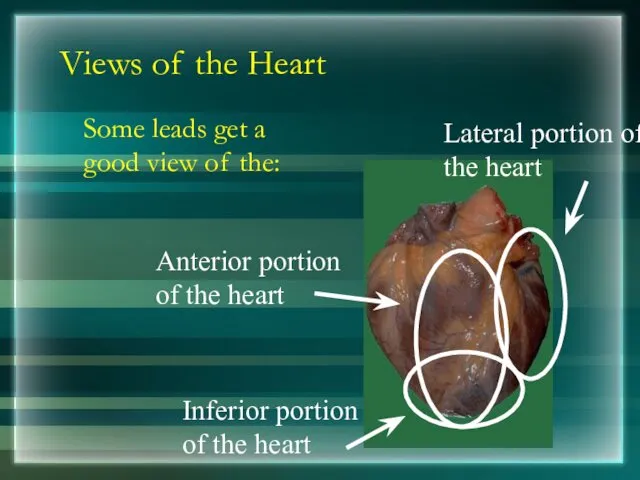
Views of the Heart
Some leads get a good view of the:
Anterior
Views of the Heart
Some leads get a good view of the:
Anterior
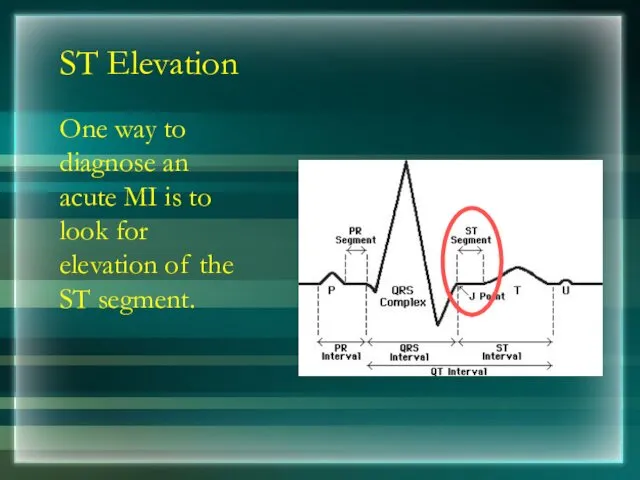
ST Elevation
One way to diagnose an acute MI is to look
ST Elevation
One way to diagnose an acute MI is to look
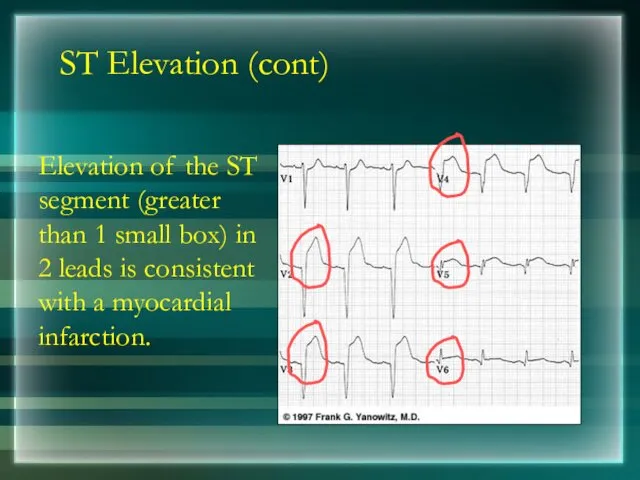
ST Elevation (cont)
Elevation of the ST segment (greater than 1 small
ST Elevation (cont)
Elevation of the ST segment (greater than 1 small
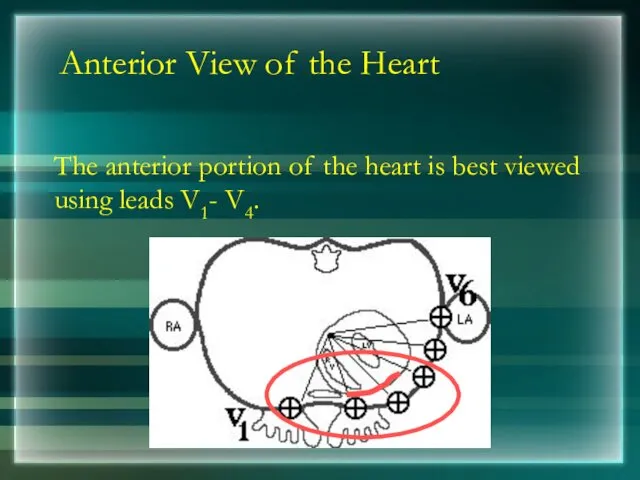
Anterior View of the Heart
The anterior portion of the heart is
Anterior View of the Heart
The anterior portion of the heart is
Anterior Myocardial Infarction
If you see changes in leads V1 - V4
Anterior Myocardial Infarction
If you see changes in leads V1 - V4

Putting it all Together
Do you think this person is having a
Putting it all Together
Do you think this person is having a
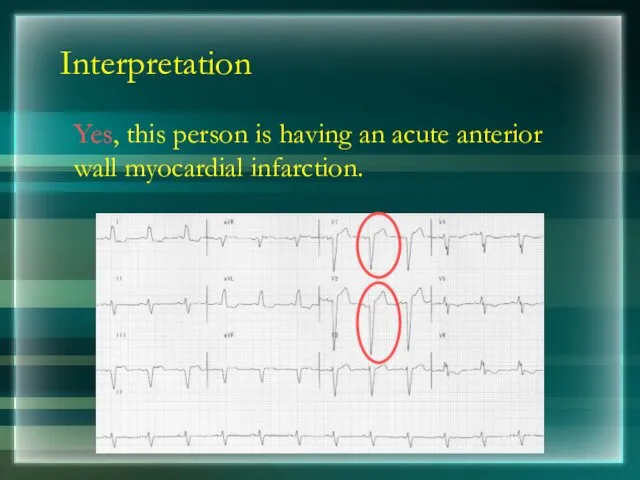
Interpretation
Yes, this person is having an acute anterior wall myocardial infarction.
Interpretation
Yes, this person is having an acute anterior wall myocardial infarction.
Other MI Locations
Now that you know where to look for an
Other MI Locations
Now that you know where to look for an
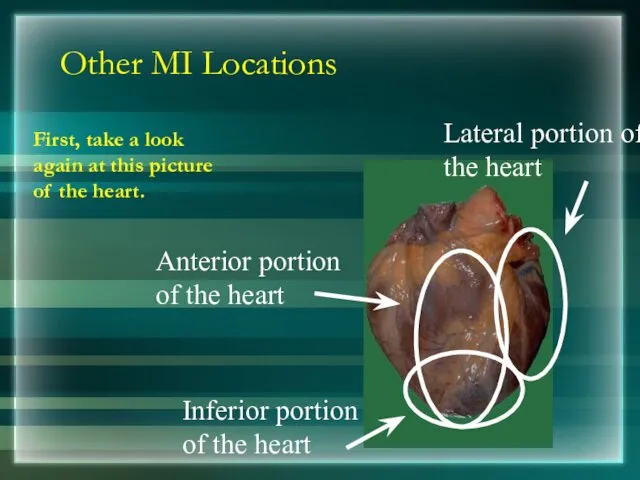
Other MI Locations
First, take a look again at this picture of
Other MI Locations
First, take a look again at this picture of
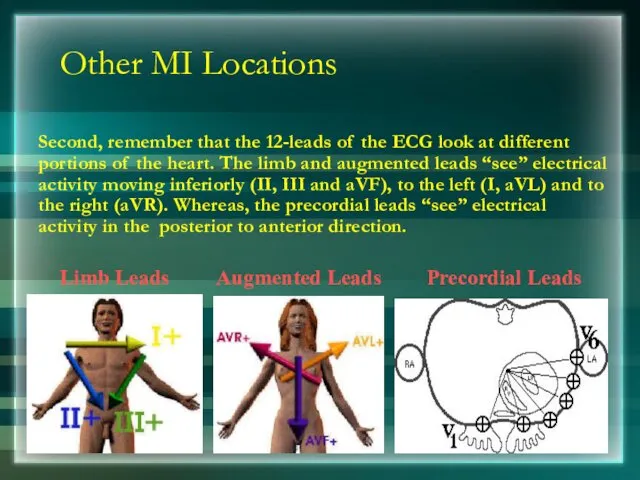
Other MI Locations
Second, remember that the 12-leads of the ECG look
Other MI Locations
Second, remember that the 12-leads of the ECG look
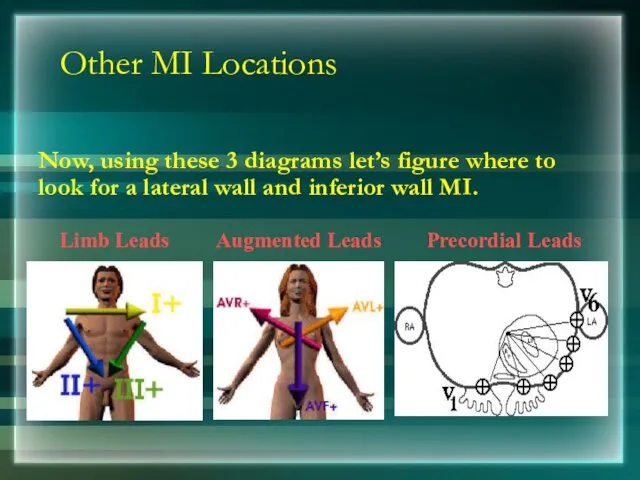
Other MI Locations
Now, using these 3 diagrams let’s figure where to
Other MI Locations
Now, using these 3 diagrams let’s figure where to
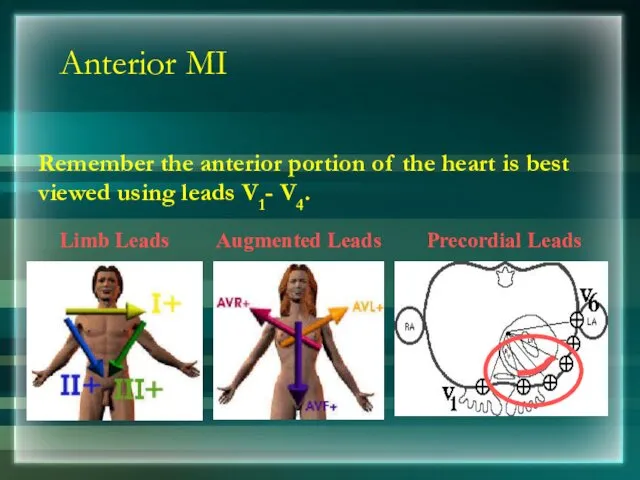
Anterior MI
Remember the anterior portion of the heart is best viewed
Anterior MI
Remember the anterior portion of the heart is best viewed
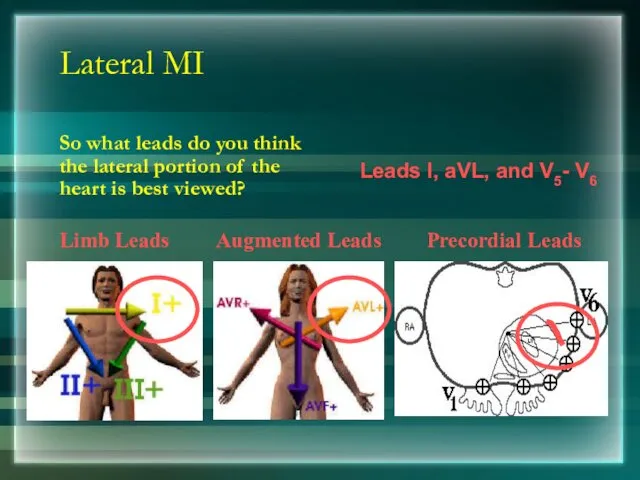
Lateral MI
So what leads do you think the lateral portion of
Lateral MI
So what leads do you think the lateral portion of
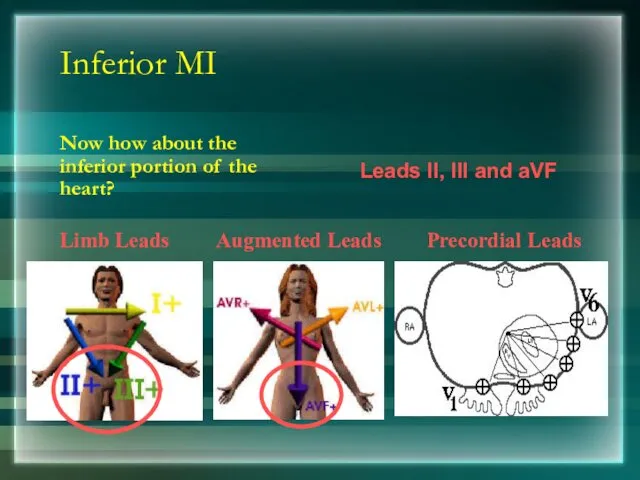
Inferior MI
Now how about the inferior portion of the heart?
Limb
Inferior MI
Now how about the inferior portion of the heart?
Limb

Putting it all Together
Now, where do you think this person is
Putting it all Together
Now, where do you think this person is

Inferior Wall MI
This is an inferior MI. Note the ST elevation
Inferior Wall MI
This is an inferior MI. Note the ST elevation
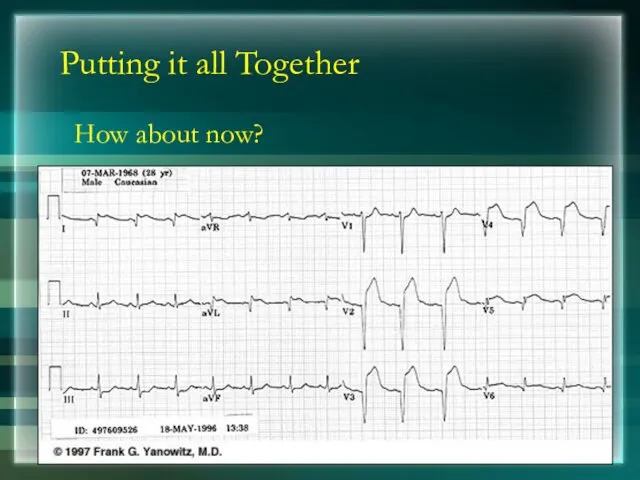
Putting it all Together
How about now?
Putting it all Together
How about now?
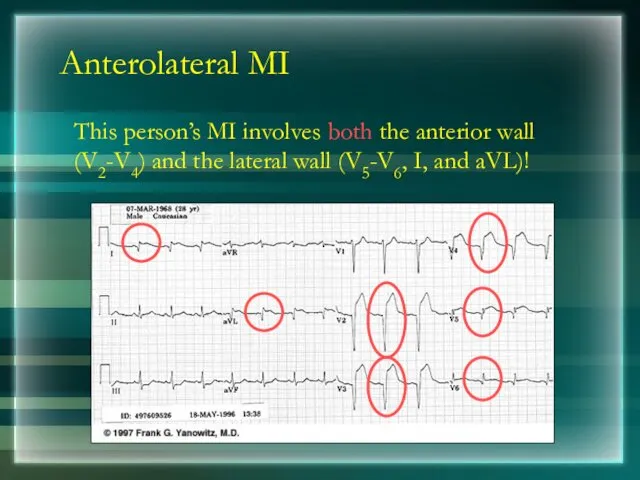
Anterolateral MI
This person’s MI involves both the anterior wall (V2-V4) and
Anterolateral MI
This person’s MI involves both the anterior wall (V2-V4) and
RIGHT ATRIAL ENLARGEMENT
RIGHT ATRIAL ENLARGEMENT
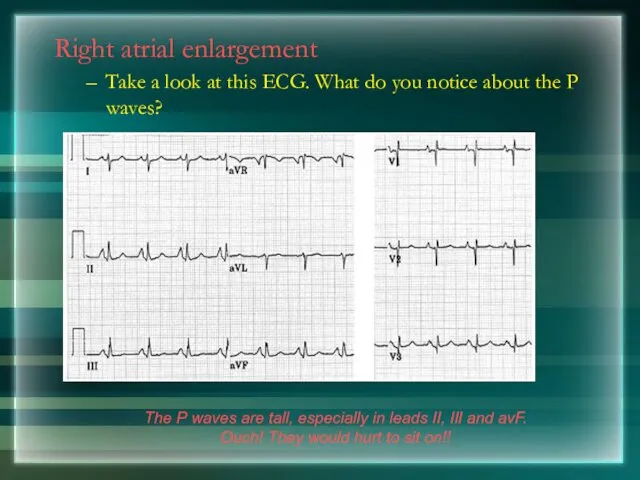
Right atrial enlargement
Take a look at this ECG. What do
Right atrial enlargement
Take a look at this ECG. What do
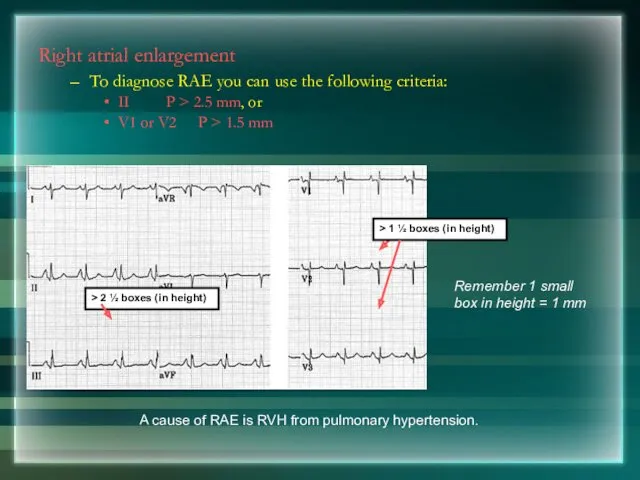
Right atrial enlargement
To diagnose RAE you can use the following
Right atrial enlargement
To diagnose RAE you can use the following
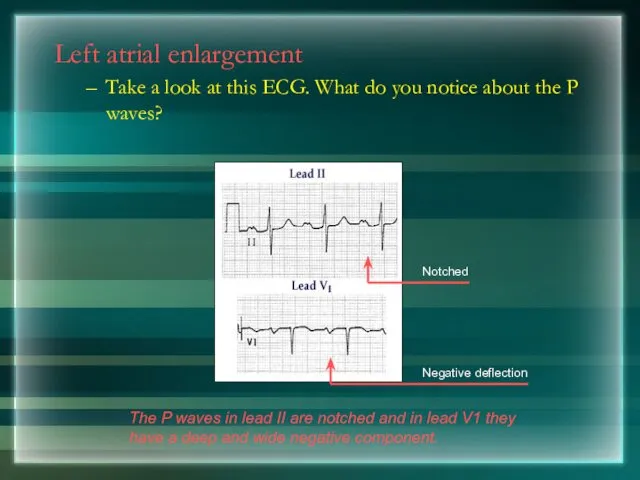
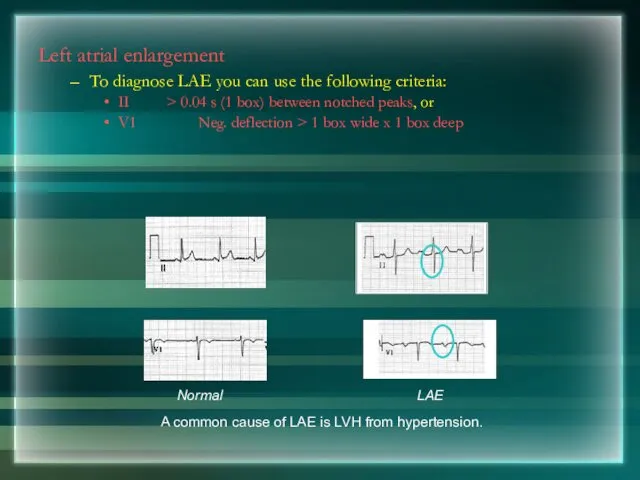
Left atrial enlargement
Take a look at this ECG. What do
Left atrial enlargement
Take a look at this ECG. What do
Left atrial enlargement
To diagnose LAE you can use the following
Left atrial enlargement
To diagnose LAE you can use the following
Left Ventricular Hypertrophy
Left Ventricular Hypertrophy
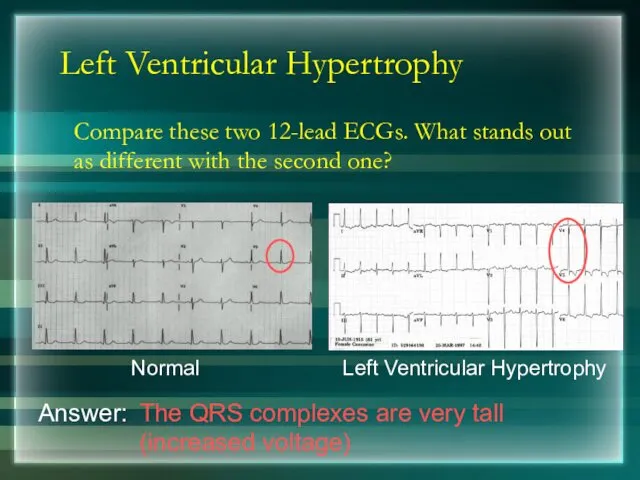
Left Ventricular Hypertrophy
Compare these two 12-lead ECGs. What stands out as
Left Ventricular Hypertrophy
Compare these two 12-lead ECGs. What stands out as
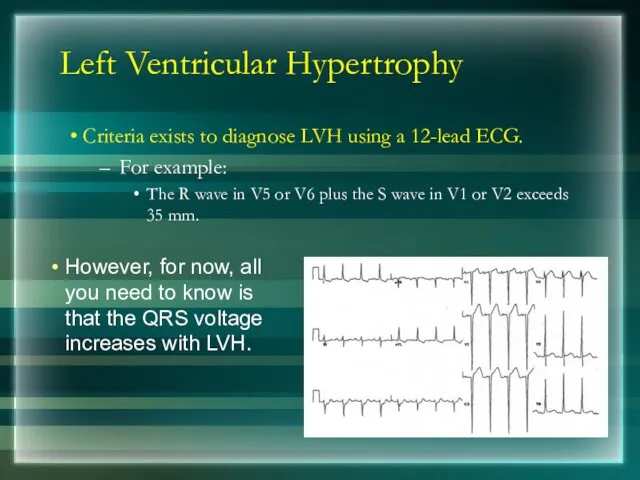
Left Ventricular Hypertrophy
Criteria exists to diagnose LVH using a 12-lead ECG.
Left Ventricular Hypertrophy
Criteria exists to diagnose LVH using a 12-lead ECG.
Right ventricular hypertrophy
Take a look at this ECG. What do you
Right ventricular hypertrophy
Take a look at this ECG. What do you
Right ventricular hypertrophy
To diagnose RVH you can use the following
Right ventricular hypertrophy
To diagnose RVH you can use the following
Right ventricular hypertrophy
Compare the R waves in V1, V2 from a
Right ventricular hypertrophy
Compare the R waves in V1, V2 from a
Left ventricular hypertrophy
Take a look at this ECG. What do you
Left ventricular hypertrophy
Take a look at this ECG. What do you
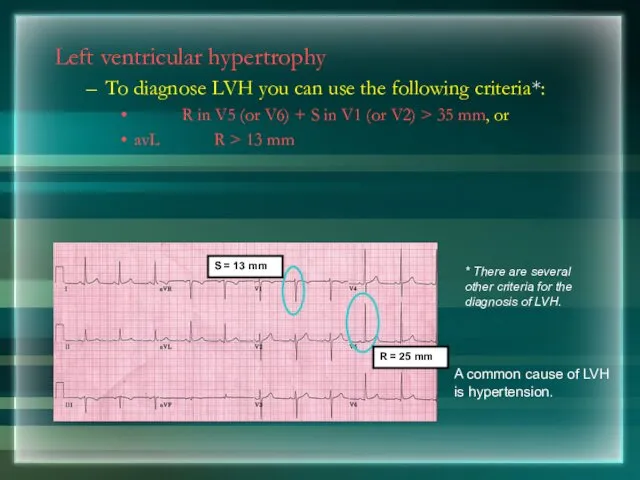
Left ventricular hypertrophy
To diagnose LVH you can use the following criteria*:
Left ventricular hypertrophy
To diagnose LVH you can use the following criteria*:

Bundle Branch Blocks
Bundle Branch Blocks
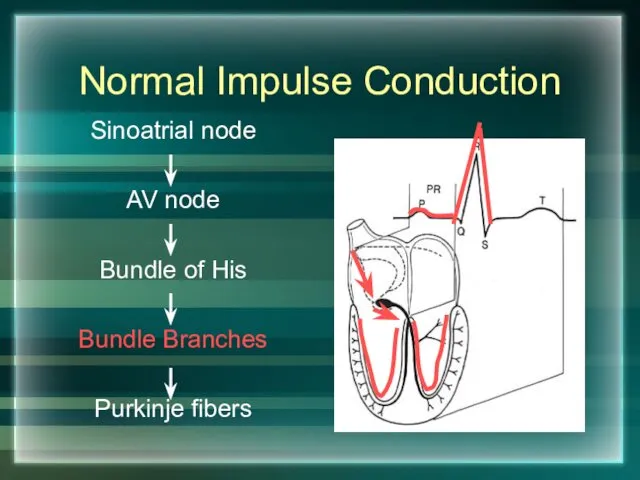
Normal Impulse Conduction
Sinoatrial node
AV node
Bundle of His
Bundle Branches
Purkinje fibers
Normal Impulse Conduction
Sinoatrial node
AV node
Bundle of His
Bundle Branches
Purkinje fibers
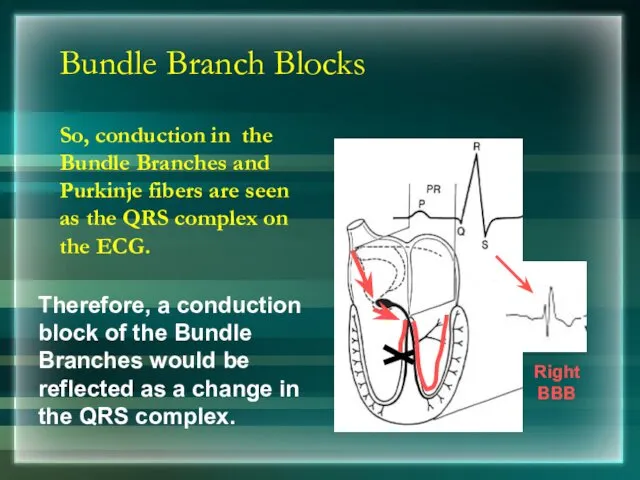
Bundle Branch Blocks
So, conduction in the Bundle Branches and Purkinje fibers
Bundle Branch Blocks
So, conduction in the Bundle Branches and Purkinje fibers
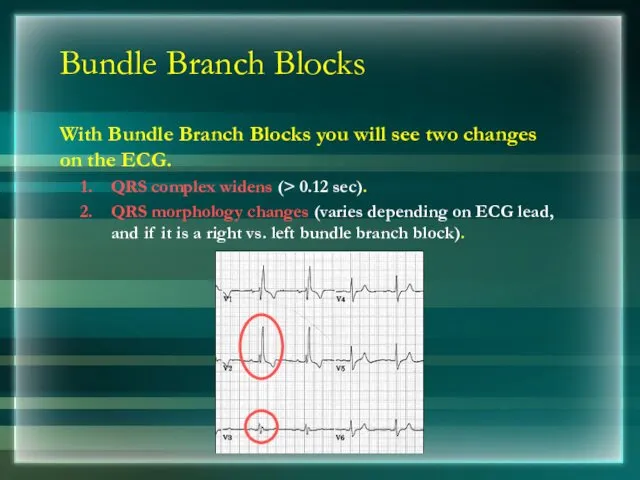
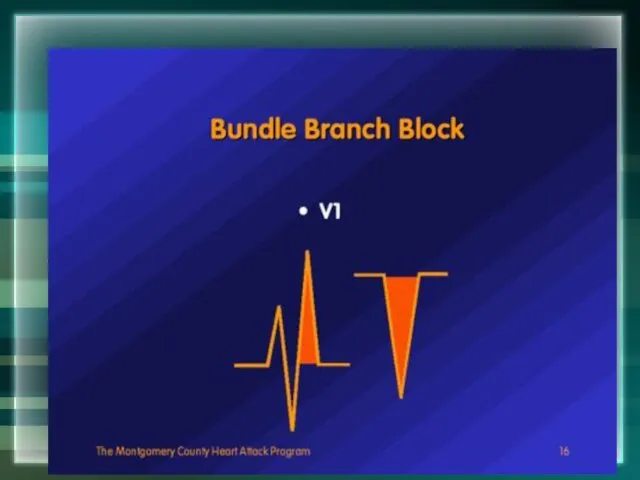
Bundle Branch Blocks
With Bundle Branch Blocks you will see two changes
Bundle Branch Blocks
With Bundle Branch Blocks you will see two changes
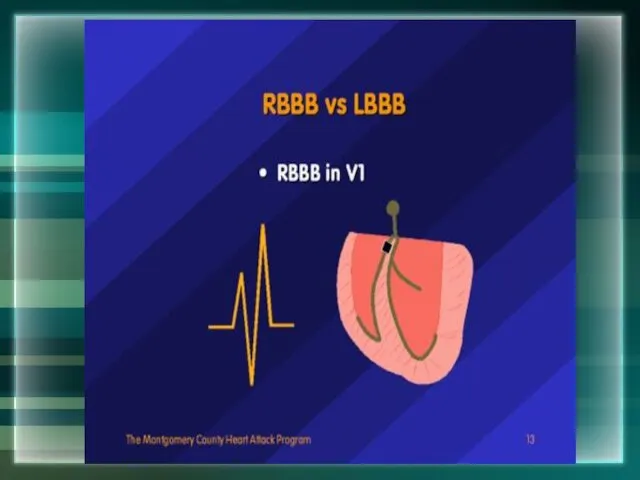
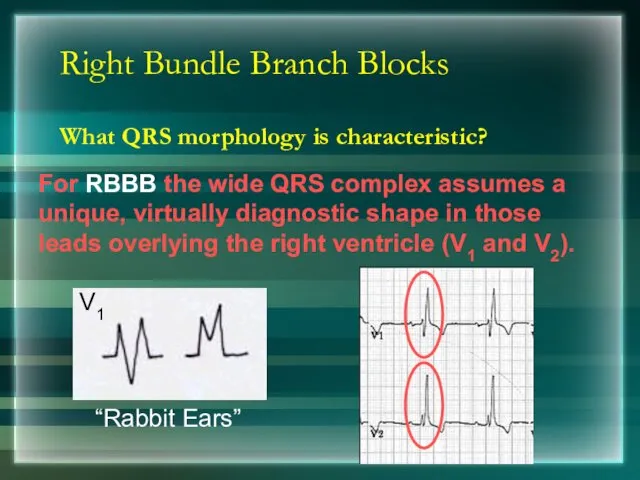
Right Bundle Branch Blocks
What QRS morphology is characteristic?
Right Bundle Branch Blocks
What QRS morphology is characteristic?
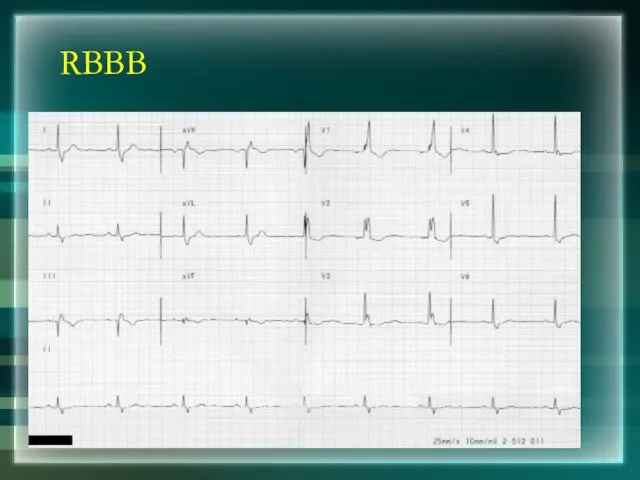
RBBB
RBBB
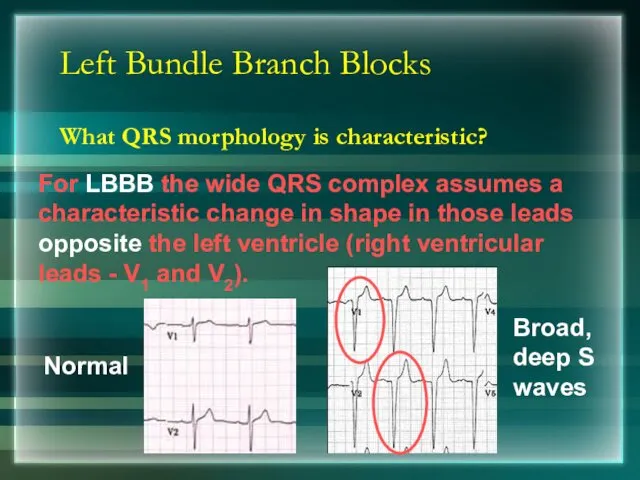
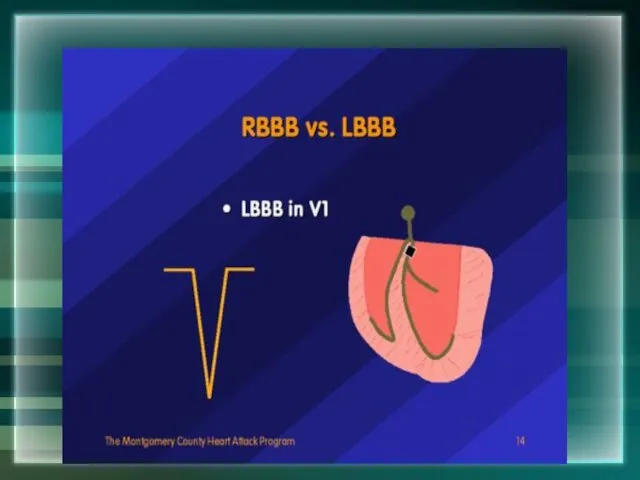
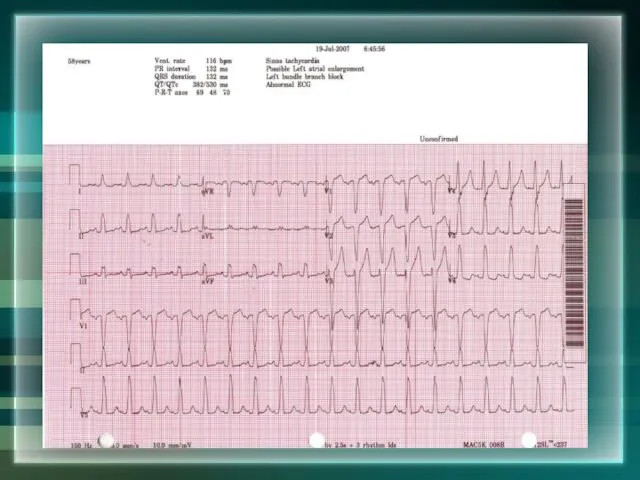
Left Bundle Branch Blocks
What QRS morphology is characteristic?
Normal
Left Bundle Branch Blocks
What QRS morphology is characteristic?
Normal
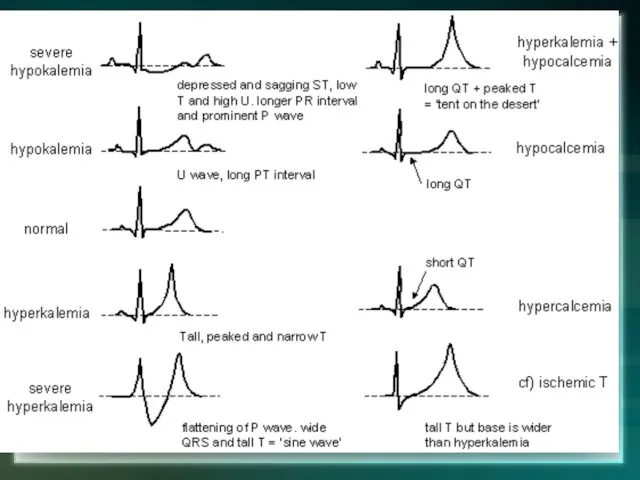
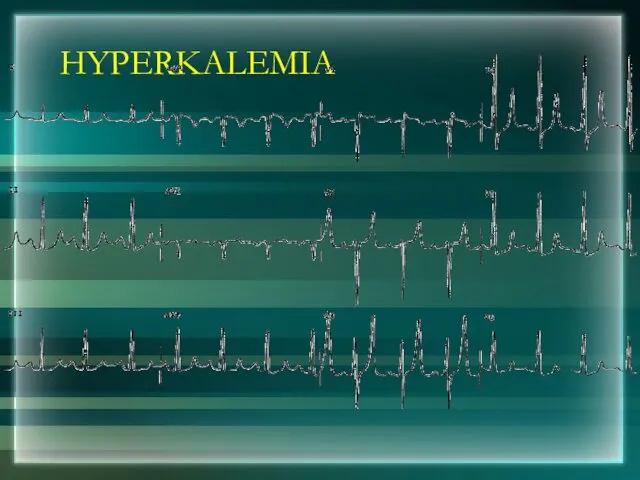
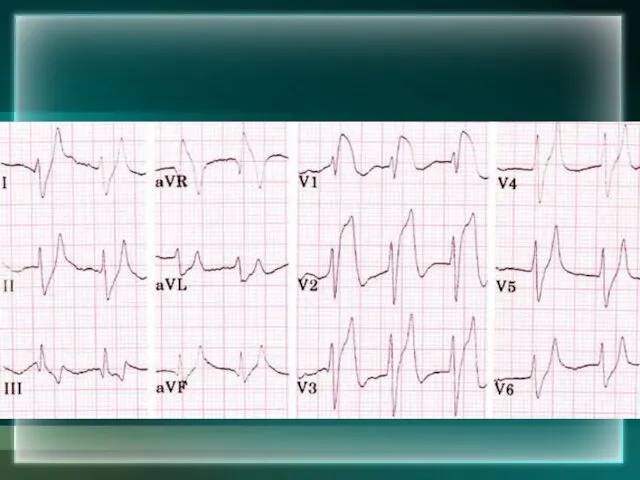
HYPERKALEMIA
HYPERKALEMIA
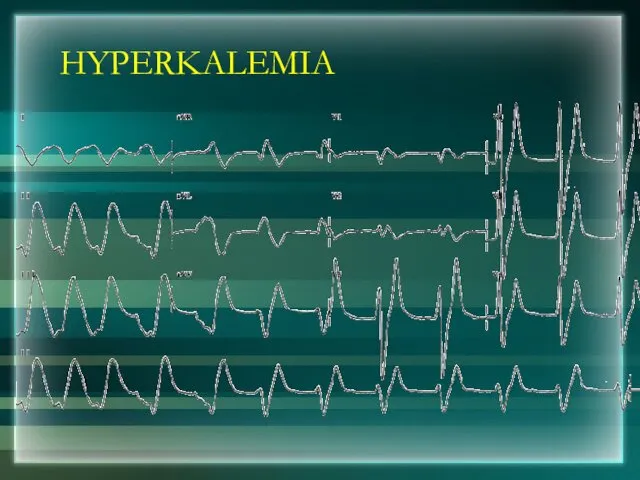
HYPERKALEMIA
HYPERKALEMIA
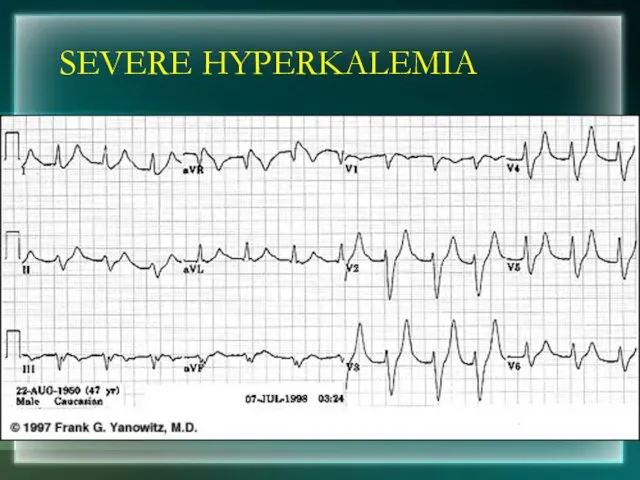
SEVERE HYPERKALEMIA
SEVERE HYPERKALEMIA
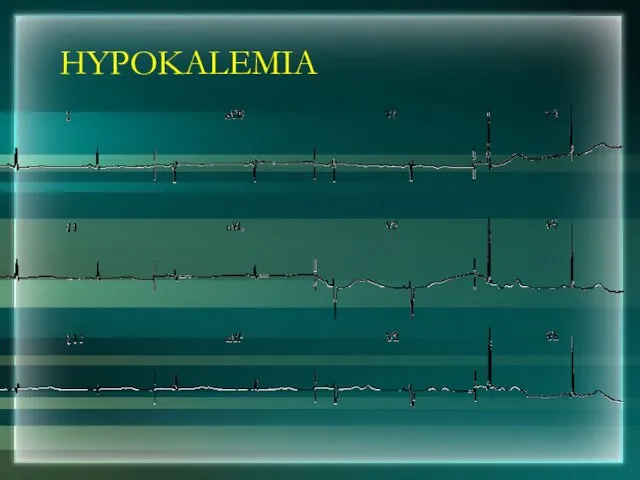
HYPOKALEMIA
HYPOKALEMIA
HYPOKALEMIA
HYPOKALEMIA
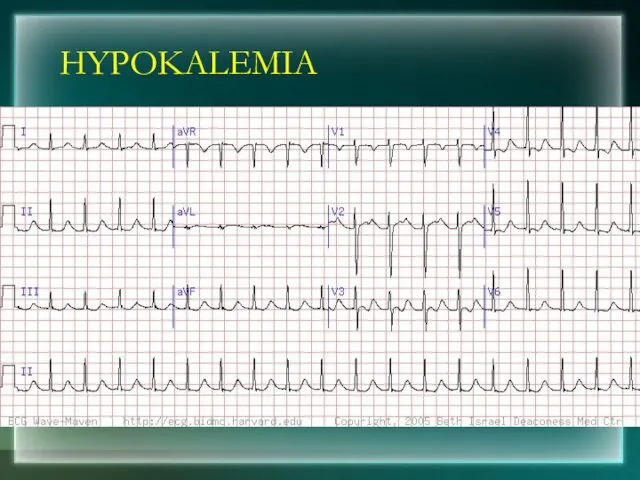
HYPOKALEMIA
HYPOKALEMIA
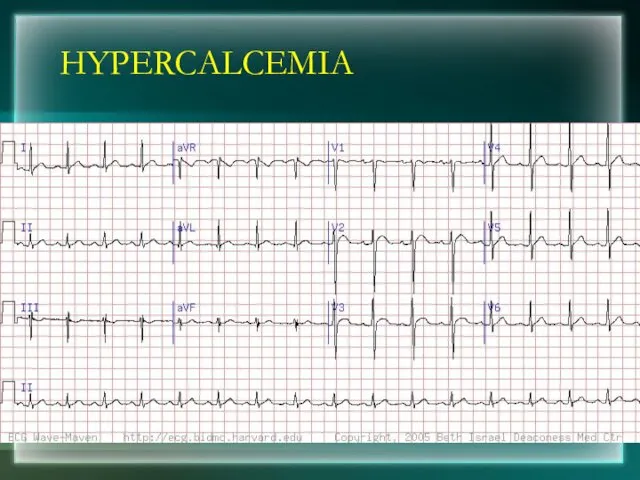
HYPERCALCEMIA
HYPERCALCEMIA
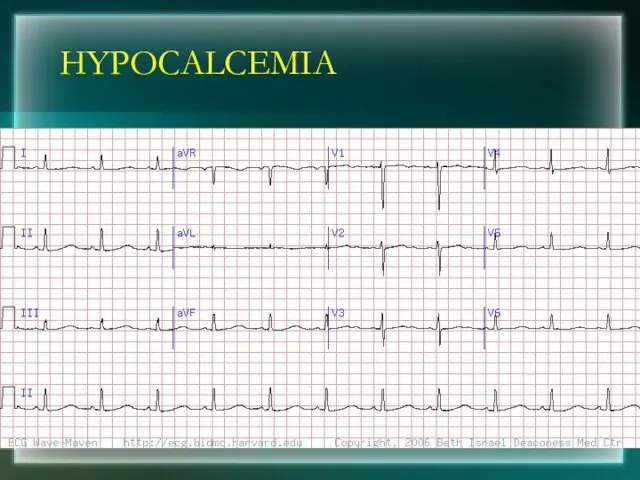
HYPOCALCEMIA
HYPOCALCEMIA
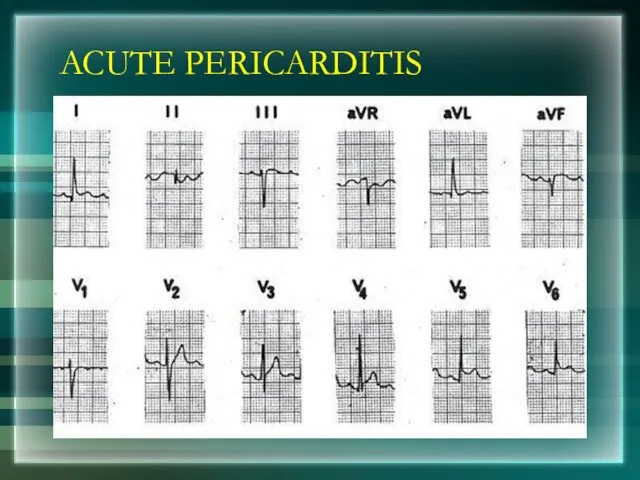
ACUTE PERICARDITIS
ACUTE PERICARDITIS
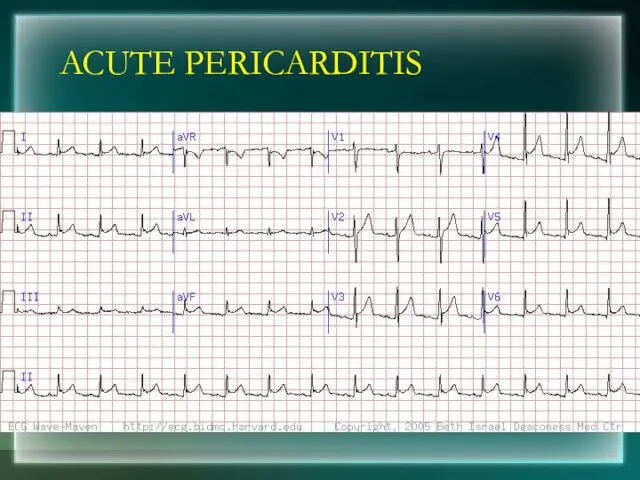
ACUTE PERICARDITIS
ACUTE PERICARDITIS
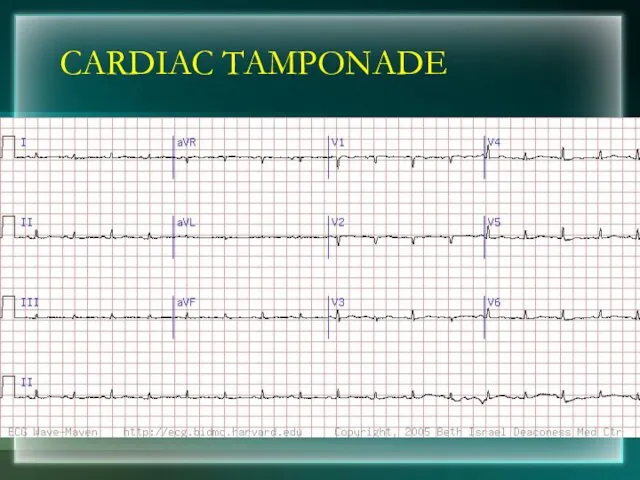
CARDIAC TAMPONADE
CARDIAC TAMPONADE
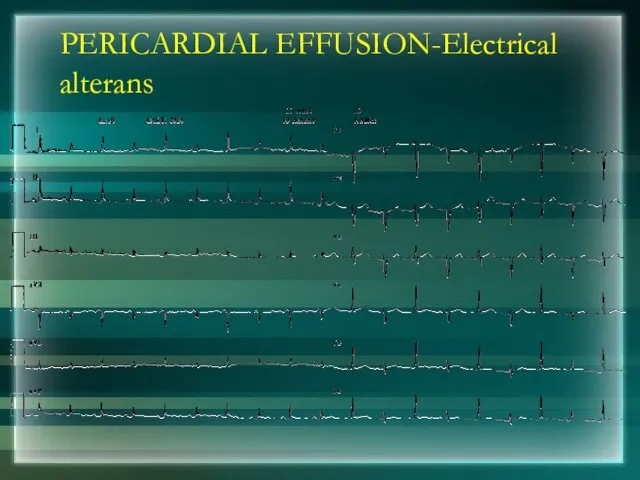
PERICARDIAL EFFUSION-Electrical alterans
PERICARDIAL EFFUSION-Electrical alterans
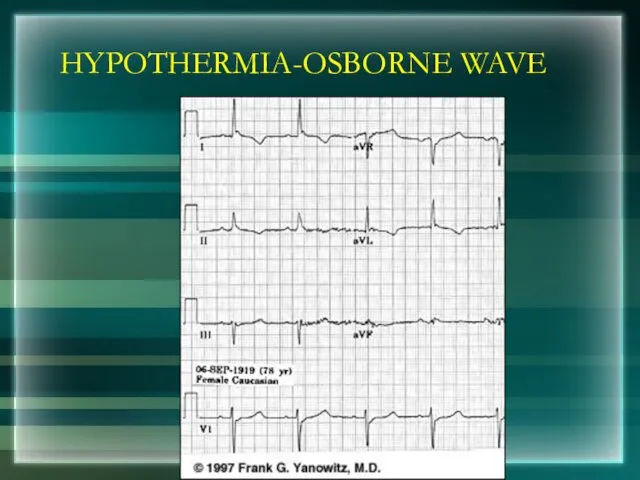
HYPOTHERMIA-OSBORNE WAVE
HYPOTHERMIA-OSBORNE WAVE
 Здоровое питание. Что такое здоровое питание?
 Пиелонефрит. Классификация
 Лечебно-профилактический уход при заболеваниях системы кровообращения у детей в амбулаторных условиях
 Ангиофарм. Обзор
 Желчнокаменная болезнь у детей
 Острые респираторные вирусные инфекции у детей
 Основы Лечебной физической культуры
 Мутационная теория онкогенеза
 Профилактика ОРВИ и гриппа
 Болезни слюнных желез
 Эпидемиология и диагностика туберкулеза. Пробное лечение, как метод диагностики
 Сахарный диабет
 Патогенна дія хімічних та біологічних факторів на організм. Роль спадковості в патології. (Лекція 4)
 Сұйық аққыш композиттер. Құрамы, қасиеті, артықшылығы мен кемшіліктері. Қолдану технологиясы
 Санитарно-гигиеническое обследование детского дошкольного учреждения с оформлением учебного акта обследования
 Особенности оказания сестринской помощи семье и пациенту с заболеваниеми сердечно-сосудистой системы
 Трофобластические опухоли матки
 Мозжечок
 Острая кишечная непроходимость
 кесарево Нургали Гаухар
 Учение об инфекции
 Вирусные диареи
 Некрозы. Гангрены. Язвы. Свищи
 Ортодонтияда иновациялық емдеу әдістері, инвизилайн (invisalign) жүйесі
 Очаговый туберкулез легких
 Қант диабеті кезіндегі лабораториялық зерттеулер
 Здоровые дети – счастливые родители
 Культурно-гигиенические навыки детей от 1 года до 7 лет