- Health insurance

Содержание
- 2. Two Comments First of two comments: From Princeton Economist Uwe Reinhardt: “Why does a country that
- 3. Two Comments Second comment: Most of us are not aware of the financial burden we bear
- 4. “The figures, released early Tuesday by the U.S. Census Bureau, show that 15.2% of Americans didn't
- 5. “Young adults were less likely than any other age group to have health insurance. Last year,
- 6. Mostly adults, not children – half are childless adults. What age group? Poor and near-poor –
- 7. Do the uninsured receive necessary health care?
- 8. Often No… Compared to the Insured Population, the Uninsured... Have higher rates of preventable and/or untreated
- 9. The Uninsured… Are not known to be a sicker or higher-cost population. Pay higher medical fees.
- 10. Health Insurance and the Consumer Role Consumers demand health insurance and often purchase it in markets
- 11. Key Definitions Moral hazard Health insurance affects consumer demand for health care – higher utilization of
- 12. The Demand for Health Insurance Why do consumers value health insurance? Illness, injury and disability are
- 13. What is Risk Aversion? A simple test to see if you are “risk adverse.” Which would
- 14. Private Market Insurance: A Simple Example Start with 100 middle-aged executives sent by XXumma Corp. to
- 15. Demand for Health Insurance Keys Presence of aversion makes consumers willing to pay to spread risk
- 16. Health Insurance Main Types Fee-for-service (indemnity) Managed care (pre-paid) Key Terms Deductible Copay/Coinsurance Stop Loss Limit
- 17. Insurance: Declining Block Pricing (Out-of-Pocket Spending)
- 18. Pricing Blocks: Deductibles, Copays and Limits
- 19. Question Why do we observe deductibles, co-pays, limits, and exclusions?
- 20. Moral Hazard and Demand
- 21. Practice Exercise What is the relationship between price elasticity of demand and size of the moral
- 22. Question: If you designed a health care plan… Hospital Care Surgical & in-hosp medical Outpatient doctor
- 23. Patterns of Insurance Coverage The losses that are insured are: large, infrequent, random, and not associated
- 24. Question You’re an insurance broker. Suppose the average health expenditure for an adult equals $6000. To
- 25. You be the benefit consultant Harvard University
- 26. Budget Problem 1994, Harvard University was facing a substantial deficit in the employee benefits budget. Offered
- 27. 1995, Harvard decide to contribute the same amount to employee plans regardless of which type they
- 28. Changes in Employee Premiums
- 29. Enrollment in the more generous, more expensive PPO plans decreased. What would you predict about the
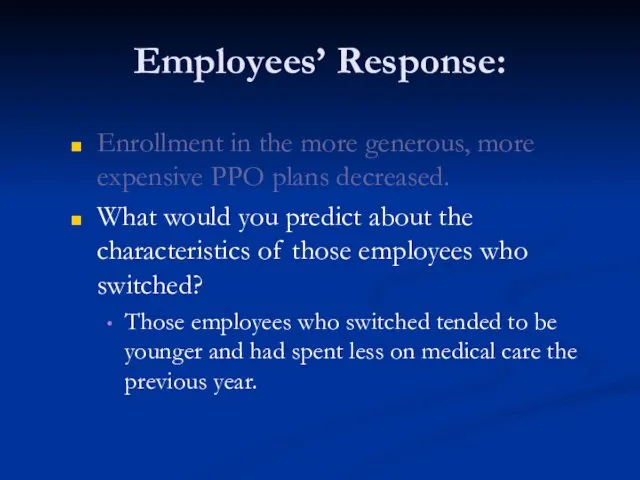
- 30. Enrollment in the more generous, more expensive PPO plans decreased. What would you predict about the
- 31. Final Results: Due to decreased enrollment, premiums for the high option PPO plans increased, making the
- 32. Plan Enrollment
- 33. A Game: Pick One of the Following 3 Opportunities: C1: $350 paid in cash C2: $1000
- 34. To Better Understand These Choices, It Helps to Know Your Risks Group insurance reduces “secondary risk.”
- 36. Adverse effects of adverse selection Start with a community-rated, self-pay health plan Community of four with
- 37. Percentage of Uninsured Workers Ages 18-64, by Firm Size (1997)
- 38. “Small-business profits are getting pinched because of price increases for employee health insurance. Among small companies
- 40. How to Price Insurance Policies? Premium = f ( Expected value of claims, loading costs ).
- 41. Typical Loading Fees by Group Size As a Percent of Benefits (Phelps, p. 343)
- 42. Question: Why is Small Group Health Insurance So Expensive? Per capita loading costs decrease as firm
- 43. Do People Choose to Die? Actuaries have found that statistically people who buy life insurance are
- 44. Possible Solutions to the Adverse Selection Problem? Waiting periods Preexisting condition exclusions Risk rating (underwriting) Insurance
- 46. Скачать презентацию
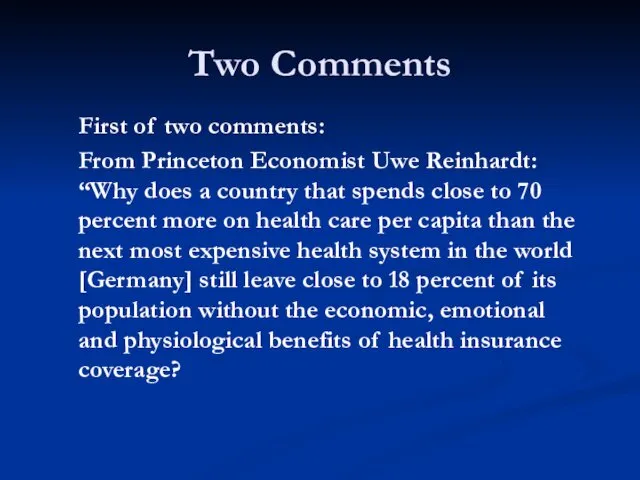
Two Comments
First of two comments:
From Princeton Economist Uwe Reinhardt: “Why
Two Comments
First of two comments:
From Princeton Economist Uwe Reinhardt: “Why
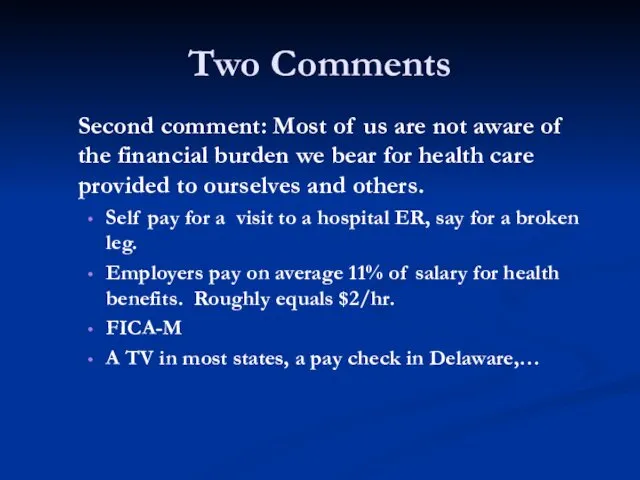
Two Comments
Second comment: Most of us are not aware of the
Two Comments
Second comment: Most of us are not aware of the
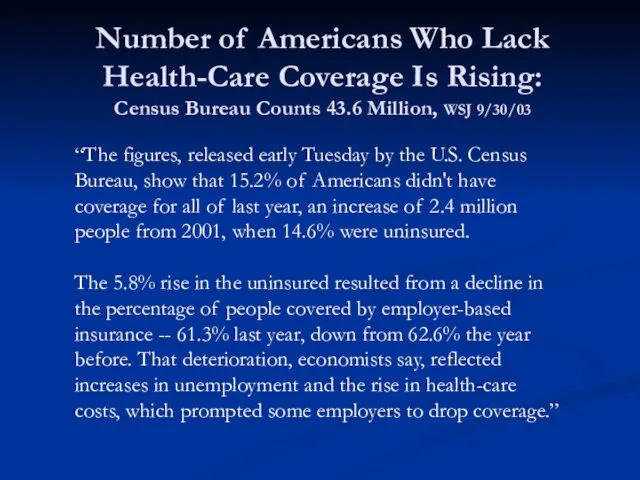
“The figures, released early Tuesday by the U.S. Census Bureau, show
“The figures, released early Tuesday by the U.S. Census Bureau, show
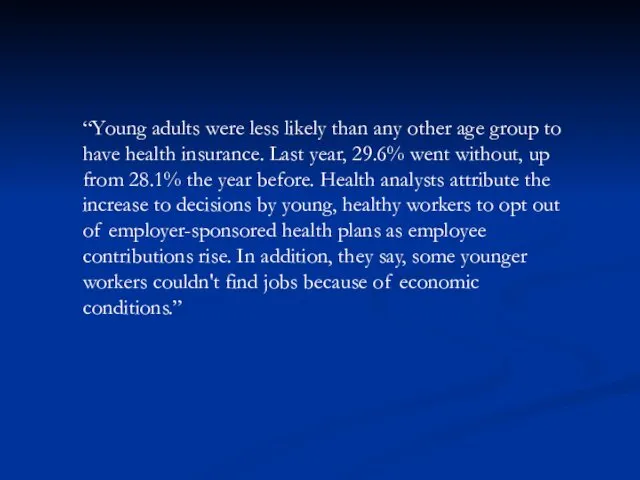
“Young adults were less likely than any other age group to
“Young adults were less likely than any other age group to
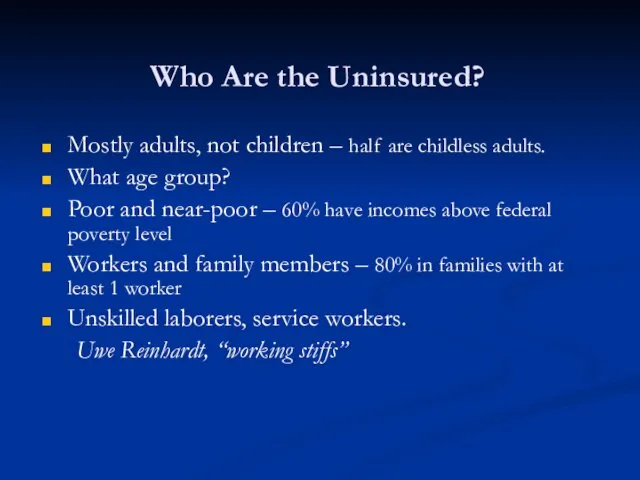
Mostly adults, not children – half are childless adults.
What age group?
Mostly adults, not children – half are childless adults.
What age group?
Do the uninsured receive necessary health care?
Do the uninsured receive necessary health care?
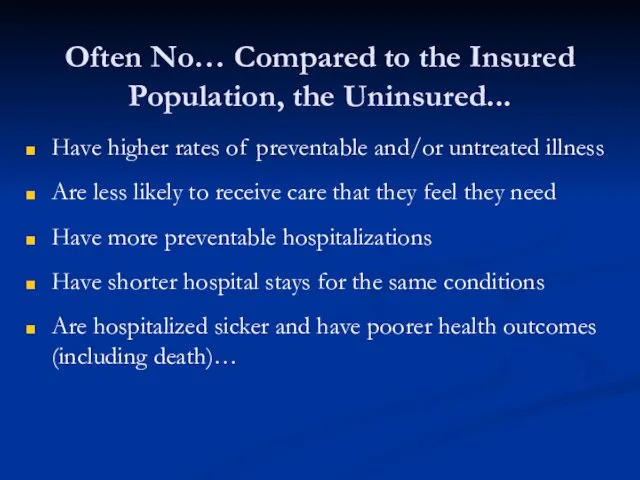
Often No… Compared to the Insured Population, the Uninsured...
Have higher rates
Often No… Compared to the Insured Population, the Uninsured...
Have higher rates
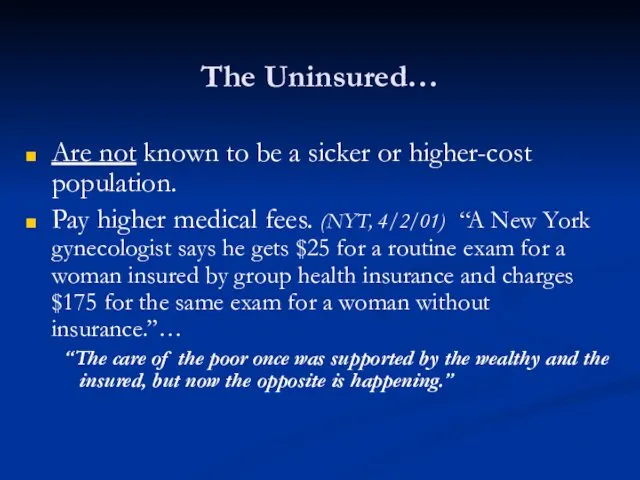
The Uninsured…
Are not known to be a sicker or higher-cost population.
The Uninsured…
Are not known to be a sicker or higher-cost population.
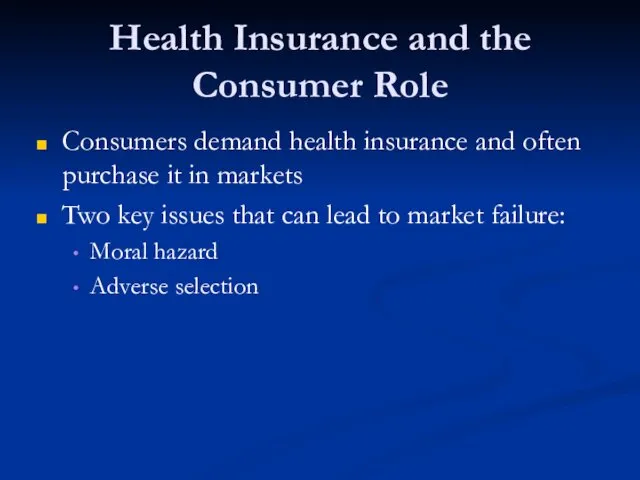
Health Insurance and the Consumer Role
Consumers demand health insurance and often
Health Insurance and the Consumer Role
Consumers demand health insurance and often
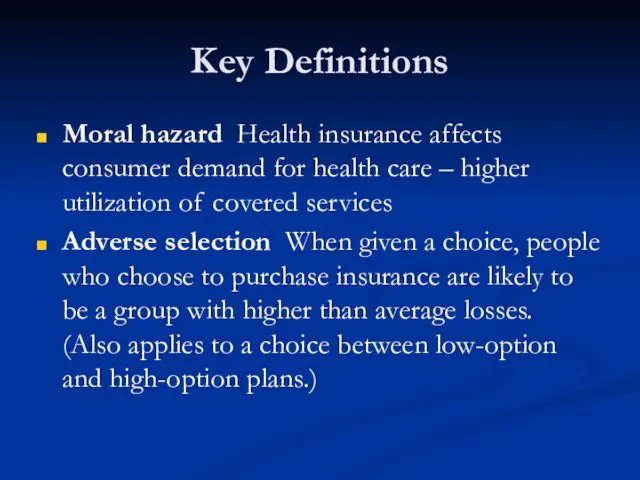
Key Definitions
Moral hazard Health insurance affects consumer demand for health care
Key Definitions
Moral hazard Health insurance affects consumer demand for health care
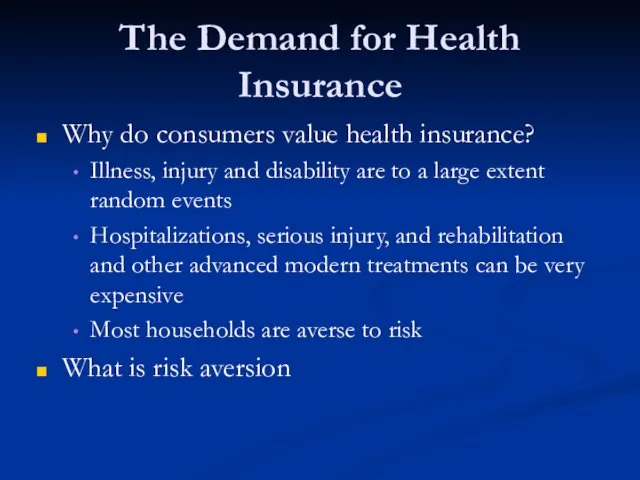
The Demand for Health Insurance
Why do consumers value health insurance?
Illness, injury
The Demand for Health Insurance
Why do consumers value health insurance?
Illness, injury
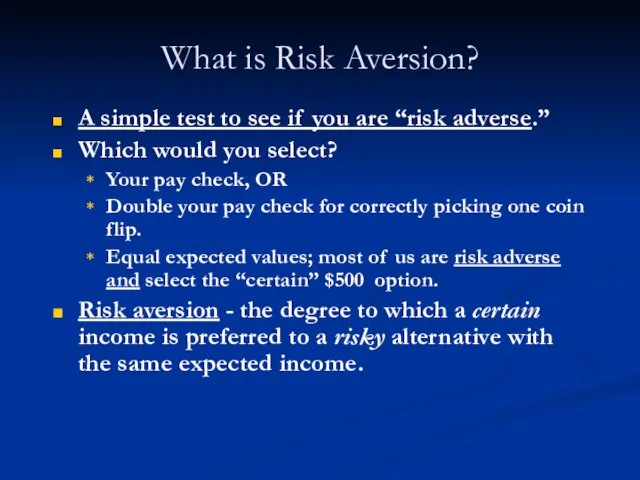
What is Risk Aversion?
A simple test to see if you
What is Risk Aversion?
A simple test to see if you
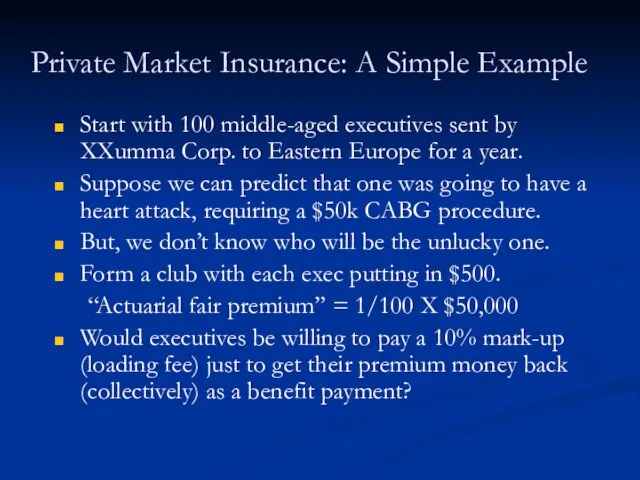
Private Market Insurance: A Simple Example
Start with 100 middle-aged executives
Private Market Insurance: A Simple Example
Start with 100 middle-aged executives
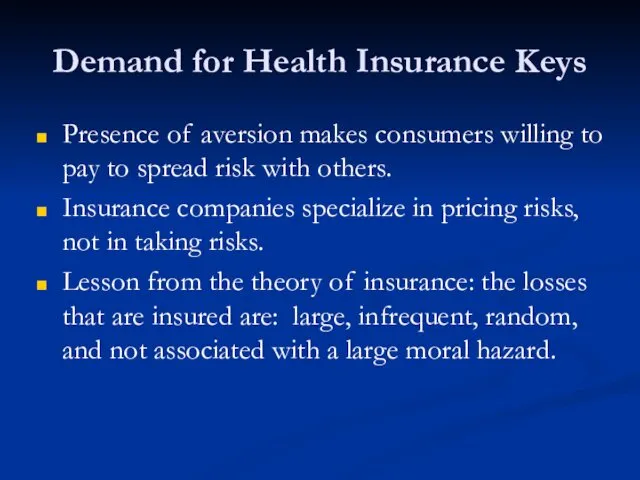
Demand for Health Insurance Keys
Presence of aversion makes consumers willing to
Demand for Health Insurance Keys
Presence of aversion makes consumers willing to
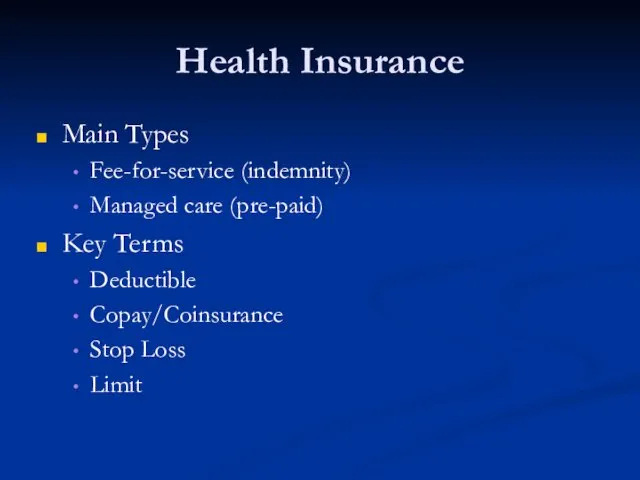
Health Insurance
Main Types
Fee-for-service (indemnity)
Managed care (pre-paid)
Key Terms
Deductible
Copay/Coinsurance
Stop Loss
Limit
Health Insurance
Main Types
Fee-for-service (indemnity)
Managed care (pre-paid)
Key Terms
Deductible
Copay/Coinsurance
Stop Loss
Limit
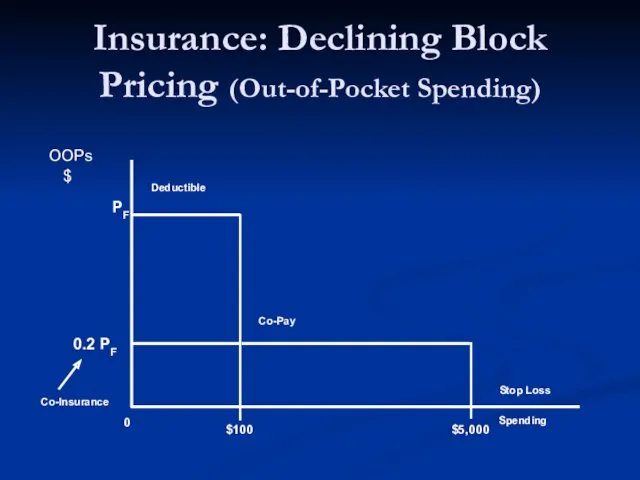
Insurance: Declining Block Pricing (Out-of-Pocket Spending)
Insurance: Declining Block Pricing (Out-of-Pocket Spending)
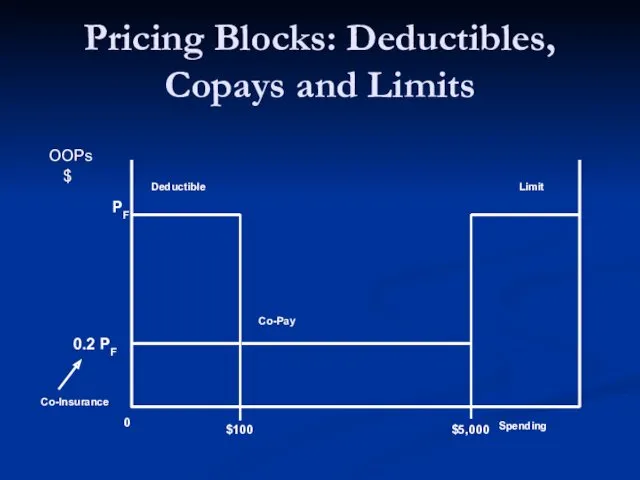
Pricing Blocks: Deductibles, Copays and Limits
Pricing Blocks: Deductibles, Copays and Limits
Question
Why do we observe deductibles, co-pays, limits, and exclusions?
Question
Why do we observe deductibles, co-pays, limits, and exclusions?
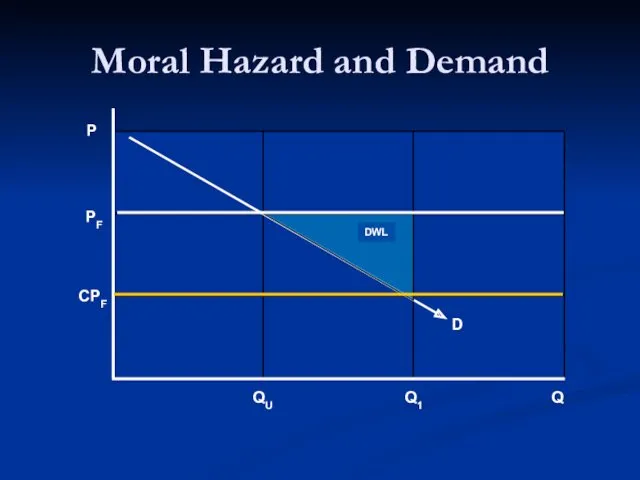
Moral Hazard and Demand
Moral Hazard and Demand
Practice Exercise
What is the relationship between price elasticity of demand and
Practice Exercise
What is the relationship between price elasticity of demand and
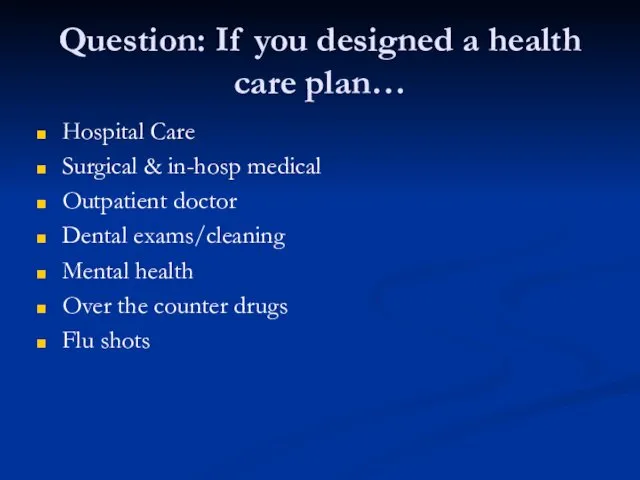
Question: If you designed a health care plan…
Hospital Care
Surgical & in-hosp
Question: If you designed a health care plan…
Hospital Care
Surgical & in-hosp
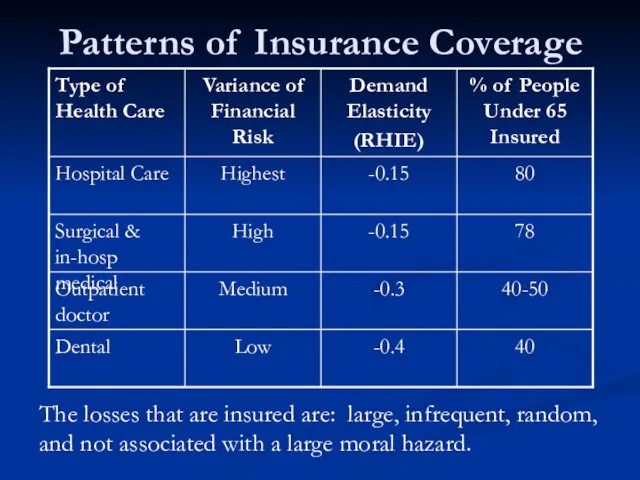
Patterns of Insurance Coverage
The losses that are insured are: large, infrequent,
Patterns of Insurance Coverage
The losses that are insured are: large, infrequent,
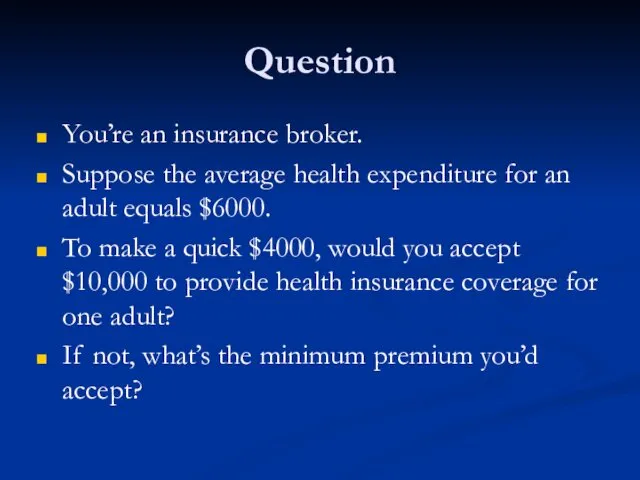
Question
You’re an insurance broker.
Suppose the average health expenditure for an
Question
You’re an insurance broker.
Suppose the average health expenditure for an

You be the benefit consultant
Harvard University
You be the benefit consultant
Harvard University
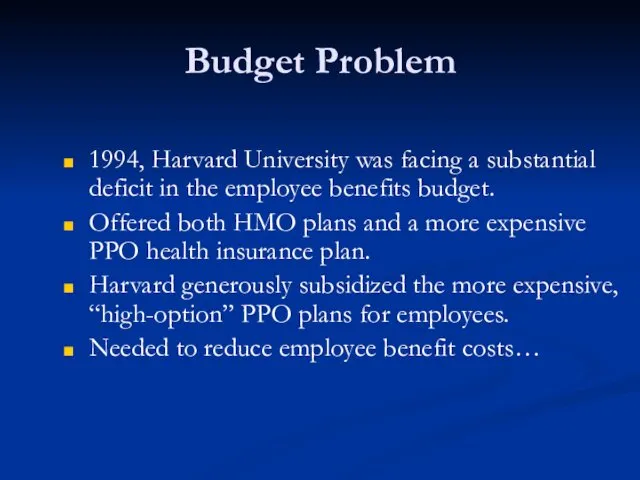
Budget Problem
1994, Harvard University was facing a substantial deficit in the
Budget Problem
1994, Harvard University was facing a substantial deficit in the
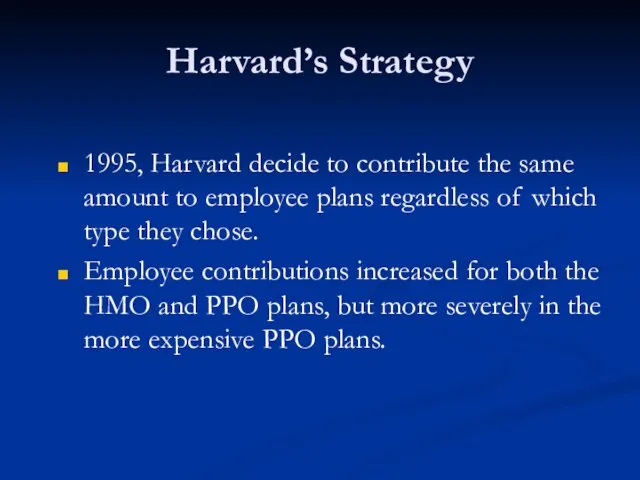
1995, Harvard decide to contribute the same amount to employee plans
1995, Harvard decide to contribute the same amount to employee plans
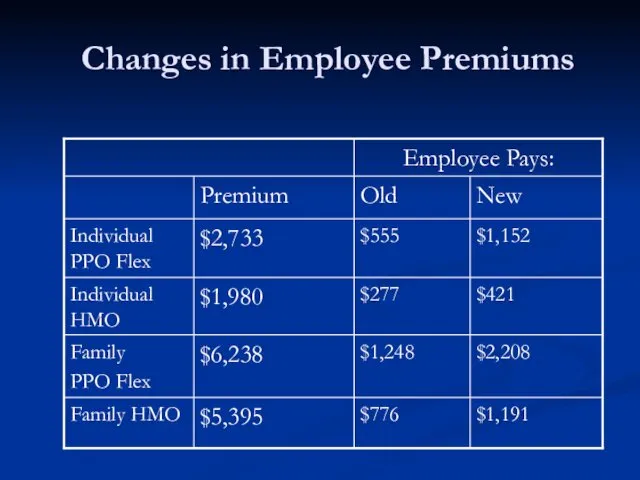
Changes in Employee Premiums
Changes in Employee Premiums
Enrollment in the more generous, more expensive PPO plans decreased.
What would
Enrollment in the more generous, more expensive PPO plans decreased.
What would
Enrollment in the more generous, more expensive PPO plans decreased.
What would
Enrollment in the more generous, more expensive PPO plans decreased.
What would
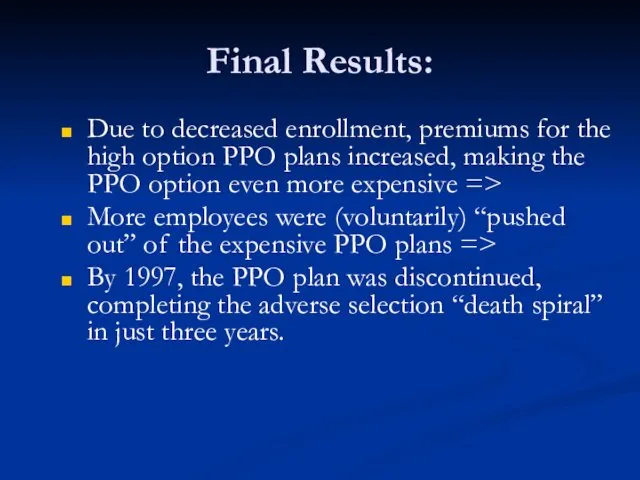
Final Results:
Due to decreased enrollment, premiums for the high option PPO
Final Results:
Due to decreased enrollment, premiums for the high option PPO
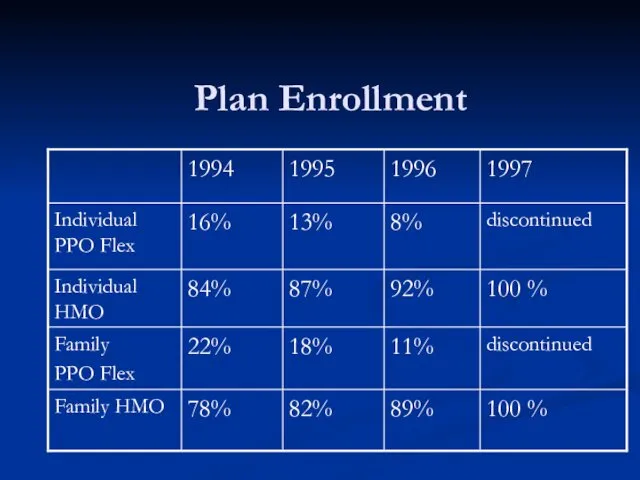
Plan Enrollment
Plan Enrollment

A Game: Pick One of the Following 3 Opportunities:
C1: $350 paid
A Game: Pick One of the Following 3 Opportunities:
C1: $350 paid
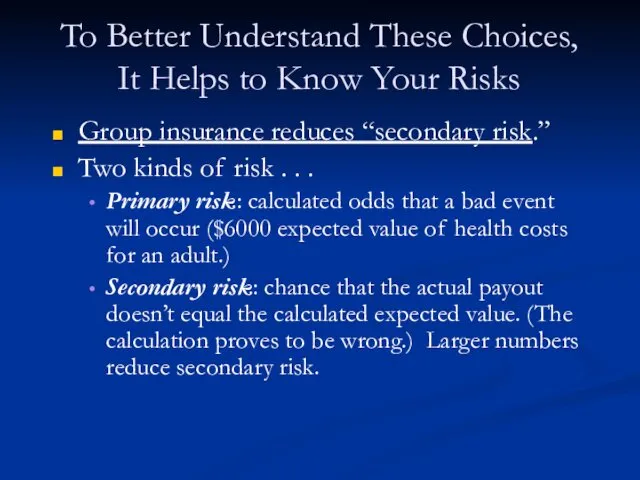
To Better Understand These Choices, It Helps to Know Your Risks
To Better Understand These Choices, It Helps to Know Your Risks

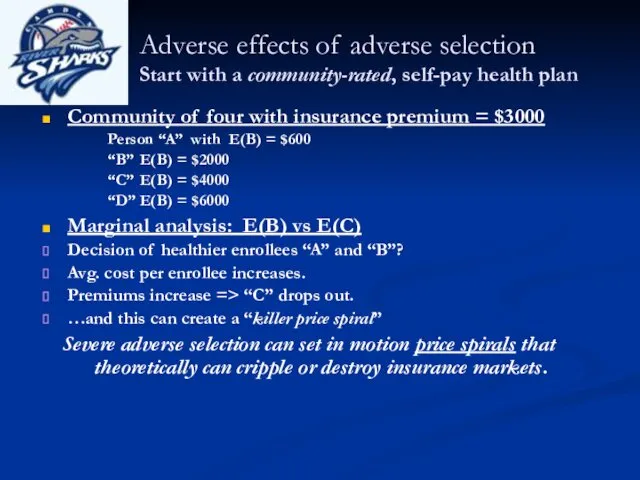
Adverse effects of adverse selection
Start with a community-rated, self-pay health plan
Community
Adverse effects of adverse selection
Start with a community-rated, self-pay health plan
Community
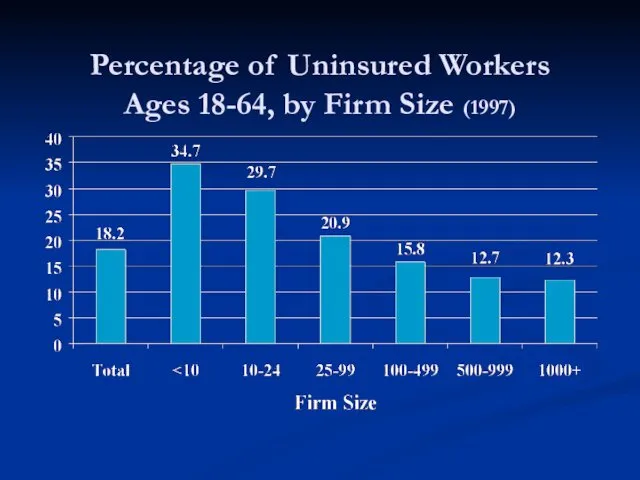
Percentage of Uninsured Workers
Ages 18-64, by Firm Size (1997)
Percentage of Uninsured Workers
Ages 18-64, by Firm Size (1997)
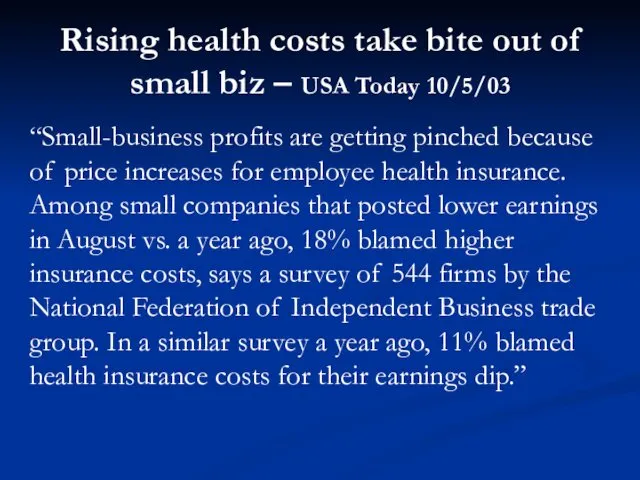
“Small-business profits are getting pinched because of price increases for employee
“Small-business profits are getting pinched because of price increases for employee
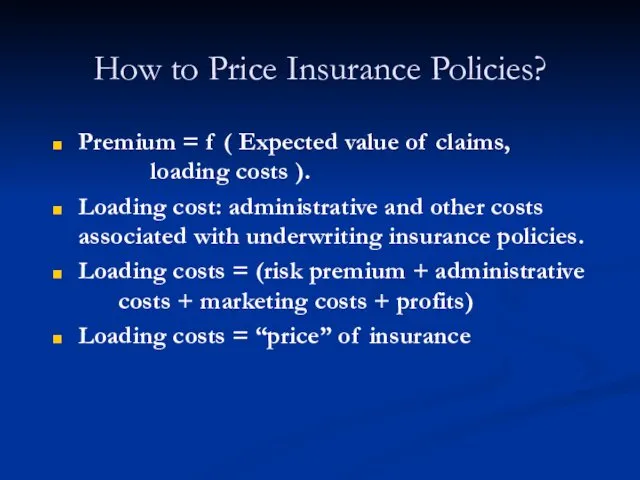
How to Price Insurance Policies?
Premium = f ( Expected value
How to Price Insurance Policies?
Premium = f ( Expected value
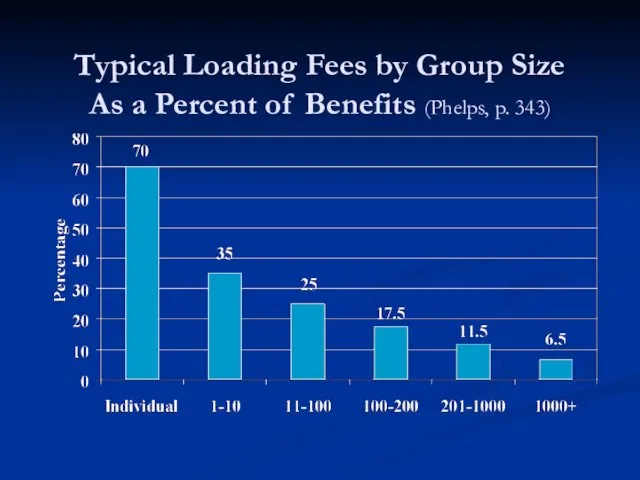
Typical Loading Fees by Group Size
As a Percent of Benefits
Typical Loading Fees by Group Size As a Percent of Benefits
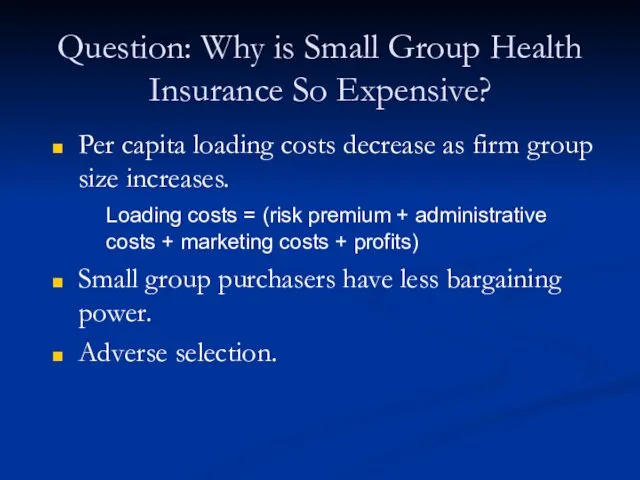
Question: Why is Small Group Health Insurance So Expensive?
Per capita
Question: Why is Small Group Health Insurance So Expensive?
Per capita
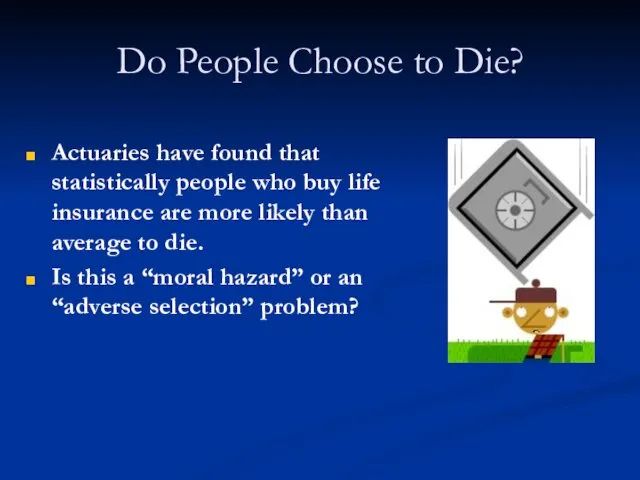
Do People Choose to Die?
Actuaries have found that statistically people who
Do People Choose to Die?
Actuaries have found that statistically people who
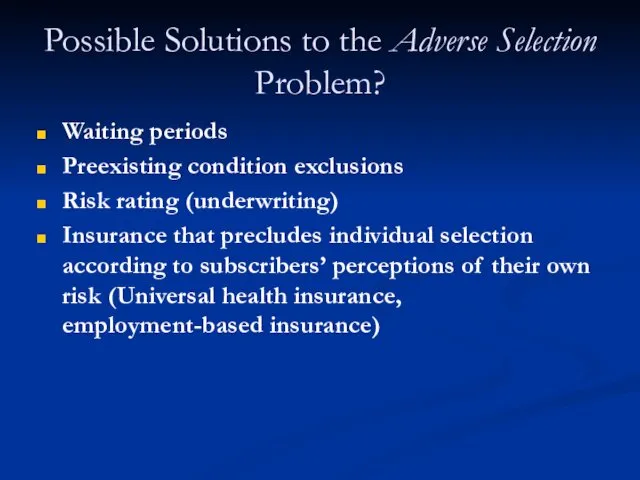
Possible Solutions to the Adverse Selection Problem?
Waiting periods
Preexisting condition exclusions
Possible Solutions to the Adverse Selection Problem?
Waiting periods
Preexisting condition exclusions
 Фармакотерапия коронавирусной инфекции (covid – 19) в условиях стационаре
 Нейролептический синдром. Его клиника и купирование
 Эпилепсия. Первая помощь во время приступов эпилепсии
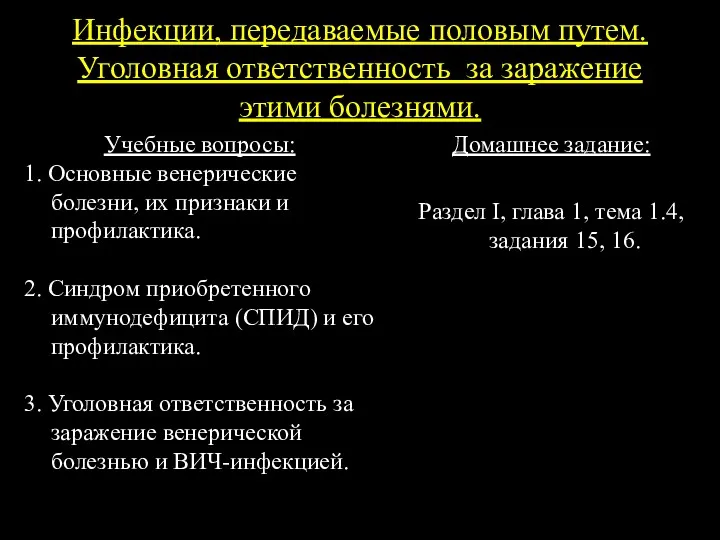 Инфекции, передаваемые половым путем. Уголовная ответственность за заражение этими болезнями
 Экопаталогии. Экология человека
 Вавилов Сергей Иванұлының өмірі
 Противоаритмические лекарственные средства
 Санитарно – противоэпидемический режим медицинской организации (тема 3)
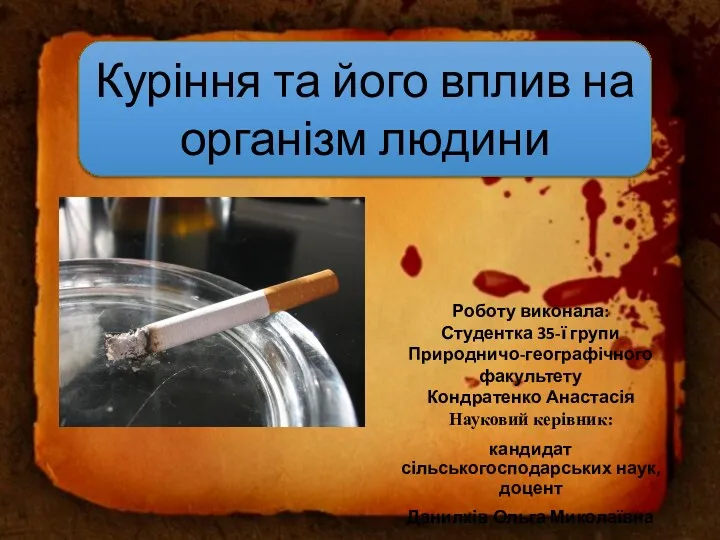 Куріння та його вплив на організм людини
 Ортопедиялық стоматологиядағы аурулардың халықаралық жіктемесі
 Гормональная контрацепция
 Переломы верхней челюсти. Анатомия верхней челюсти
 Шляхи і проблеми в створенні оригінальних лікарських засобів в Україні
 Алкогольдің ұрыққа әсері
 Неспецифические воспалительные заболевания в гинекологии
 Витамины. Классификация витаминов
 Сальмонеллёзы. Этиология
 Лечение генерализованных пародонтитов
 Консультация учителя-дефектолога: Основные направления коррекционной работы по исправлению недостатков звукопроизношения
 Системная красная волчанка
 Синдром длительного сдавления
 Эпидемиология, клиника, ранняя диагностика и профилактика туберкулёза
 Остеохондроз шейного отдела позвоночника
 Эндодонтические инструменты
 Жартылай алмалы пластиналы протез
 Вспомогательные репродуктивные технологии
 Проблема гиподинамии у студентов РЭУ
 Недоношенный ребенок – особенности ухода. Ранняя реабилитация недоношенного новорожденного