- Primary care strategic plan and implementation blueprint

Содержание
- 2. The strategic plan deliverable covers the content specified in the project milestone plan Overview of deliverable
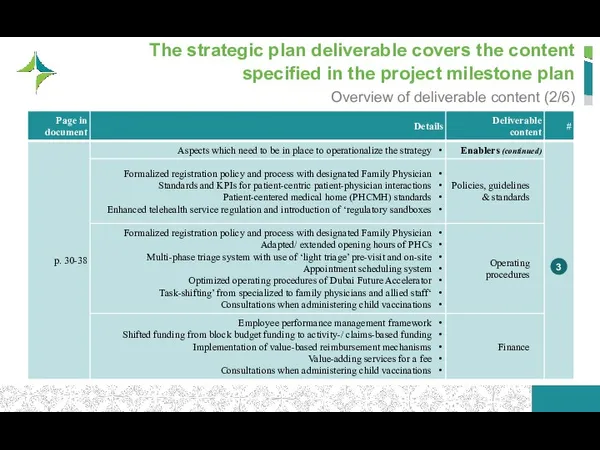
- 3. The strategic plan deliverable covers the content specified in the project milestone plan Overview of deliverable
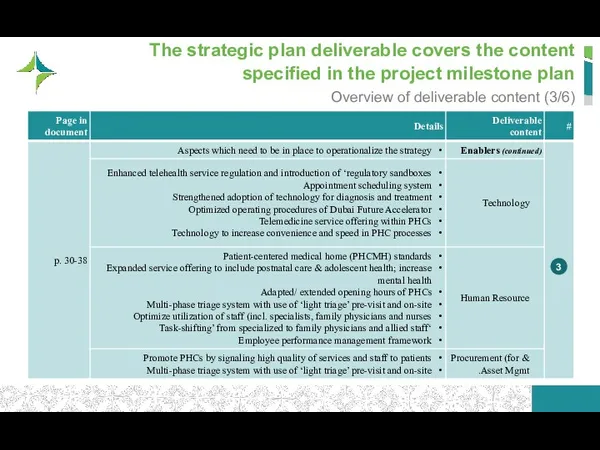
- 4. The strategic plan deliverable covers the content specified in the project milestone plan Overview of deliverable
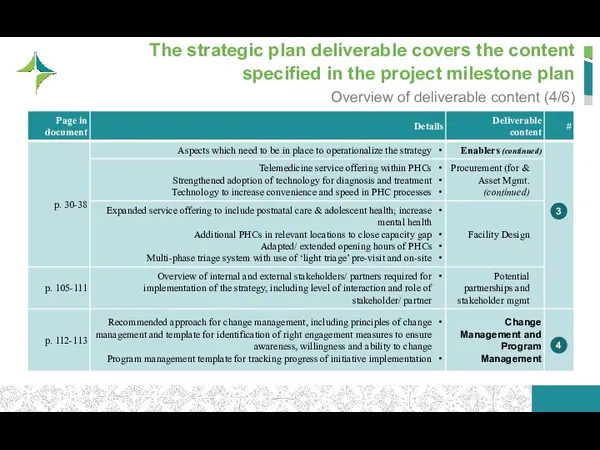
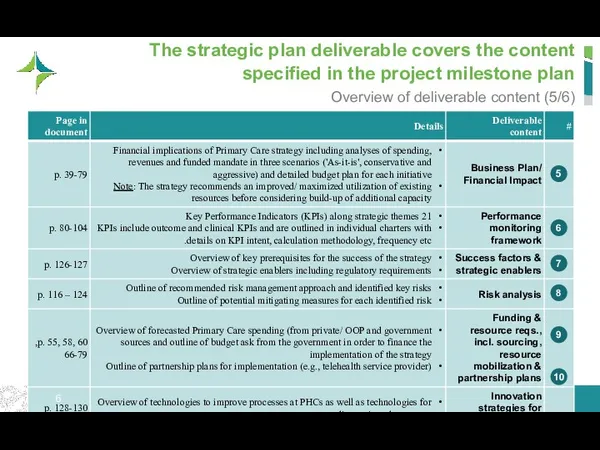
- 5. The strategic plan deliverable covers the content specified in the project milestone plan Overview of deliverable
- 6. The strategic plan deliverable covers the content specified in the project milestone plan Overview of deliverable
- 7. In addition to the requirements in the milestone plan, the strategy provides further value-adding content &
- 8. Table of Contents Strategy Plan Patient Journeys Initiatives for Implementation Business Case/ Financial Impact Performance monitoring
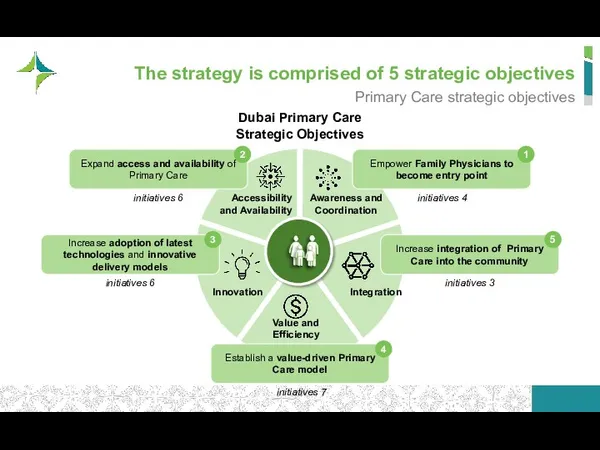
- 9. The Primary Care strategy is based on a mission and cascades to themes, strategic objectives, and
- 10. A mission statement was selected for the Primary Care strategy from various potential options Mission statement
- 11. Five themes holistically outline the gaps identified in the baselining and benchmarking assessment Primary Care themes
- 12. To remedy the limited and undirected use of PHC services, PHC should focus on fostering awareness
- 13. PHCs can increase service offering: 45% of patients indicate a preference for larger services scope Limited
- 14. To evolve in terms of process and technology, PHC should increase its focus on innovation Details
- 15. Compared to benchmarks PHCs over-rely on specialists (e.g., in maternal and child health) Primary Care is
- 16. Primary Care integration into the community should be promoted to address limited involvement today Details of
- 17. Thus, the target state of PHC is coordinated, accessible, innovative, value-driven, and integrated Characteristics of target
- 18. Table of Contents Strategy Plan Patient Journeys Initiatives for Implementation Business Case/ Financial Impact Performance monitoring
- 19. Five patient journeys were developed to illustrate the target state Target state patient journey personas
- 20. In his patient journey, John became aware of Primary Care as an entry point and had
- 21. In the current state, John’s journey was not as patient-centric and his relationship to his doctor
- 22. Mohamad’s journey is fully enabled by innovative technology Mohamad’s patient journey Mohamad tech-savvy 27 years old
- 23. In the current state, Mohamad’s patient journey is not supported by innovation Mohamad’s patient journey –
- 24. Samira receives care by her family doctor throughout her whole pregnancy Samira’s patient journey Samira pregnant
- 25. Currently, maternity and child services are only partially provided by the family physician; continuity is limited
- 26. The use of a multi-stage triage facilitates Omar’s journey during an urgent medical need Omar’s patient
- 27. Lack of formal triage would lead to suboptimal care for Omar in the current state Omar’s
- 28. Mariam’s specific adolescent health needs are met in the PHC by offering low-threshold services for adolescents
- 29. Mariam’s specific adolescent health needs are met in the PHC by offering low-threshold services for adolescents
- 30. Table of Contents Strategy Plan Patient Journeys Initiatives for Implementation Business Case/ Financial Impact Performance monitoring
- 31. The strategy is comprised of 5 strategic objectives Primary Care strategic objectives Dubai Primary Care Strategic
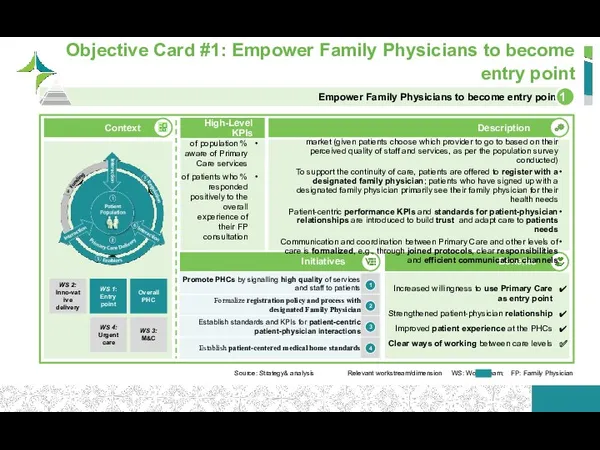
- 32. Increased willingness to use Primary Care as entry point Strengthened patient-physician relationship Improved patient experience at
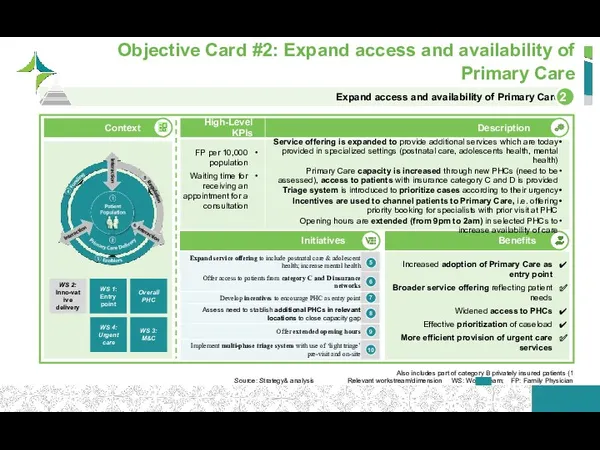
- 33. Increased adoption of Primary Care as entry point Broader service offering reflecting patient needs Widened access
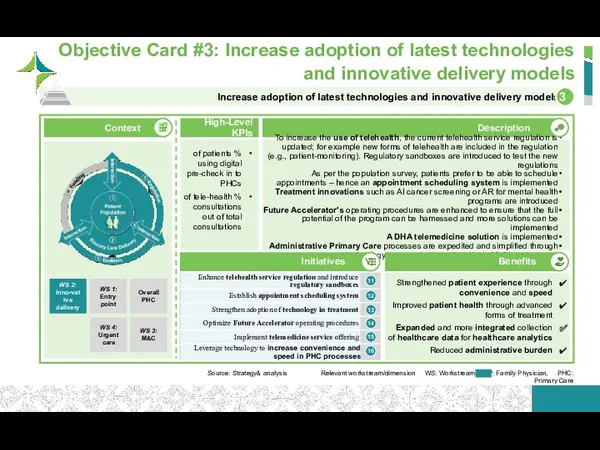
- 34. Description High-Level KPIs Strengthened patient experience through convenience and speed Improved patient health through advanced forms
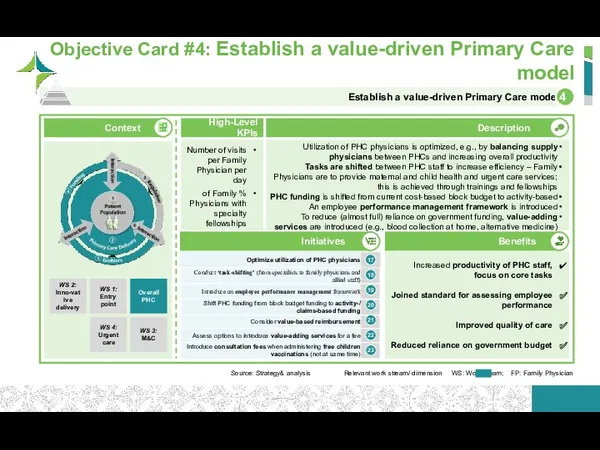
- 35. Description Objective Card #4: Establish a value-driven Primary Care model Source: Strategy& analysis Relevant work stream/
- 36. Social services are included in the design and delivery of Primary Care, meaning that DHA engages
- 37. Overview of strategic objectives and their corresponding strategic initiatives Strategic initiatives (1/2) 1 2 3 4
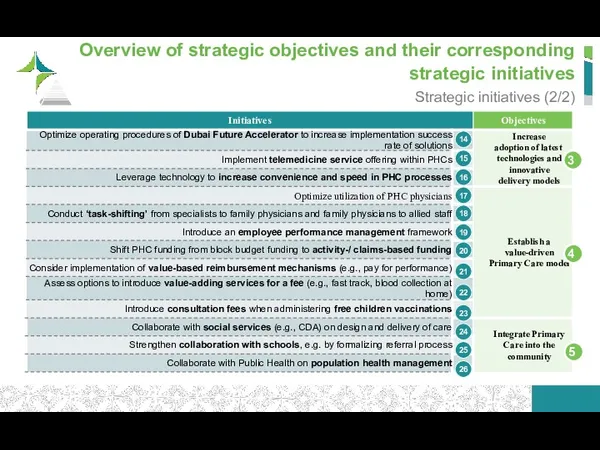
- 38. Overview of strategic objectives and their corresponding strategic initiatives Strategic initiatives (2/2) 3 4 5 14
- 39. Table of Contents Strategy Plan Patient Journeys Initiatives for Implementation Business Case/ Financial Impact Performance monitoring
- 40. The financial model of the strategy used several sources of input, and the findings were validated
- 41. 2017 to 2025 – Strategy Scenario (Aggressive) 2017 to 2025 – Strategy Scenario (Conservative) 2017 to
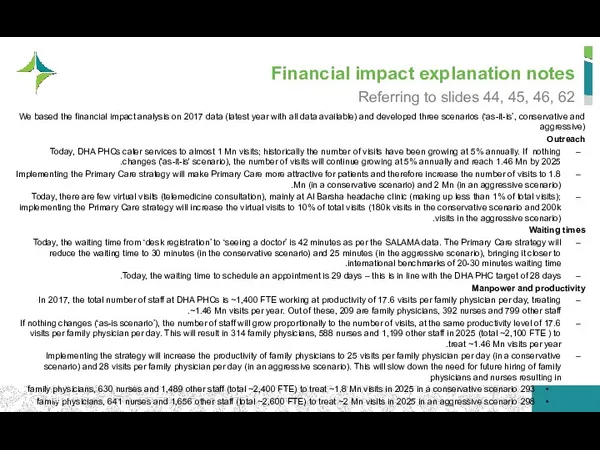
- 42. Financial impact explanation notes We based the financial impact analysis on 2017 data (latest year with
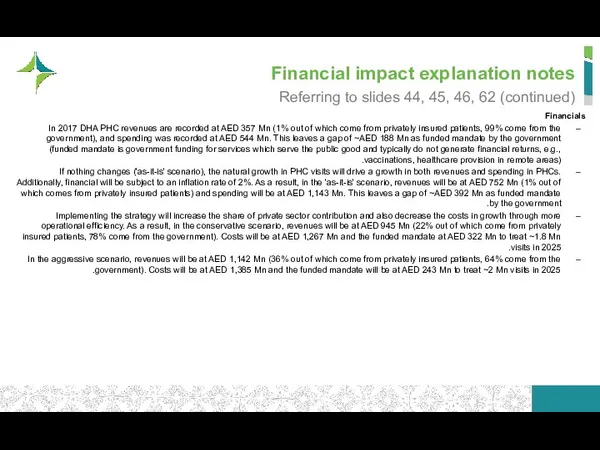
- 43. Financial impact explanation notes Financials In 2017 DHA PHC revenues are recorded at AED 357 Mn
- 44. In 2017, primary care at DHA caters to ~1 Mn visits using ~1,400 employees PHC metrics
- 45. Should nothing be done, the visits and manpower will grow, resulting in a higher government funded
- 46. The strategy will improve access to care and value for money, to lower the government funded
- 47. In summary, the strategy aims to double the number of visits, yet achieve a 20% reduction
- 48. The PHC strategy aims to increase outreach, making PHCs the cornerstone of the healthcare system Patient
- 49. Financial impact explanation notes Expected spending of DHA PHCs on 2025 after implementation of the strategy
- 50. The government funded mandate will be reduced to ~326 Mn through the levers of the strategy
- 51. Improved staff productivity will lead to ~106 Mn annual savings in 2025 for the PHC spending
- 52. In addition, the adoption of telehealth generates a saving of 80 Mn in 2015 Population survey
- 53. Revenues from privately insured and out of pocket patients amount to AED 151 Mn, ~17% of
- 54. Revenues from value-add services will amount to an additional 60 Mn Revenue from providing additional services
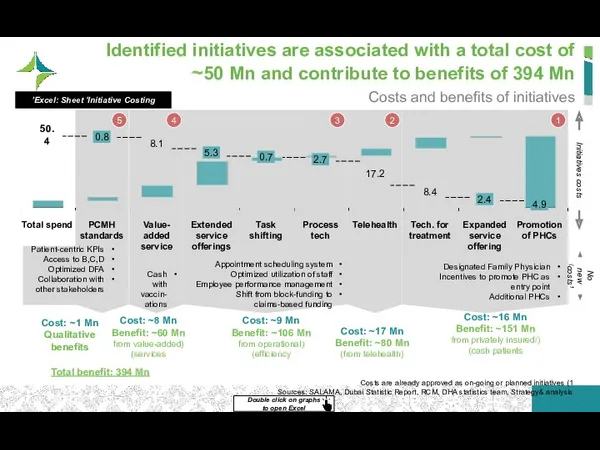
- 55. 2 Identified initiatives are associated with a total cost of ~50 Mn and contribute to benefits
- 56. In addition to the increased access to care and value for money, the strategy will provide
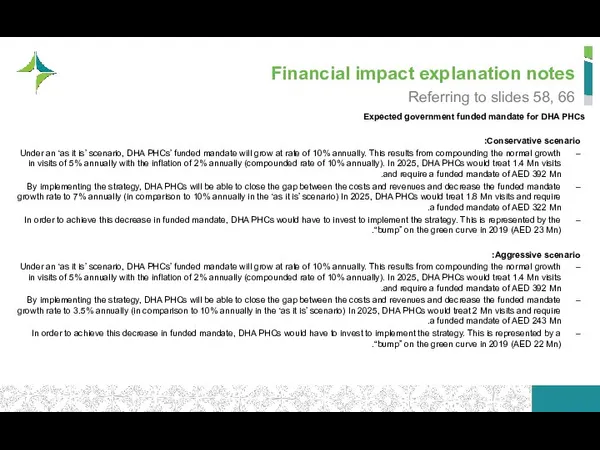
- 57. Financial impact explanation notes Expected government funded mandate for DHA PHCs Conservative scenario: Under an ‘as
- 58. In summary, the strategy increases outreach and patient happiness, and achieves a reduction in the funded
- 59. The strategy will increase revenue per visit and decrease cost per visit, thus pulling the govt.
- 60. Our ask is for an additional budget of AED 25 Mn for 2019, in order to
- 61. In more aggressive scenario, we convert more A&B patients and double-down on manpower efficiency Aggressive scenario
- 62. The strategy will improve access to care and value for money, to lower the government funded
- 63. The government funded mandate will be reduced to ~245 Mn through the levers of the strategy
- 64. Revenues from privately insured and out of pocket patients amount to AED 319 Mn, ~30% of
- 65. The strategy will increase revenue per visit and decrease cost per visit, thus pulling the govt.
- 66. In summary, the strategy increases outreach and patient happiness, and achieves a reduction in the funded
- 67. Yearly view on Primary Care key metrics Key metrics 2019- 2025 Excel: Sheet ‘Target State’ and
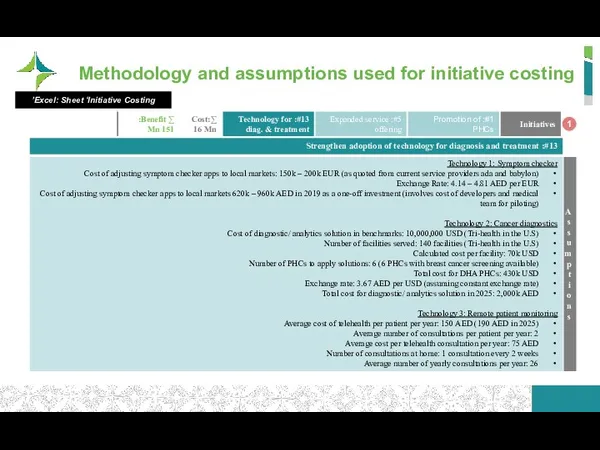
- 68. Methodology and assumptions used for initiative costing 1 Excel: Sheet ‘Initiative Costing’
- 69. Methodology and assumptions used for initiative costing 1 Excel: Sheet ‘Initiative Costing’
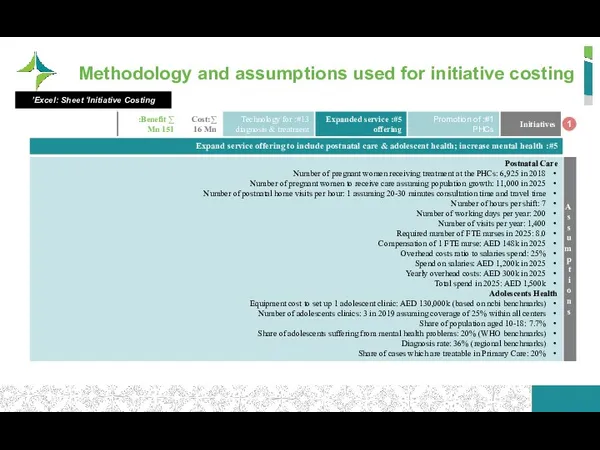
- 70. Methodology and assumptions used for initiative costing 1 Excel: Sheet ‘Initiative Costing’
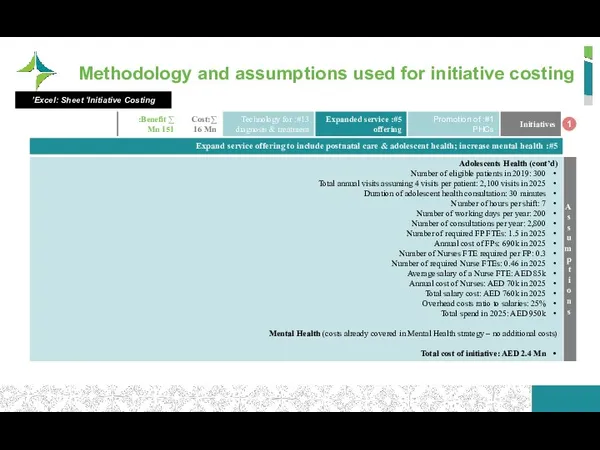
- 71. Methodology and assumptions used for initiative costing 1 Excel: Sheet ‘Initiative Costing’
- 72. Methodology and assumptions used for initiative costing 1 Excel: Sheet ‘Initiative Costing’
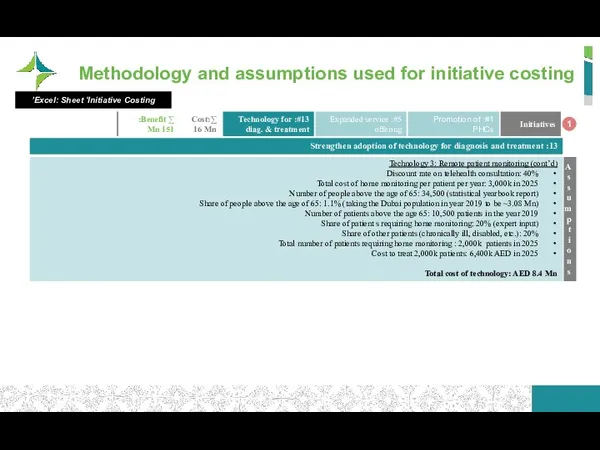
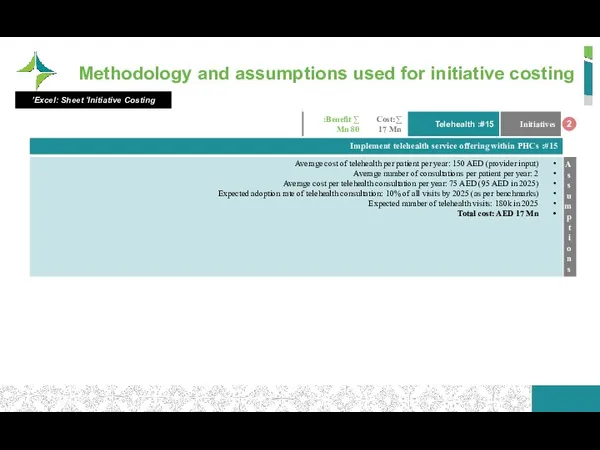
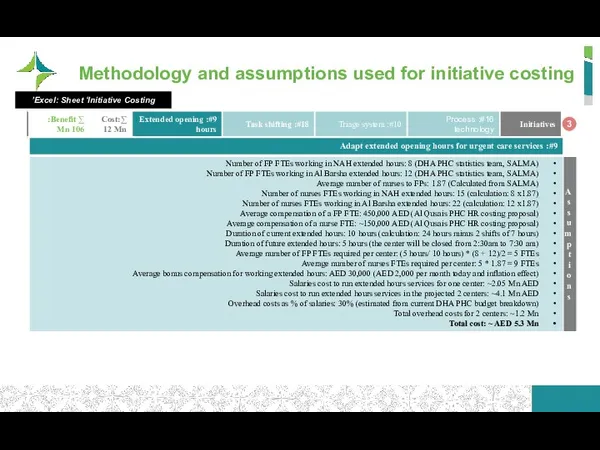
- 73. Methodology and assumptions used for initiative costing 2 Excel: Sheet ‘Initiative Costing’
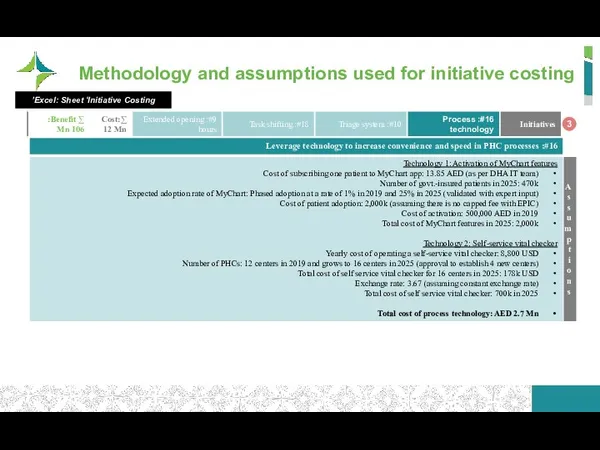
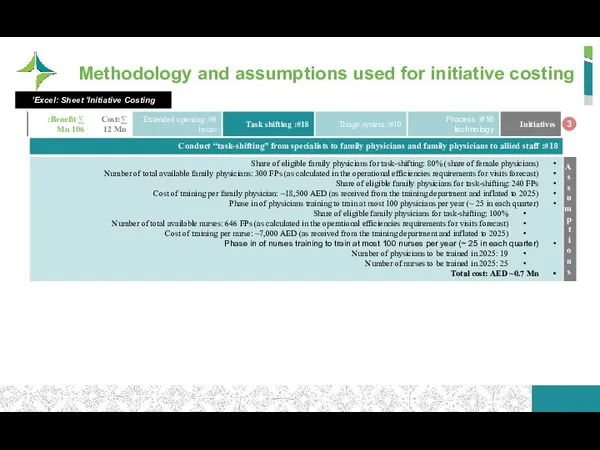
- 74. Methodology and assumptions used for initiative costing 3 Excel: Sheet ‘Initiative Costing’
- 75. Methodology and assumptions used for initiative costing 3 Excel: Sheet ‘Initiative Costing’
- 76. Methodology and assumptions used for initiative costing 3 Excel: Sheet ‘Initiative Costing’
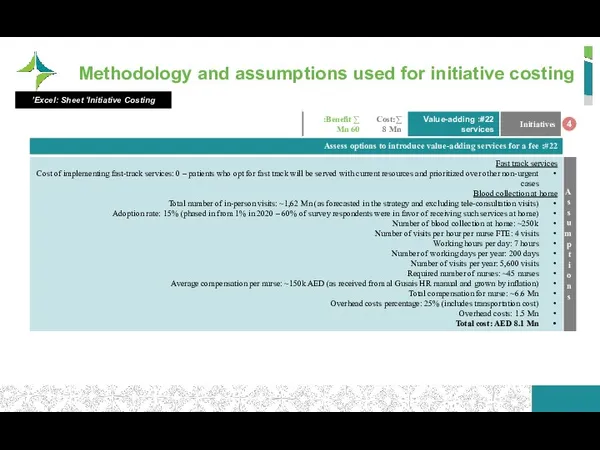
- 77. Methodology and assumptions used for initiative costing 4 Excel: Sheet ‘Initiative Costing’
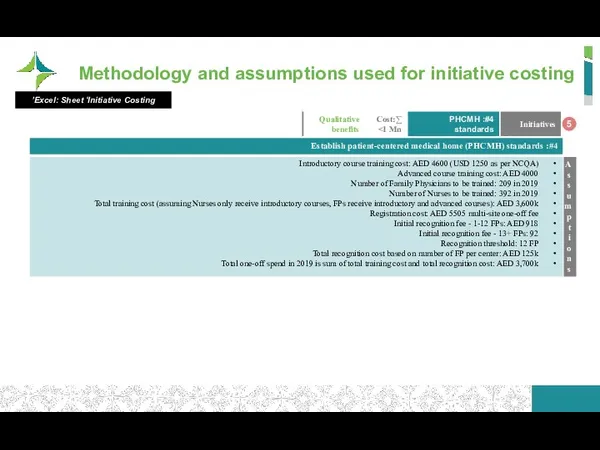
- 78. Methodology and assumptions used for initiative costing 5 Excel: Sheet ‘Initiative Costing’
- 79. Yearly view on Primary Care initiative costs Initiative costs 2019 - 2025 (AED Mn) Excel: Sheet
- 80. Table of Contents Strategy Plan Patient Journeys Initiatives for Implementation Business Case/ Financial Impact Performance monitoring
- 81. 21 Primary Care KPIs were shortlisted across identified strategic themes Shortlisted KPIs (1/3)
- 82. 21 Primary Care KPIs were shortlisted across identified strategic themes (Cont’d) Shortlisted KPIs (2/3)
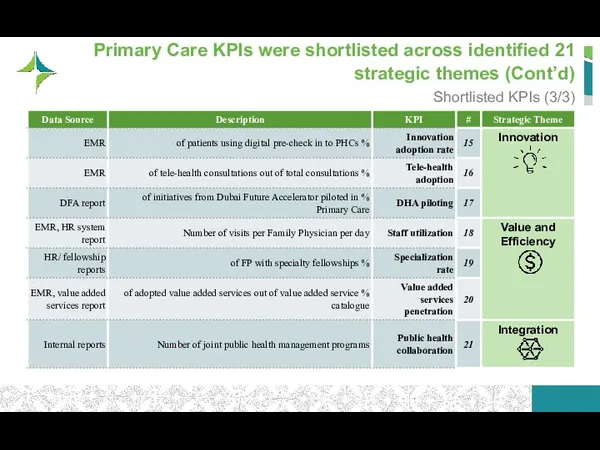
- 83. 21 Primary Care KPIs were shortlisted across identified strategic themes (Cont’d) Shortlisted KPIs (3/3)
- 84. KPI #1: % of population aware of Primary Care services KPI explanation card Dubai Plan theme
- 85. KPI #2: % of patients who had their follow up visit at the PHC after being
- 86. KPI #3: % of patients who access specialist care without referral KPI explanation card Dubai Plan
- 87. KPI #4: % of patients who responded positively to the overall experience of their FP consultation
- 88. KPI #5: % of patients who believed their FP was trusted, attentive, caring, and inclusive in
- 89. KPI #6: FP per 10,000 population KPI explanation card Dubai Plan theme DHA strategic objective 1
- 90. KPI #7: % of patients accessing FP through appointments KPI explanation card Dubai Plan theme DHA
- 91. KPI #8: Waiting time for receiving an appointment for a consultation KPI explanation card Dubai Plan
- 92. KPI #9: Waiting time from patient check-in to FP consultation start KPI explanation card Dubai Plan
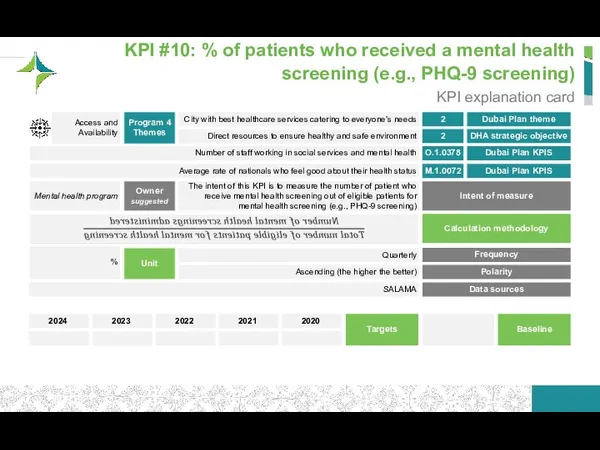
- 93. KPI #10: % of patients who received a mental health screening (e.g., PHQ-9 screening) KPI explanation
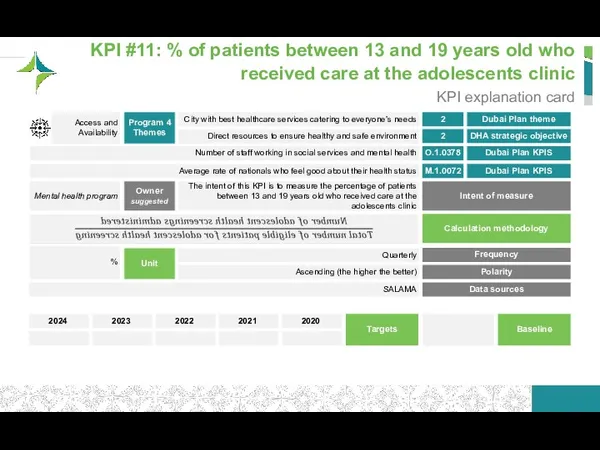
- 94. KPI #11: % of patients between 13 and 19 years old who received care at the
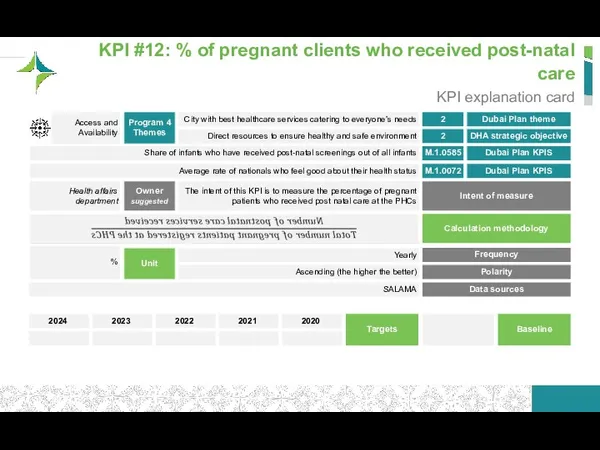
- 95. KPI #12: % of pregnant clients who received post-natal care KPI explanation card Dubai Plan theme
- 96. KPI #13: % of walk-in patients triaged in PHCs KPI explanation card Dubai Plan theme DHA
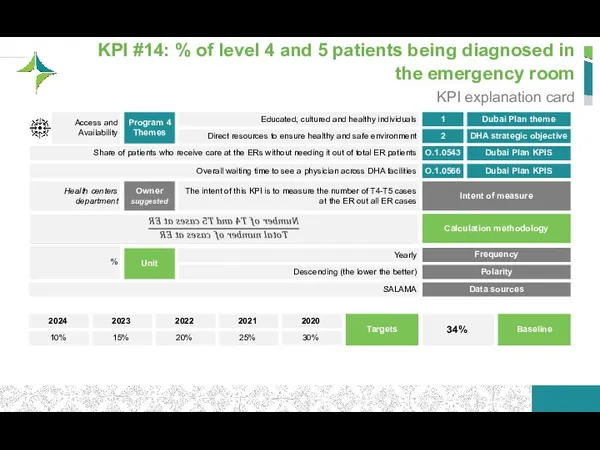
- 97. KPI #14: % of level 4 and 5 patients being diagnosed in the emergency room KPI
- 98. KPI #15: % of patients using digital pre-check in to PHCs KPI explanation card Dubai Plan
- 99. KPI #16: % of tele-health consultations out of total consultations KPI explanation card Dubai Plan theme
- 100. KPI #17: % of initiatives from Dubai Future Accelerator piloted in Primary Care KPI explanation card
- 101. KPI #18: Number of visits per Family Physician per day KPI explanation card Dubai Plan theme
- 102. KPI #19: % of FP with specialty fellowships KPI explanation card Dubai Plan theme DHA strategic
- 103. KPI #20: % of adopted value added services out of value added service catalogue KPI explanation
- 104. KPI #21: Number of joint public health management programs KPI explanation card Dubai Plan theme DHA
- 105. Agenda Strategy Plan Patient Journeys Initiatives for Implementation Business Case/ Financial Impact Performance monitoring framework Stakeholder
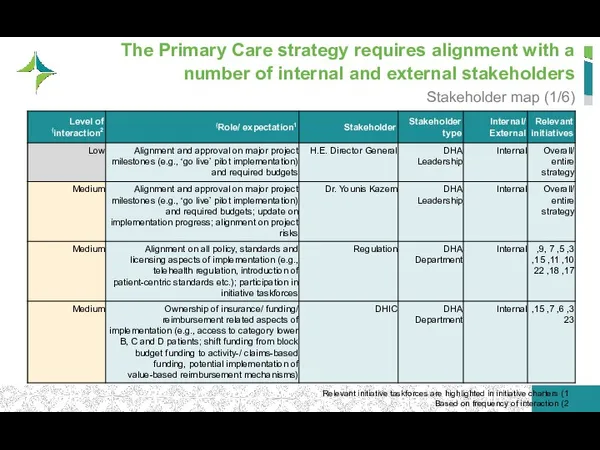
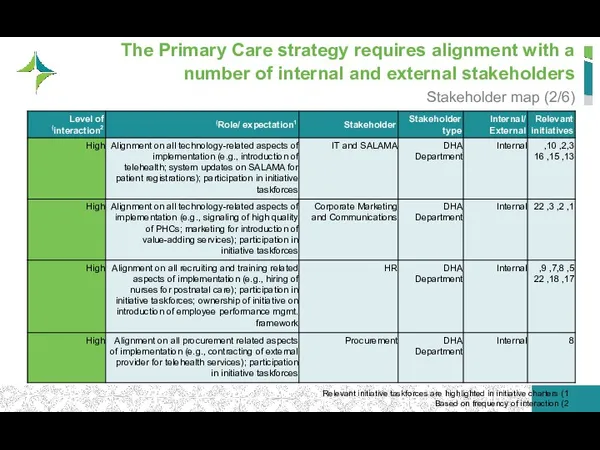
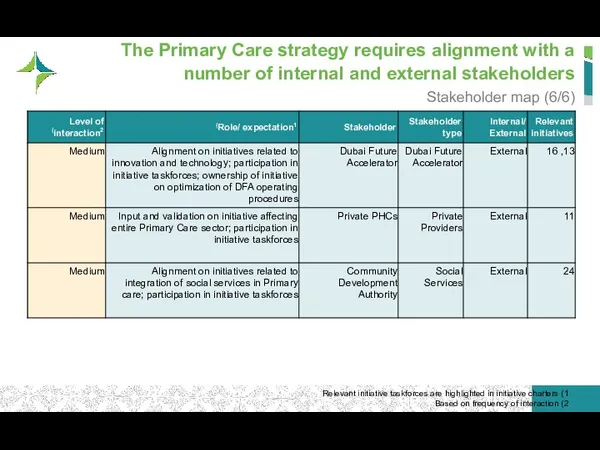
- 106. The Primary Care strategy requires alignment with a number of internal and external stakeholders Stakeholder map
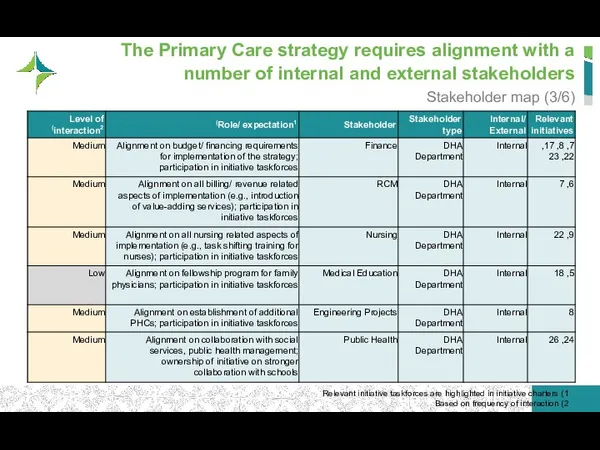
- 107. The Primary Care strategy requires alignment with a number of internal and external stakeholders Stakeholder map
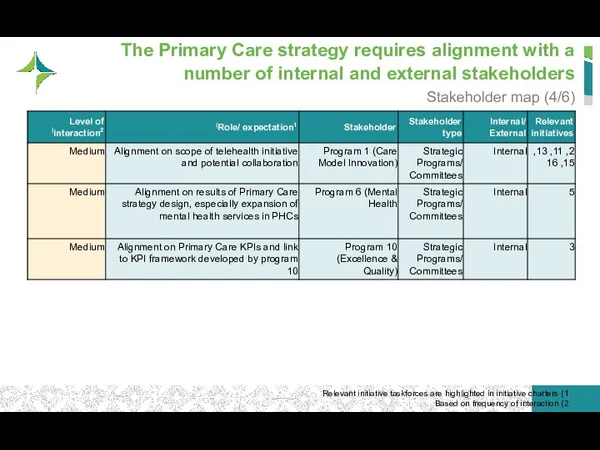
- 108. The Primary Care strategy requires alignment with a number of internal and external stakeholders Stakeholder map
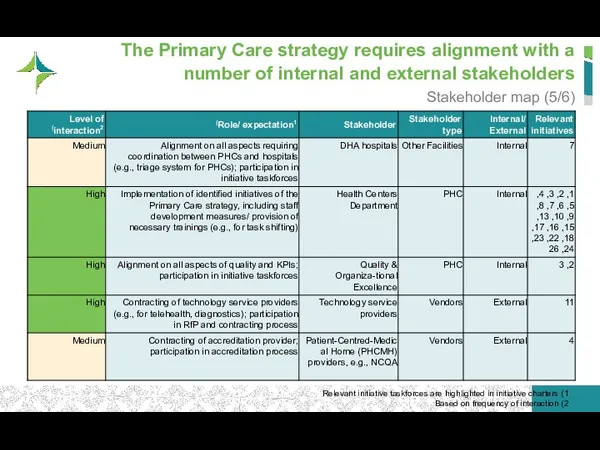
- 109. The Primary Care strategy requires alignment with a number of internal and external stakeholders Stakeholder map
- 110. The Primary Care strategy requires alignment with a number of internal and external stakeholders Stakeholder map
- 111. The Primary Care strategy requires alignment with a number of internal and external stakeholders Stakeholder map
- 112. Five key change management principles should be considered for the implementation of the strategy Change management
- 113. Specific engagements are needed to ensure employee awareness, willingness and ability to change Change Management –
- 114. The governance of the strategy implementation is driven by various roles and their respective responsibilities Strategy
- 115. A progress monitoring template is essential in the program management of the strategy implementation Progress monitoring
- 116. Table of Contents Strategy Plan Patient Journeys Initiatives for Implementation Business Case/ Financial Impact Performance monitoring
- 117. Early risk identification and ongoing risk management are crucial in avoiding pitfalls in the strategy execution
- 118. Risk management for the Primary Care strategic plan follows a 4-step approach Risk management approach Stakeholder
- 119. We categorized relevant risks for the Primary Care strategic plan along three categories… Risk assessment framework
- 120. …and recorded key risks in a ‘risk register’ along with mitigation actions Key risks (1/3) 1
- 121. …and recorded key risks in a ‘risk register’ along with mitigation actions Key risks (2/3) 1
- 122. …and recorded key risks in a ‘risk register’ along with mitigation actions Key risks (3/3) 1
- 123. The risk register aggregates all the risk-related information and allows effective tracking and monitoring Risk monitoring
- 124. It is best practice to align with leadership and key stakeholders on major risks in a
- 125. Table of Contents Strategy Plan Patient Journeys Initiatives for Implementation Business Case/ Financial Impact Performance monitoring
- 126. Key prerequisites for a successful strategy include a strong senior sponsorship and clear stakeholder alignment Primary
- 127. A number of regulatory/legal enablers need to be in place to support the Primary Care strategy
- 128. We recommend a total of 7 process/ treatment technologies – to be implemented based on appetite
- 129. Artificial Intelligence can be utilized for diagnostics and prevention of chronic diseases Treatment innovation (1/2) Sources:
- 131. Скачать презентацию
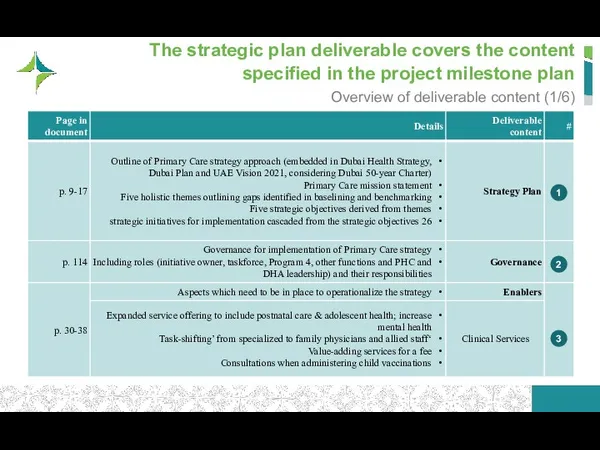
The strategic plan deliverable covers the content specified in the project
The strategic plan deliverable covers the content specified in the project
The strategic plan deliverable covers the content specified in the project
The strategic plan deliverable covers the content specified in the project
The strategic plan deliverable covers the content specified in the project
The strategic plan deliverable covers the content specified in the project
The strategic plan deliverable covers the content specified in the project
The strategic plan deliverable covers the content specified in the project
The strategic plan deliverable covers the content specified in the project
The strategic plan deliverable covers the content specified in the project
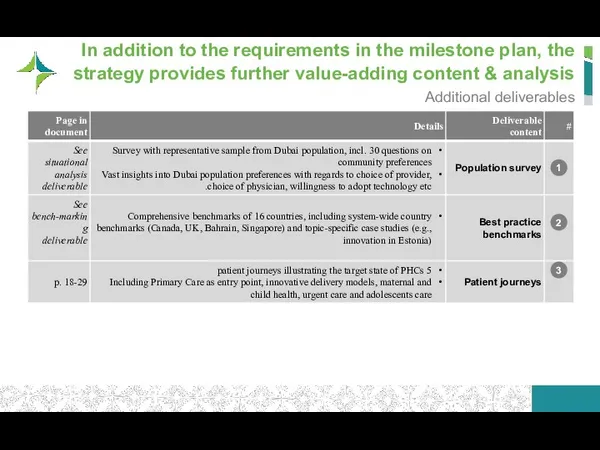
In addition to the requirements in the milestone plan, the strategy
In addition to the requirements in the milestone plan, the strategy
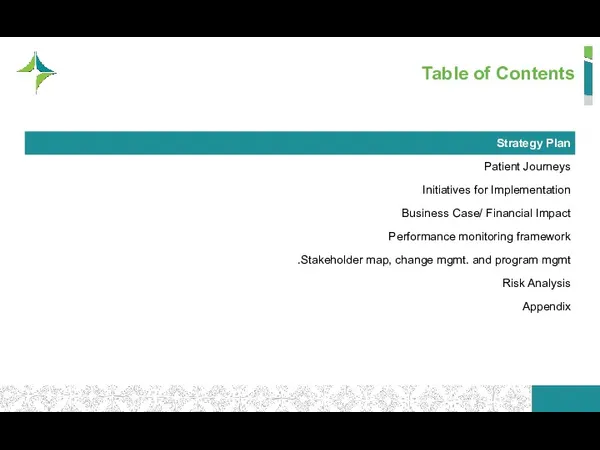
Table of Contents
Strategy Plan
Patient Journeys
Initiatives for Implementation
Business Case/ Financial Impact
Performance monitoring
Table of Contents
Strategy Plan
Patient Journeys
Initiatives for Implementation
Business Case/ Financial Impact
Performance monitoring
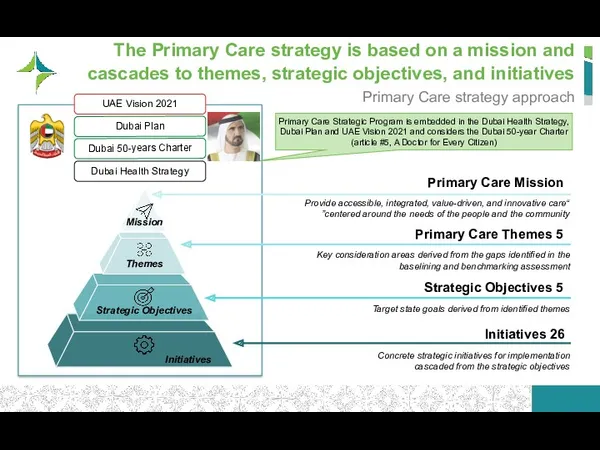
The Primary Care strategy is based on a mission and cascades
The Primary Care strategy is based on a mission and cascades
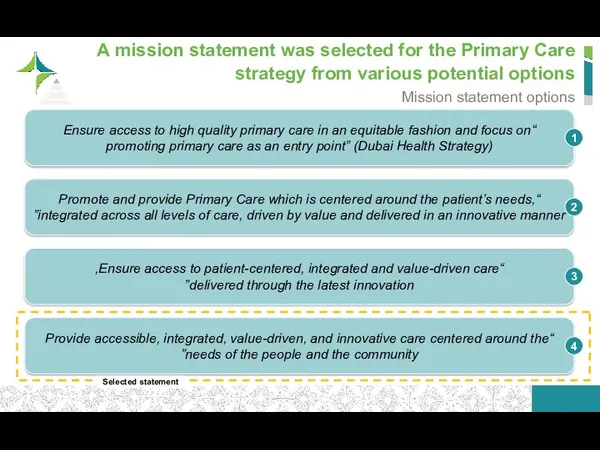
A mission statement was selected for the Primary Care strategy from
A mission statement was selected for the Primary Care strategy from
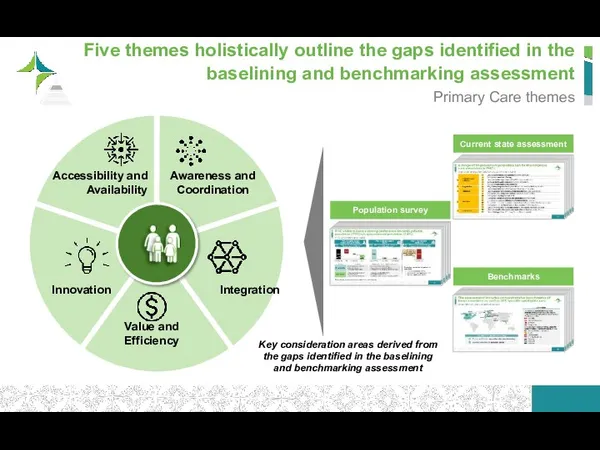
Five themes holistically outline the gaps identified in the baselining and
Five themes holistically outline the gaps identified in the baselining and
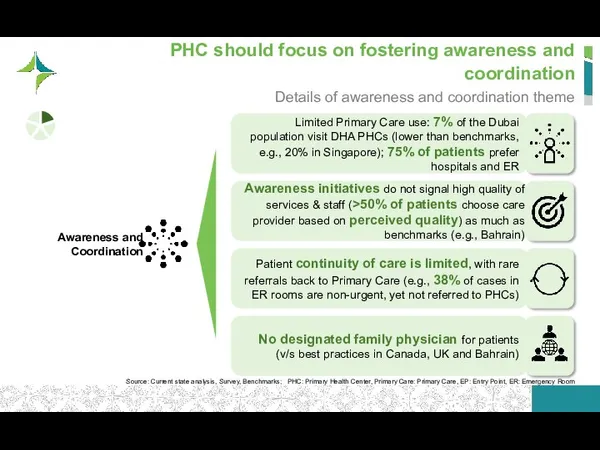
To remedy the limited and undirected use of PHC services, PHC
To remedy the limited and undirected use of PHC services, PHC
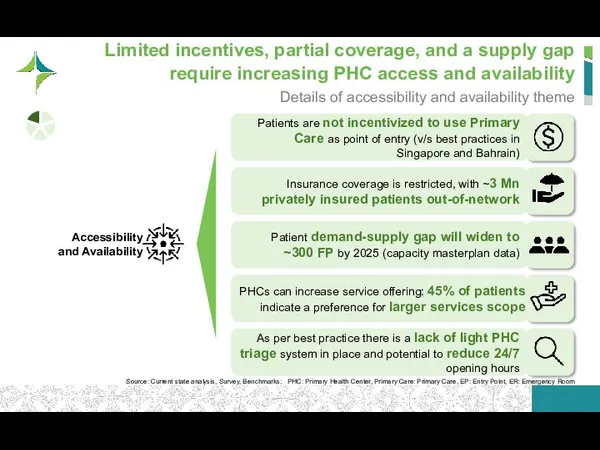
PHCs can increase service offering: 45% of patients indicate a preference
PHCs can increase service offering: 45% of patients indicate a preference
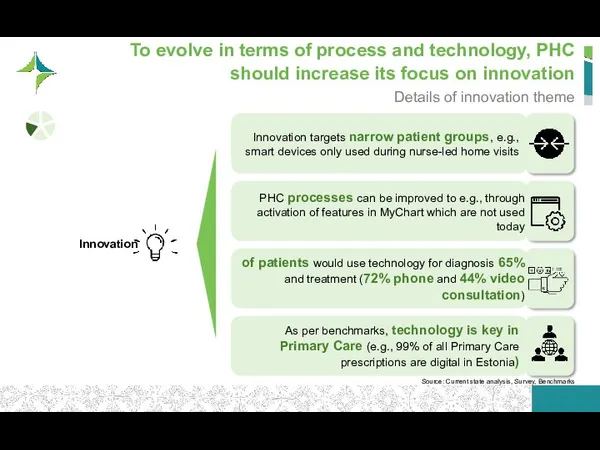
To evolve in terms of process and technology, PHC should increase
To evolve in terms of process and technology, PHC should increase
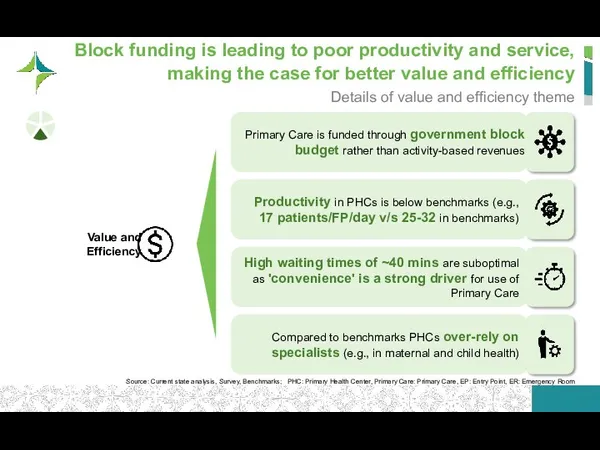
Compared to benchmarks PHCs over-rely on specialists (e.g., in maternal and
Compared to benchmarks PHCs over-rely on specialists (e.g., in maternal and
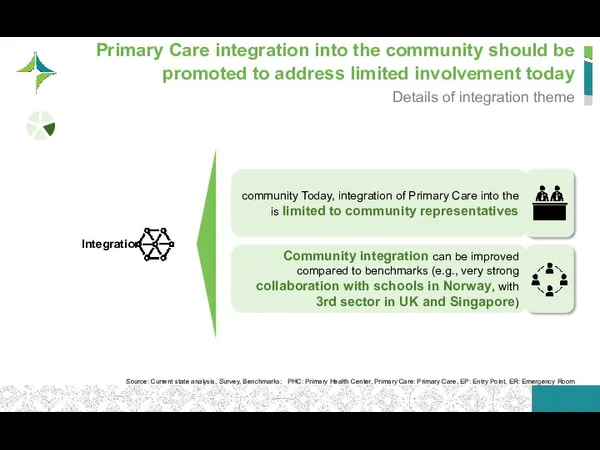
Primary Care integration into the community should be promoted to address
Primary Care integration into the community should be promoted to address
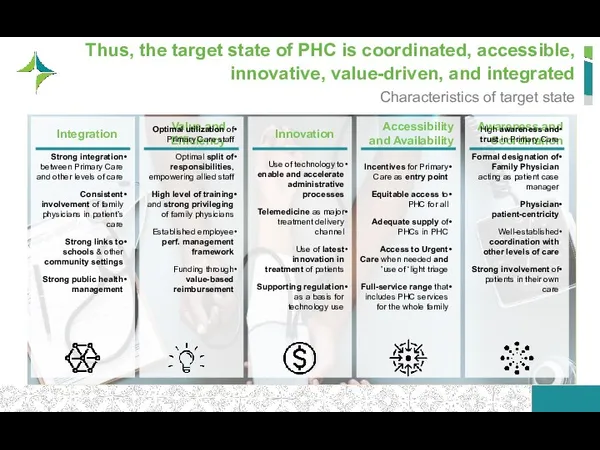
Thus, the target state of PHC is coordinated, accessible, innovative, value-driven,
Thus, the target state of PHC is coordinated, accessible, innovative, value-driven,
Table of Contents
Strategy Plan
Patient Journeys
Initiatives for Implementation
Business Case/ Financial Impact
Performance monitoring
Table of Contents
Strategy Plan
Patient Journeys
Initiatives for Implementation
Business Case/ Financial Impact
Performance monitoring
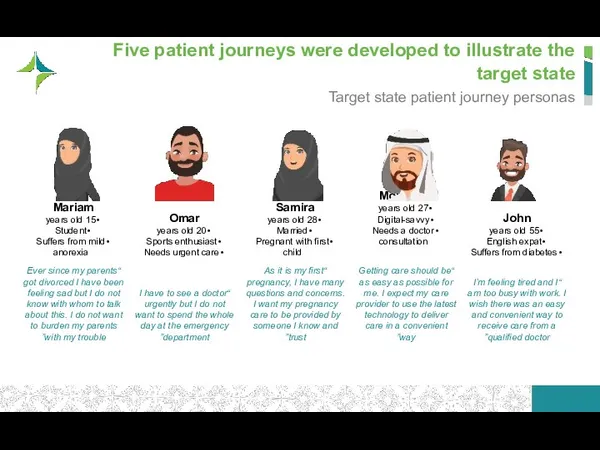
Five patient journeys were developed to illustrate the target state
Target
Five patient journeys were developed to illustrate the target state
Target
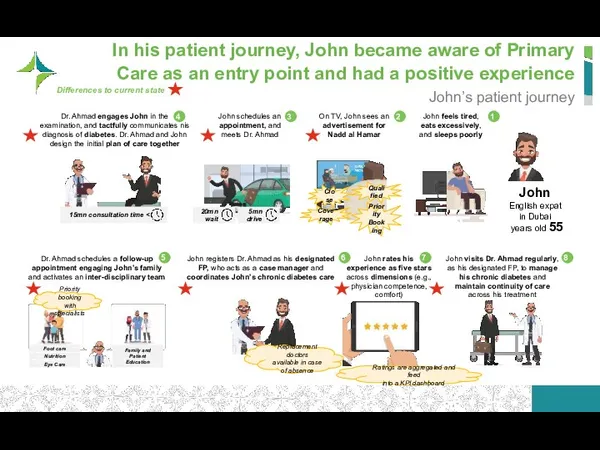
In his patient journey, John became aware of Primary Care as
In his patient journey, John became aware of Primary Care as
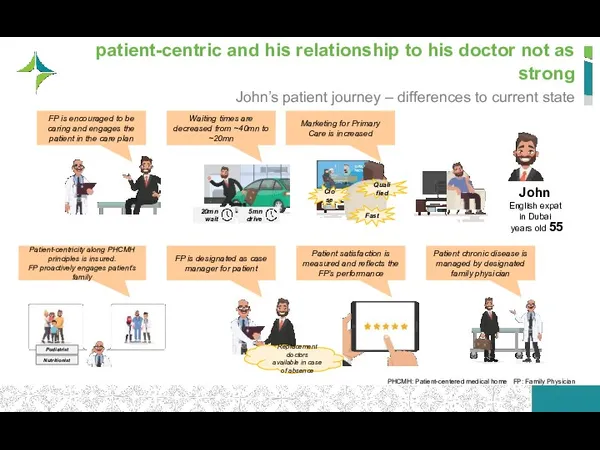
In the current state, John’s journey was not as patient-centric and
In the current state, John’s journey was not as patient-centric and
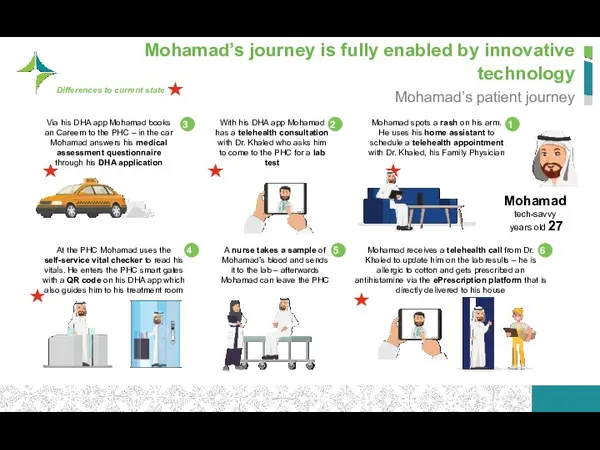
Mohamad’s journey is fully enabled by innovative technology
Mohamad’s patient journey
Mohamad
tech-savvy
27
Mohamad’s journey is fully enabled by innovative technology
Mohamad’s patient journey
Mohamad
tech-savvy
27
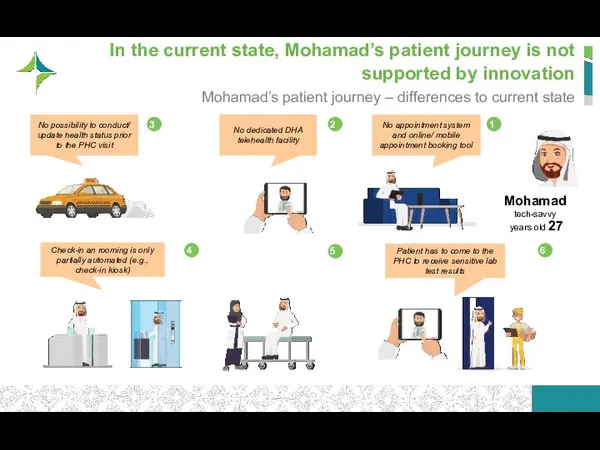
In the current state, Mohamad’s patient journey is not supported by
In the current state, Mohamad’s patient journey is not supported by
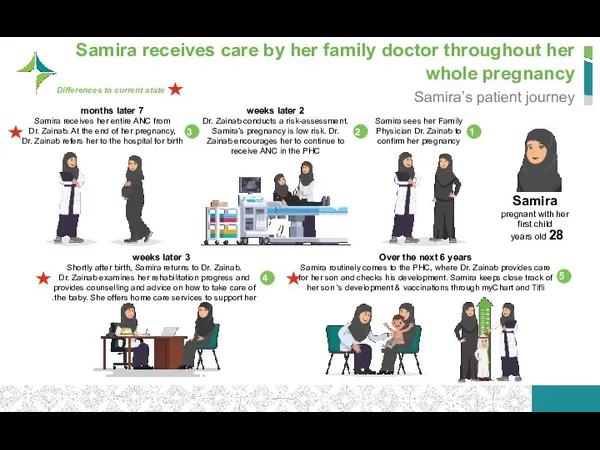
Samira receives care by her family doctor throughout her whole pregnancy
Samira’s
Samira receives care by her family doctor throughout her whole pregnancy
Samira’s
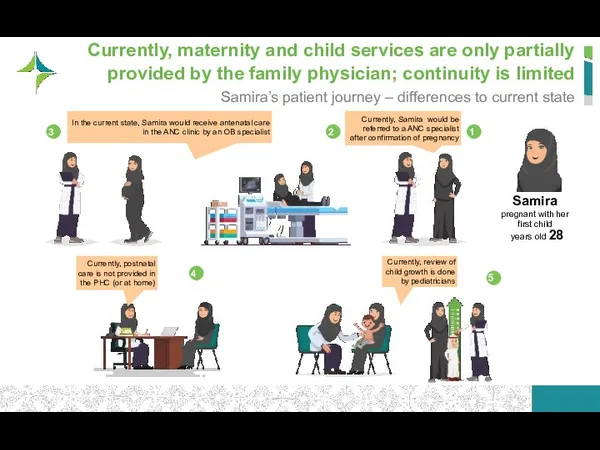
Currently, maternity and child services are only partially provided by the
Currently, maternity and child services are only partially provided by the
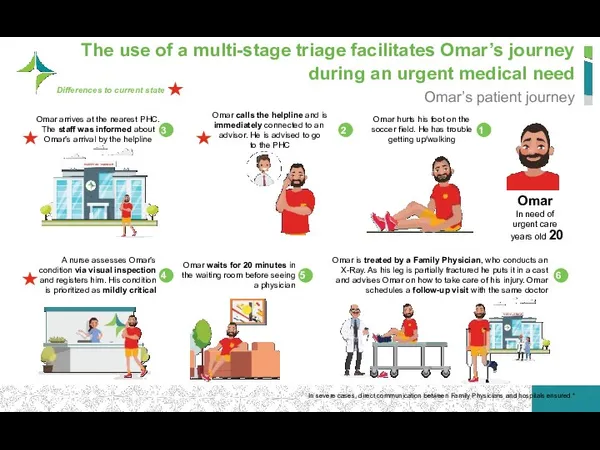
The use of a multi-stage triage facilitates Omar’s journey during an
The use of a multi-stage triage facilitates Omar’s journey during an
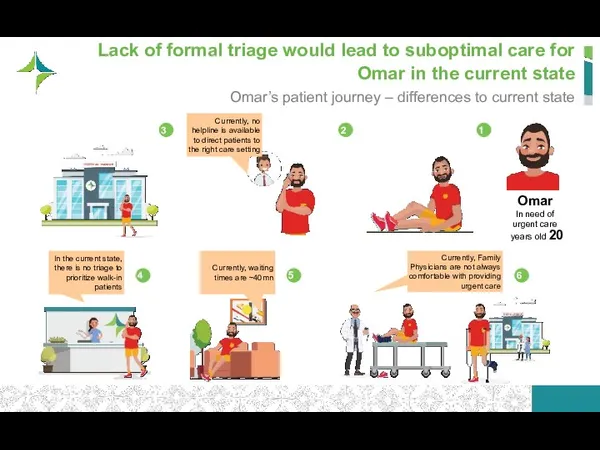
Lack of formal triage would lead to suboptimal care for Omar
Lack of formal triage would lead to suboptimal care for Omar
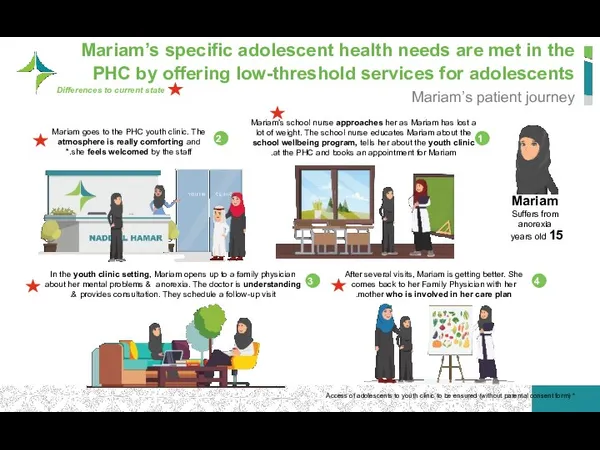
Mariam’s specific adolescent health needs are met in the PHC by
Mariam’s specific adolescent health needs are met in the PHC by
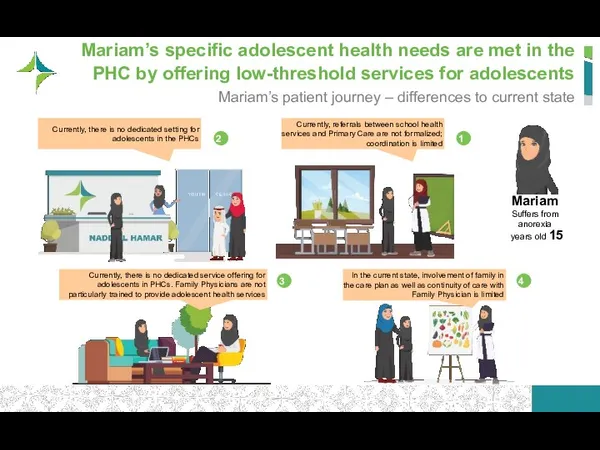
Mariam’s specific adolescent health needs are met in the PHC by
Mariam’s specific adolescent health needs are met in the PHC by
Table of Contents
Strategy Plan
Patient Journeys
Initiatives for Implementation
Business Case/ Financial Impact
Performance monitoring
Table of Contents
Strategy Plan
Patient Journeys
Initiatives for Implementation
Business Case/ Financial Impact
Performance monitoring
The strategy is comprised of 5 strategic objectives
Primary Care strategic objectives
Dubai
The strategy is comprised of 5 strategic objectives
Primary Care strategic objectives
Dubai
Increased willingness to use Primary Care as entry point
Strengthened patient-physician relationship
Improved
Increased willingness to use Primary Care as entry point
Strengthened patient-physician relationship
Improved
Increased adoption of Primary Care as entry point
Broader service offering reflecting
Increased adoption of Primary Care as entry point
Broader service offering reflecting
Description
High-Level KPIs
Strengthened patient experience through convenience and speed
Improved patient health through
Description
High-Level KPIs
Strengthened patient experience through convenience and speed
Improved patient health through
Description
Objective Card #4: Establish a value-driven Primary Care model
Source: Strategy& analysis
Description
Objective Card #4: Establish a value-driven Primary Care model
Source: Strategy& analysis
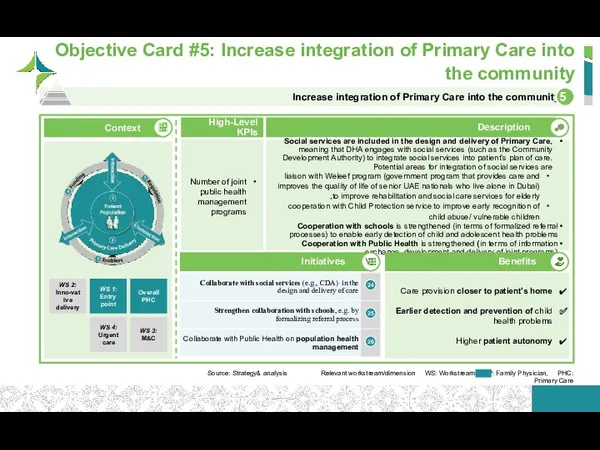
Social services are included in the design and delivery of Primary
Social services are included in the design and delivery of Primary
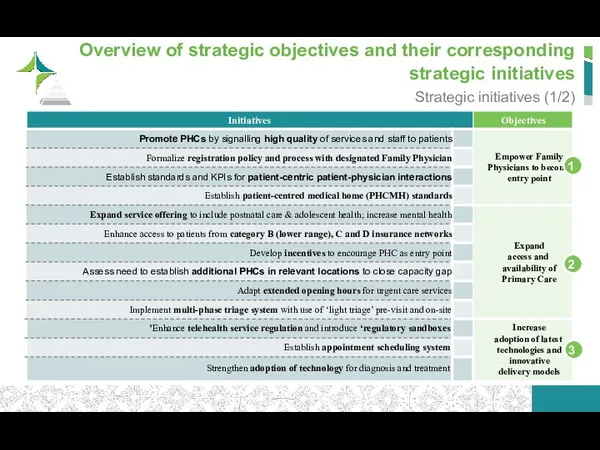
Overview of strategic objectives and their corresponding strategic initiatives
Strategic initiatives
Overview of strategic objectives and their corresponding strategic initiatives
Strategic initiatives
Overview of strategic objectives and their corresponding strategic initiatives
Strategic initiatives
Overview of strategic objectives and their corresponding strategic initiatives
Strategic initiatives
Table of Contents
Strategy Plan
Patient Journeys
Initiatives for Implementation
Business Case/ Financial Impact
Performance monitoring
Table of Contents
Strategy Plan
Patient Journeys
Initiatives for Implementation
Business Case/ Financial Impact
Performance monitoring
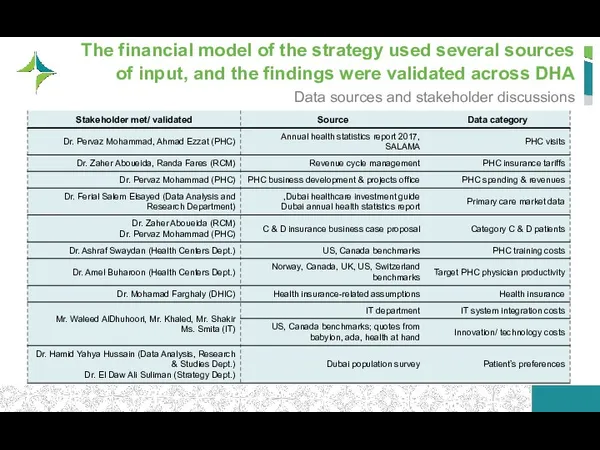
The financial model of the strategy used several sources of input,
The financial model of the strategy used several sources of input,
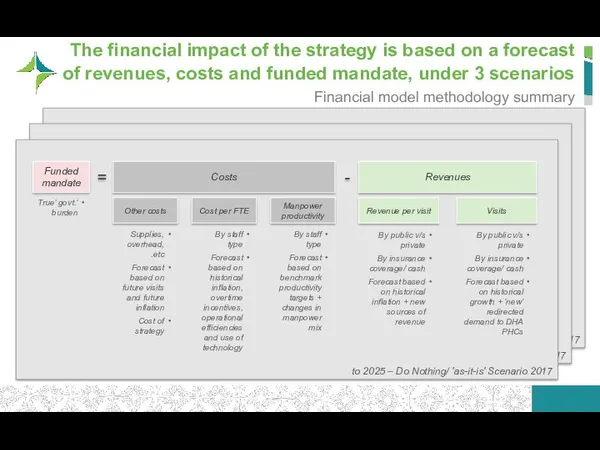
2017 to 2025 – Strategy Scenario (Aggressive)
2017 to 2025 – Strategy
2017 to 2025 – Strategy Scenario (Aggressive)
2017 to 2025 – Strategy
Financial impact explanation notes
We based the financial impact analysis on 2017
Financial impact explanation notes
We based the financial impact analysis on 2017
Financial impact explanation notes
Financials
In 2017 DHA PHC revenues are recorded at
Financial impact explanation notes
Financials
In 2017 DHA PHC revenues are recorded at
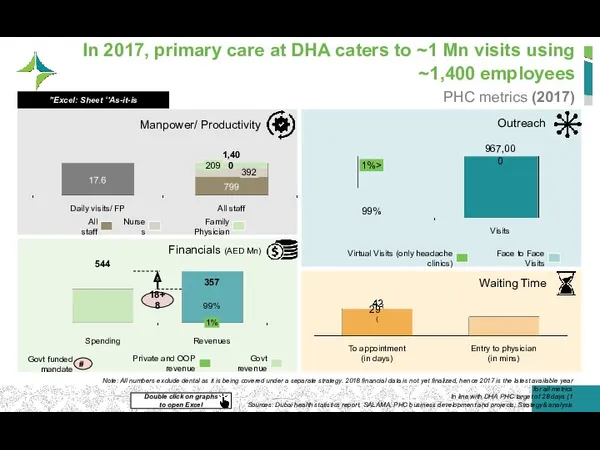
In 2017, primary care at DHA caters to ~1 Mn visits
In 2017, primary care at DHA caters to ~1 Mn visits
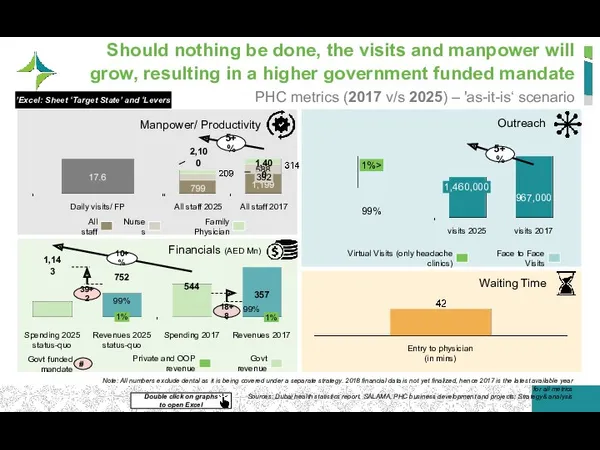
Should nothing be done, the visits and manpower will grow, resulting
Should nothing be done, the visits and manpower will grow, resulting
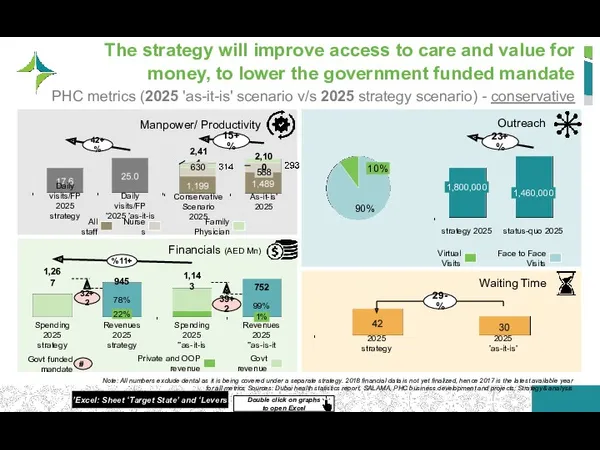
The strategy will improve access to care and value for money,
The strategy will improve access to care and value for money,
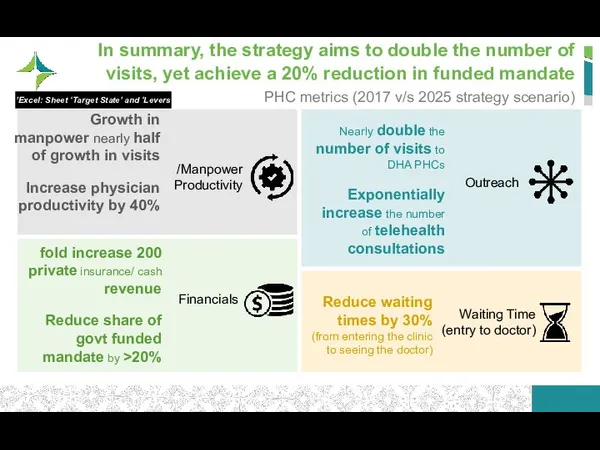
In summary, the strategy aims to double the number of visits,
In summary, the strategy aims to double the number of visits,
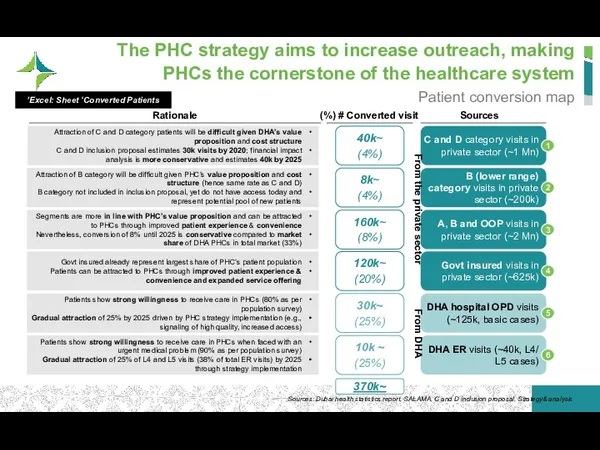
The PHC strategy aims to increase outreach, making PHCs the cornerstone
The PHC strategy aims to increase outreach, making PHCs the cornerstone
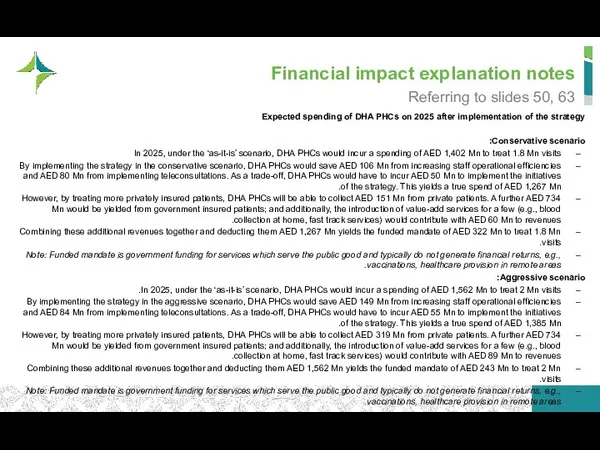
Financial impact explanation notes
Expected spending of DHA PHCs on 2025 after
Financial impact explanation notes
Expected spending of DHA PHCs on 2025 after
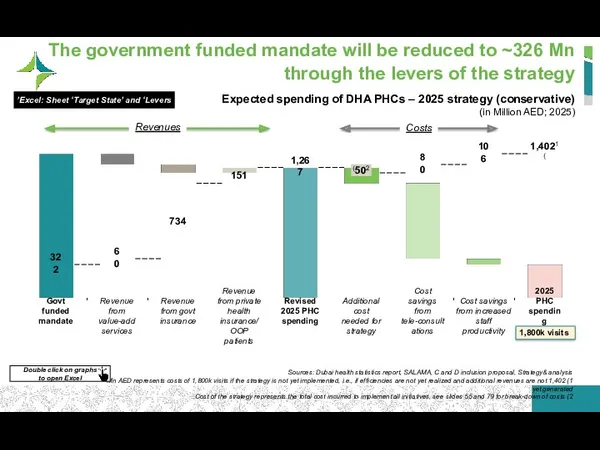
The government funded mandate will be reduced to ~326 Mn through
The government funded mandate will be reduced to ~326 Mn through
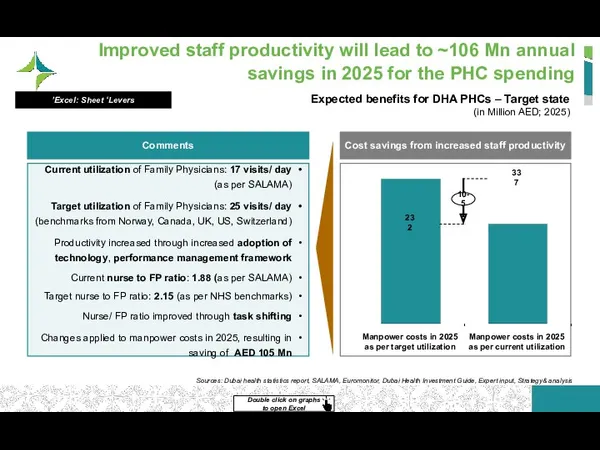
Improved staff productivity will lead to ~106 Mn annual savings in
Improved staff productivity will lead to ~106 Mn annual savings in
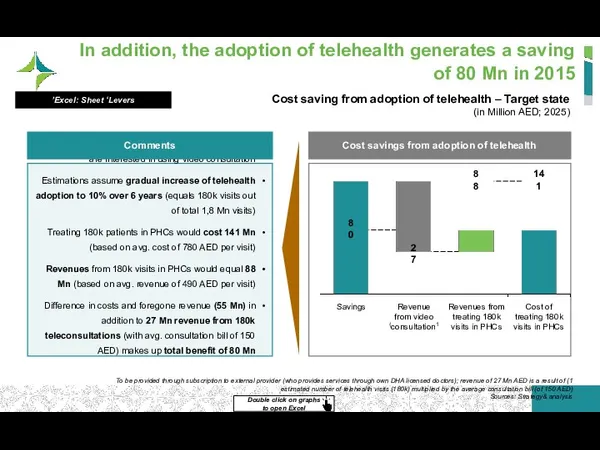
In addition, the adoption of telehealth generates a saving of 80
In addition, the adoption of telehealth generates a saving of 80
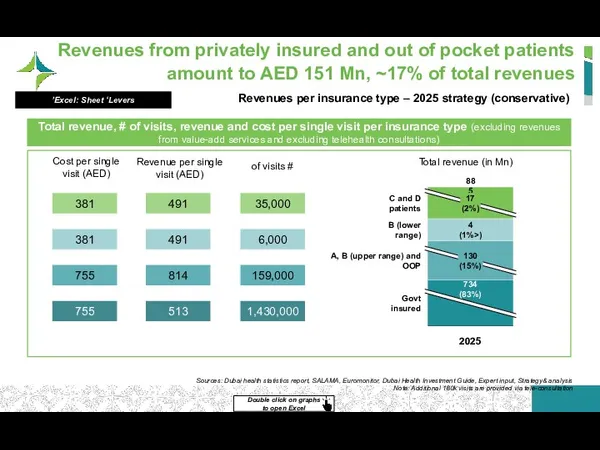
Revenues from privately insured and out of pocket patients amount to
Revenues from privately insured and out of pocket patients amount to
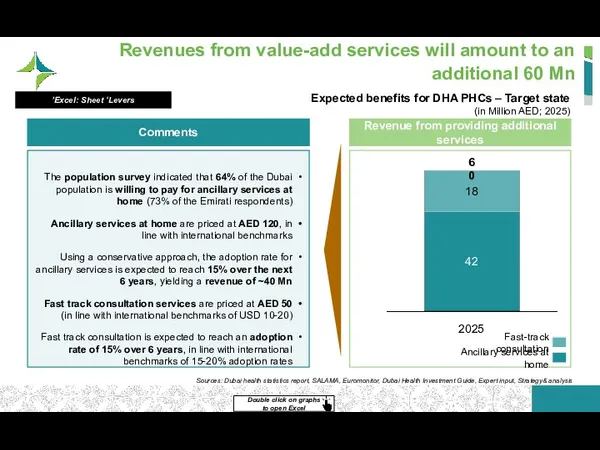
Revenues from value-add services will amount to an additional 60 Mn
Revenue
Revenues from value-add services will amount to an additional 60 Mn
Revenue
2
Identified initiatives are associated with a total cost of
~50 Mn
2
Identified initiatives are associated with a total cost of ~50 Mn
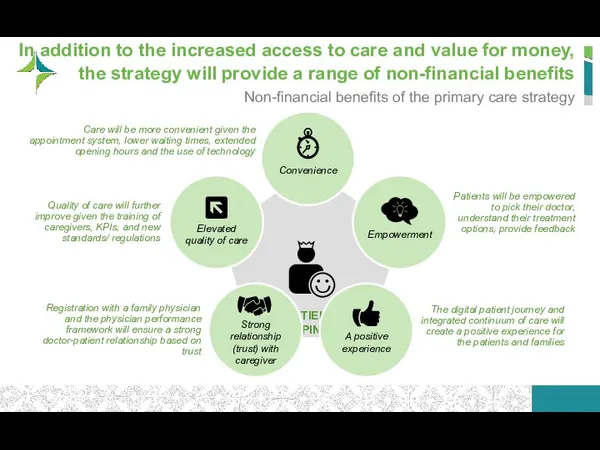
In addition to the increased access to care and value for
In addition to the increased access to care and value for
Financial impact explanation notes
Expected government funded mandate for DHA PHCs
Conservative scenario:
Under
Financial impact explanation notes
Expected government funded mandate for DHA PHCs
Conservative scenario:
Under
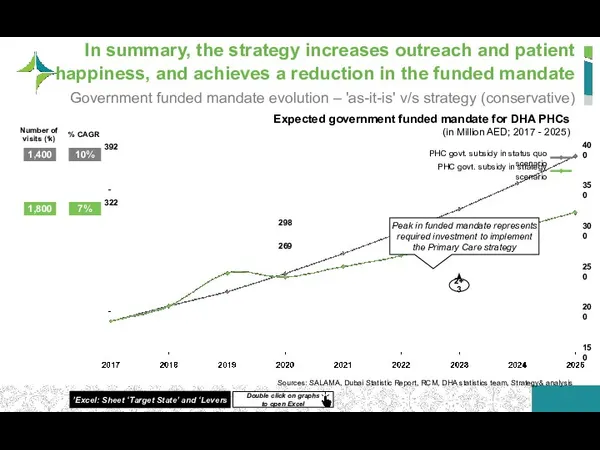
In summary, the strategy increases outreach and patient happiness, and achieves
In summary, the strategy increases outreach and patient happiness, and achieves

The strategy will increase revenue per visit and decrease cost per
The strategy will increase revenue per visit and decrease cost per
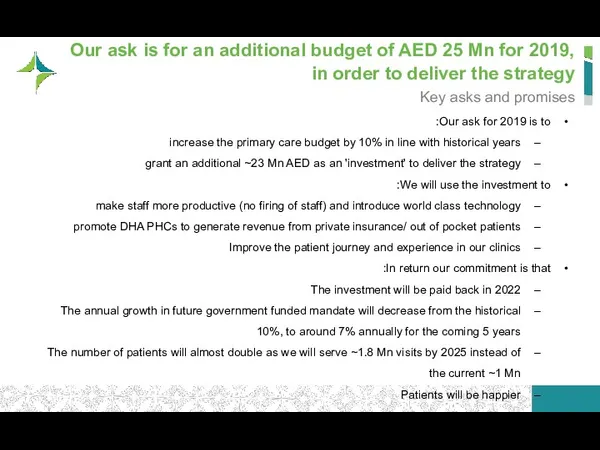
Our ask is for an additional budget of AED 25 Mn
Our ask is for an additional budget of AED 25 Mn
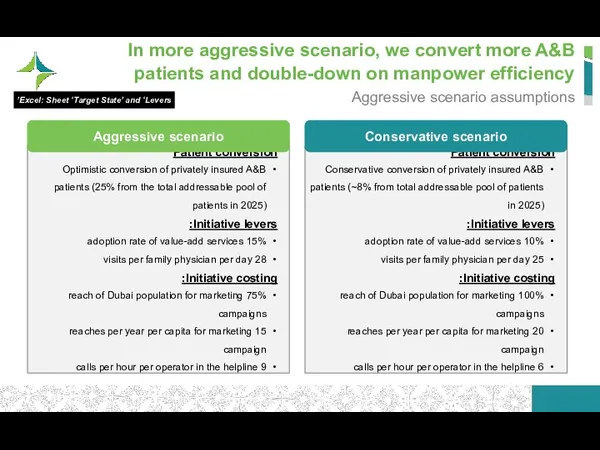
In more aggressive scenario, we convert more A&B patients and double-down
In more aggressive scenario, we convert more A&B patients and double-down
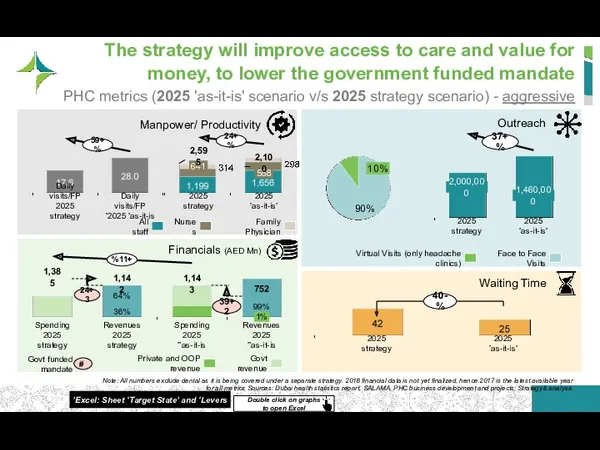
The strategy will improve access to care and value for money,
The strategy will improve access to care and value for money,
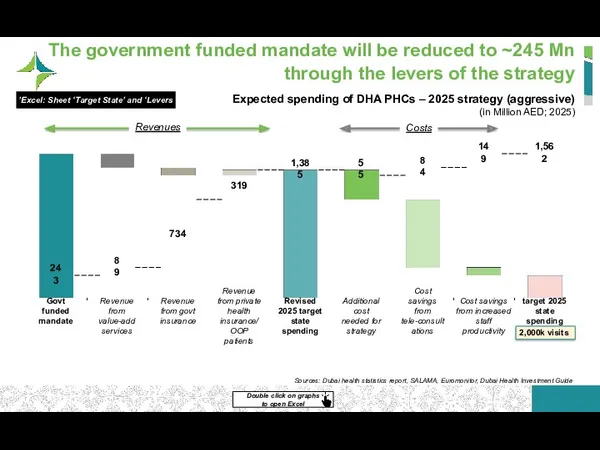
The government funded mandate will be reduced to ~245 Mn through
The government funded mandate will be reduced to ~245 Mn through
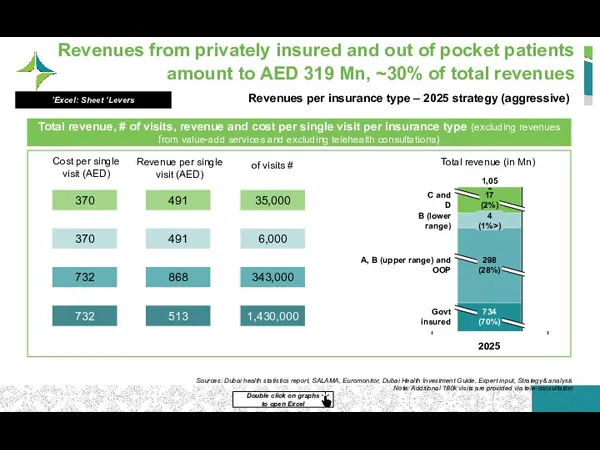
Revenues from privately insured and out of pocket patients amount to
Revenues from privately insured and out of pocket patients amount to
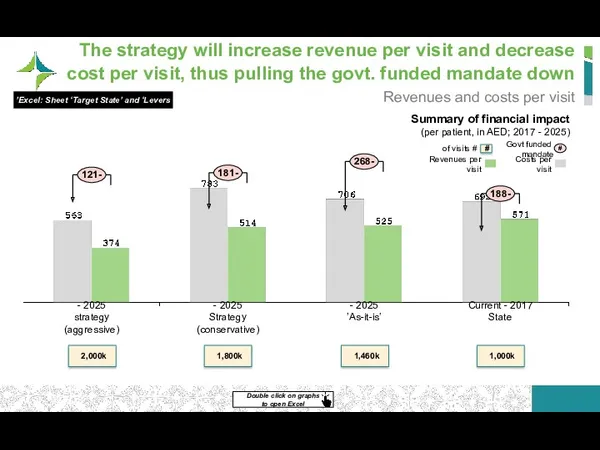
The strategy will increase revenue per visit and decrease cost per
The strategy will increase revenue per visit and decrease cost per
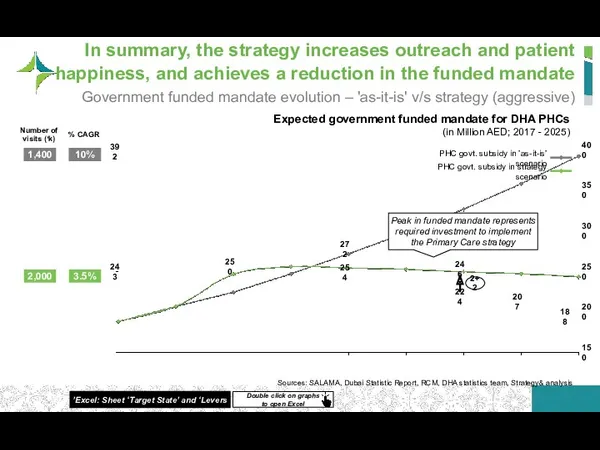
In summary, the strategy increases outreach and patient happiness, and achieves
In summary, the strategy increases outreach and patient happiness, and achieves
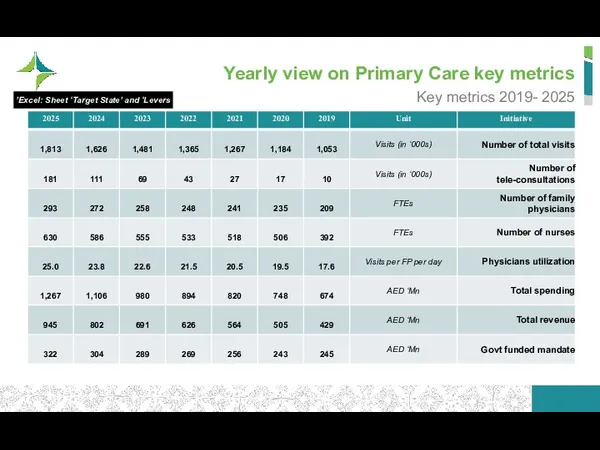
Yearly view on Primary Care key metrics
Key metrics 2019- 2025
Excel: Sheet
Yearly view on Primary Care key metrics
Key metrics 2019- 2025
Excel: Sheet
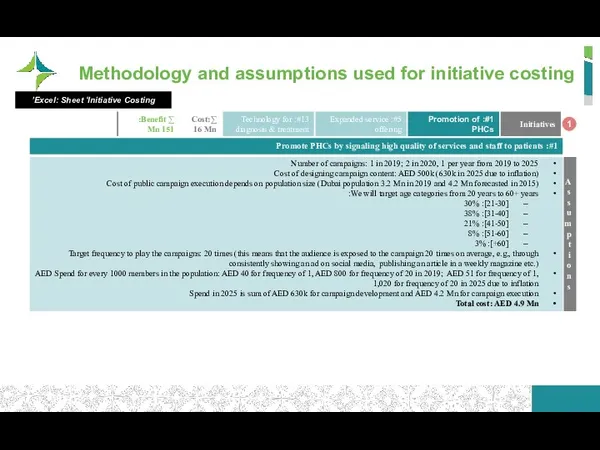
Methodology and assumptions used for initiative costing
1
Excel: Sheet ‘Initiative Costing’
Methodology and assumptions used for initiative costing
1
Excel: Sheet ‘Initiative Costing’
Methodology and assumptions used for initiative costing
1
Excel: Sheet ‘Initiative Costing’
Methodology and assumptions used for initiative costing
1
Excel: Sheet ‘Initiative Costing’
Methodology and assumptions used for initiative costing
1
Excel: Sheet ‘Initiative Costing’
Methodology and assumptions used for initiative costing
1
Excel: Sheet ‘Initiative Costing’
Methodology and assumptions used for initiative costing
1
Excel: Sheet ‘Initiative Costing’
Methodology and assumptions used for initiative costing
1
Excel: Sheet ‘Initiative Costing’
Methodology and assumptions used for initiative costing
1
Excel: Sheet ‘Initiative Costing’
Methodology and assumptions used for initiative costing
1
Excel: Sheet ‘Initiative Costing’
Methodology and assumptions used for initiative costing
2
Excel: Sheet ‘Initiative Costing’
Methodology and assumptions used for initiative costing
2
Excel: Sheet ‘Initiative Costing’
Methodology and assumptions used for initiative costing
3
Excel: Sheet ‘Initiative Costing’
Methodology and assumptions used for initiative costing
3
Excel: Sheet ‘Initiative Costing’
Methodology and assumptions used for initiative costing
3
Excel: Sheet ‘Initiative Costing’
Methodology and assumptions used for initiative costing
3
Excel: Sheet ‘Initiative Costing’
Methodology and assumptions used for initiative costing
3
Excel: Sheet ‘Initiative Costing’
Methodology and assumptions used for initiative costing
3
Excel: Sheet ‘Initiative Costing’
Methodology and assumptions used for initiative costing
4
Excel: Sheet ‘Initiative Costing’
Methodology and assumptions used for initiative costing
4
Excel: Sheet ‘Initiative Costing’
Methodology and assumptions used for initiative costing
5
Excel: Sheet ‘Initiative Costing’
Methodology and assumptions used for initiative costing
5
Excel: Sheet ‘Initiative Costing’
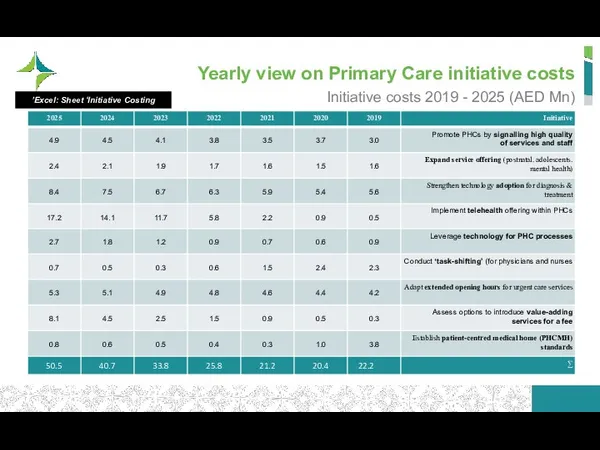
Yearly view on Primary Care initiative costs
Initiative costs 2019 - 2025
Yearly view on Primary Care initiative costs
Initiative costs 2019 - 2025
Table of Contents
Strategy Plan
Patient Journeys
Initiatives for Implementation
Business Case/ Financial Impact
Performance monitoring
Table of Contents
Strategy Plan
Patient Journeys
Initiatives for Implementation
Business Case/ Financial Impact
Performance monitoring
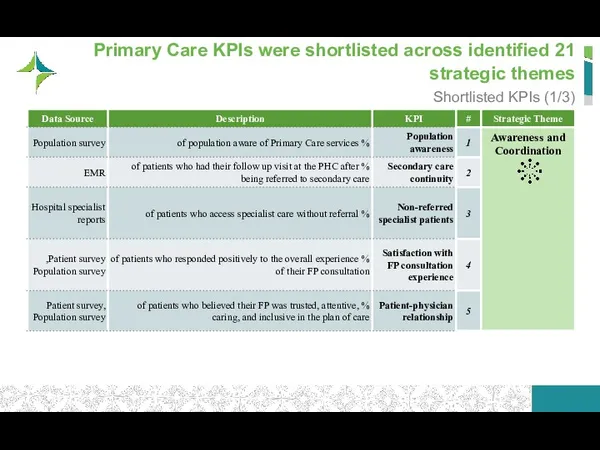
21 Primary Care KPIs were shortlisted across identified strategic themes
Shortlisted KPIs
21 Primary Care KPIs were shortlisted across identified strategic themes
Shortlisted KPIs
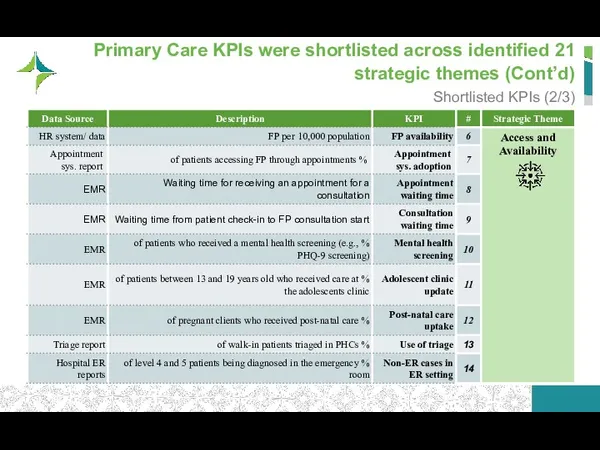
21 Primary Care KPIs were shortlisted across identified strategic themes (Cont’d)
Shortlisted
21 Primary Care KPIs were shortlisted across identified strategic themes (Cont’d)
Shortlisted
21 Primary Care KPIs were shortlisted across identified strategic themes (Cont’d)
Shortlisted
21 Primary Care KPIs were shortlisted across identified strategic themes (Cont’d)
Shortlisted
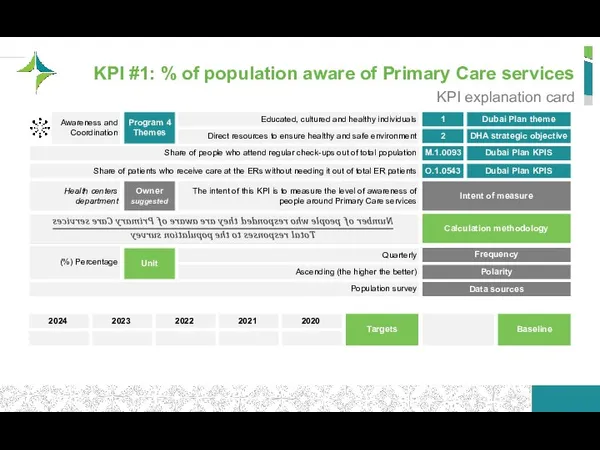
KPI #1: % of population aware of Primary Care services
KPI explanation
KPI #1: % of population aware of Primary Care services
KPI explanation
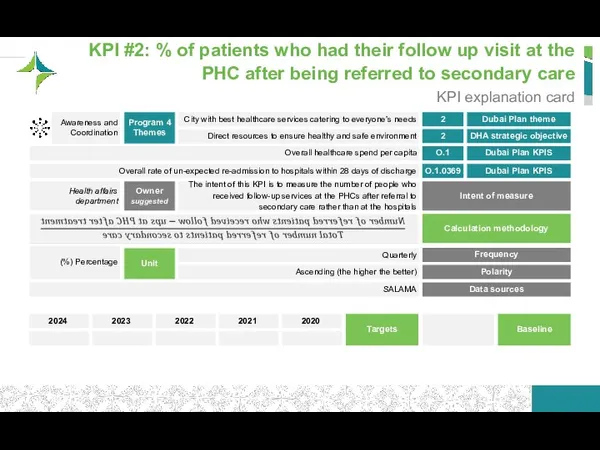
KPI #2: % of patients who had their follow up visit
KPI #2: % of patients who had their follow up visit
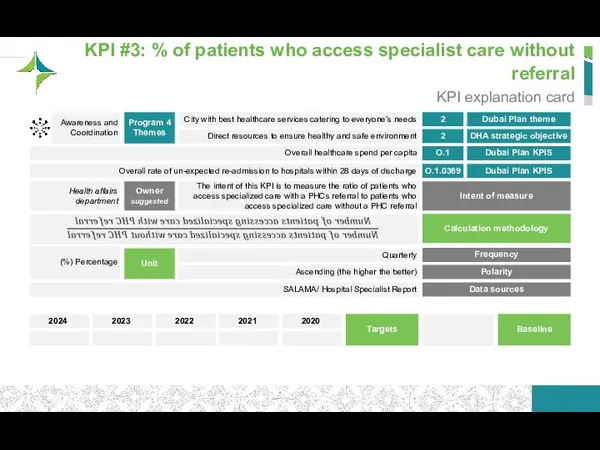
KPI #3: % of patients who access specialist care without referral
KPI
KPI #3: % of patients who access specialist care without referral
KPI
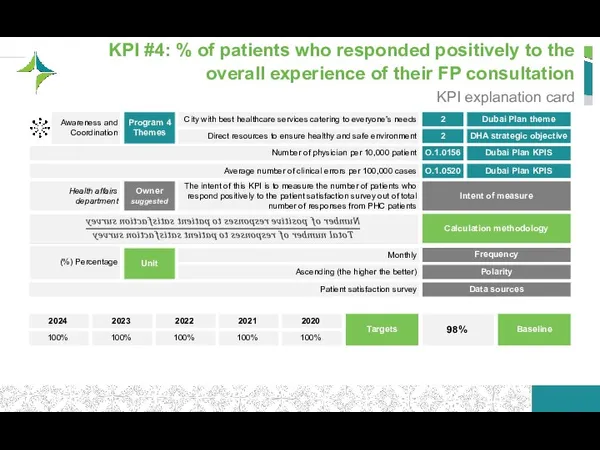
KPI #4: % of patients who responded positively to the overall
KPI #4: % of patients who responded positively to the overall

KPI #5: % of patients who believed their FP was trusted,
KPI #5: % of patients who believed their FP was trusted,

KPI #6: FP per 10,000 population
KPI explanation card
Dubai Plan theme
DHA strategic
KPI #6: FP per 10,000 population
KPI explanation card
Dubai Plan theme
DHA strategic
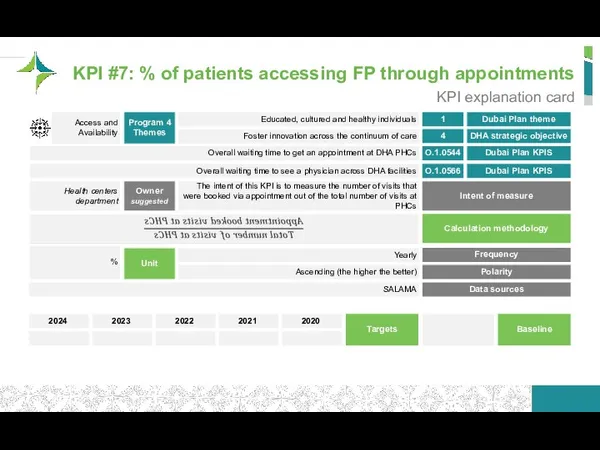
KPI #7: % of patients accessing FP through appointments
KPI explanation card
Dubai
KPI #7: % of patients accessing FP through appointments
KPI explanation card
Dubai
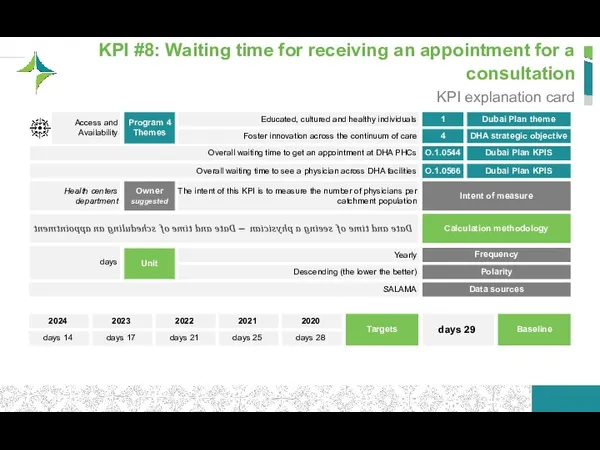
KPI #8: Waiting time for receiving an appointment for a consultation
KPI
KPI #8: Waiting time for receiving an appointment for a consultation
KPI
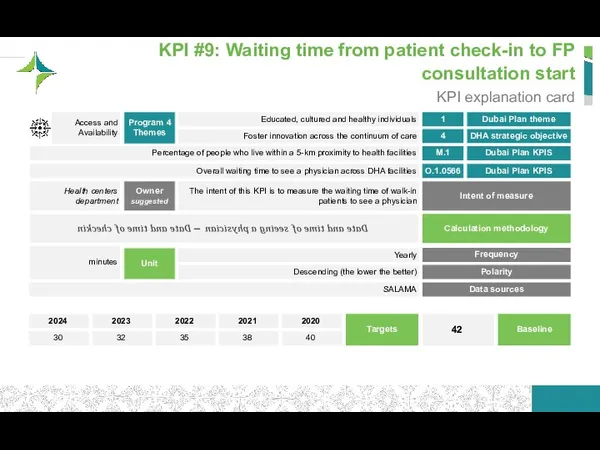
KPI #9: Waiting time from patient check-in to FP consultation start
KPI
KPI #9: Waiting time from patient check-in to FP consultation start
KPI
KPI #10: % of patients who received a mental health screening
KPI #10: % of patients who received a mental health screening
KPI #11: % of patients between 13 and 19 years old
KPI #11: % of patients between 13 and 19 years old
KPI #12: % of pregnant clients who received post-natal care
KPI explanation
KPI #12: % of pregnant clients who received post-natal care
KPI explanation

KPI #13: % of walk-in patients triaged in PHCs
KPI explanation card
Dubai
KPI #13: % of walk-in patients triaged in PHCs
KPI explanation card
Dubai
KPI #14: % of level 4 and 5 patients being diagnosed
KPI #14: % of level 4 and 5 patients being diagnosed
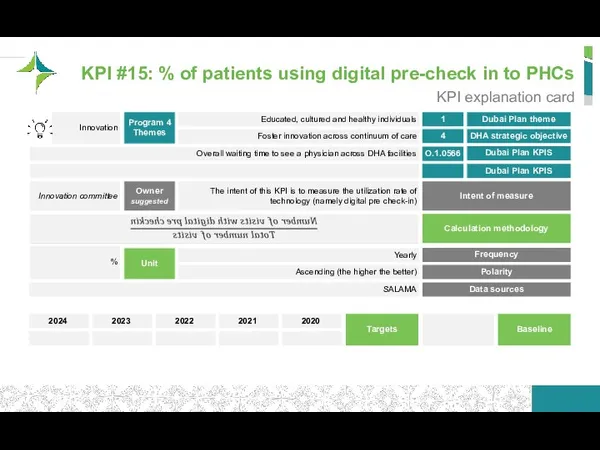
KPI #15: % of patients using digital pre-check in to PHCs
KPI #15: % of patients using digital pre-check in to PHCs
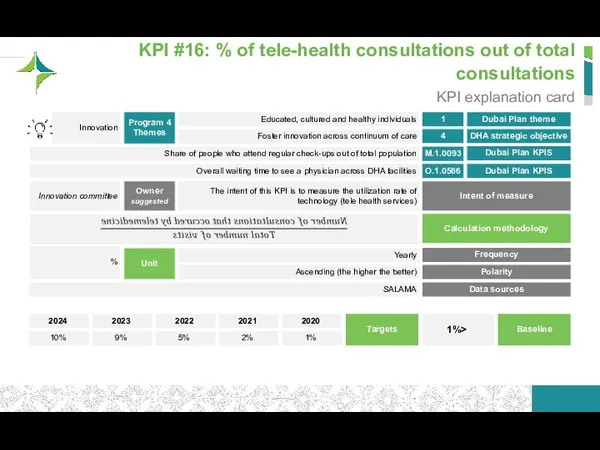
KPI #16: % of tele-health consultations out of total consultations
KPI explanation
KPI #16: % of tele-health consultations out of total consultations
KPI explanation
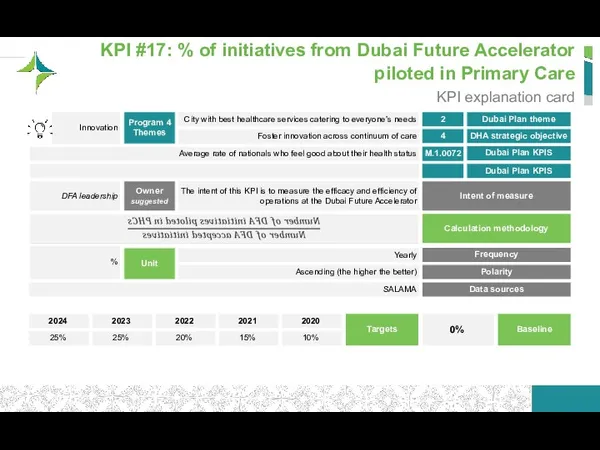
KPI #17: % of initiatives from Dubai Future Accelerator piloted in
KPI #17: % of initiatives from Dubai Future Accelerator piloted in
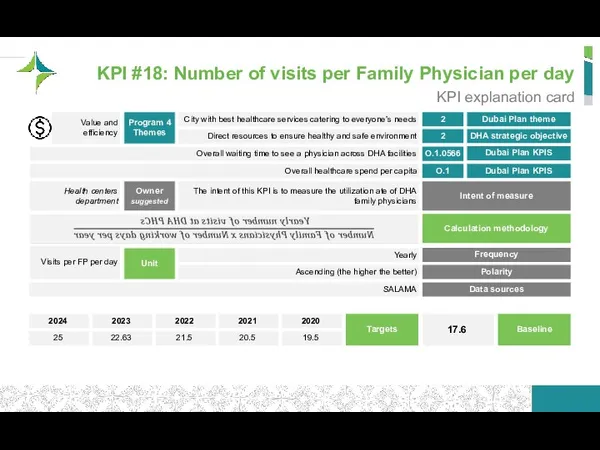
KPI #18: Number of visits per Family Physician per day
KPI explanation
KPI #18: Number of visits per Family Physician per day
KPI explanation

KPI #19: % of FP with specialty fellowships
KPI explanation card
Dubai Plan
KPI #19: % of FP with specialty fellowships
KPI explanation card
Dubai Plan
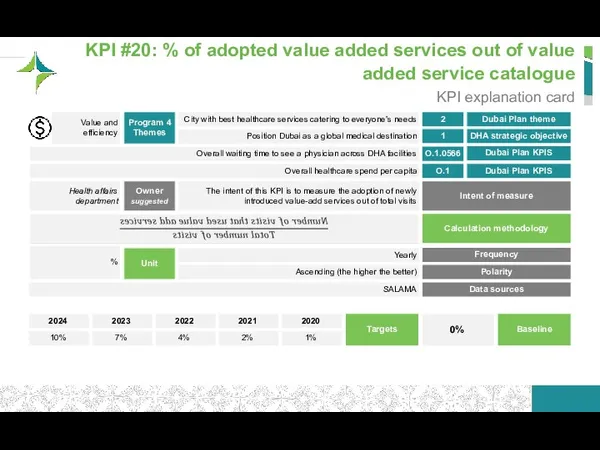
KPI #20: % of adopted value added services out of value
KPI #20: % of adopted value added services out of value
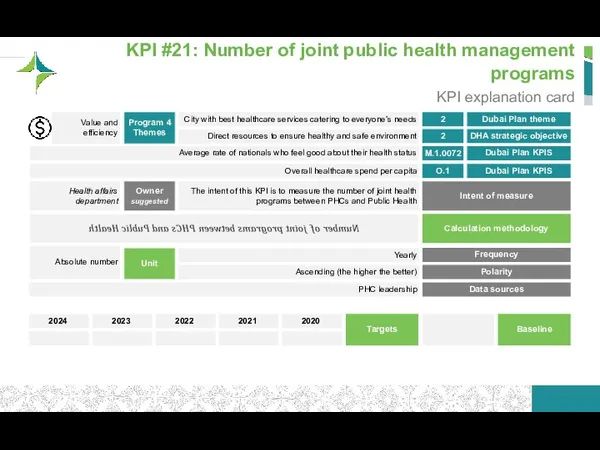
KPI #21: Number of joint public health management programs
KPI explanation card
Dubai
KPI #21: Number of joint public health management programs
KPI explanation card
Dubai
Agenda
Strategy Plan
Patient Journeys
Initiatives for Implementation
Business Case/ Financial Impact
Performance monitoring framework
Stakeholder map,
Agenda
Strategy Plan
Patient Journeys
Initiatives for Implementation
Business Case/ Financial Impact
Performance monitoring framework
Stakeholder map,
The Primary Care strategy requires alignment with a number of internal
The Primary Care strategy requires alignment with a number of internal
The Primary Care strategy requires alignment with a number of internal
The Primary Care strategy requires alignment with a number of internal
The Primary Care strategy requires alignment with a number of internal
The Primary Care strategy requires alignment with a number of internal
The Primary Care strategy requires alignment with a number of internal
The Primary Care strategy requires alignment with a number of internal
The Primary Care strategy requires alignment with a number of internal
The Primary Care strategy requires alignment with a number of internal
The Primary Care strategy requires alignment with a number of internal
The Primary Care strategy requires alignment with a number of internal
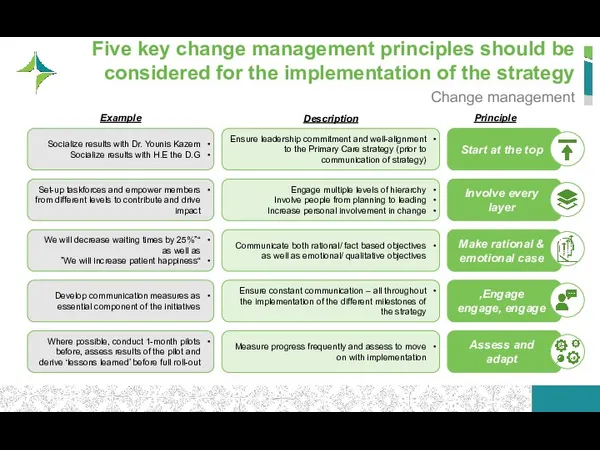
Five key change management principles should be considered for the implementation
Five key change management principles should be considered for the implementation
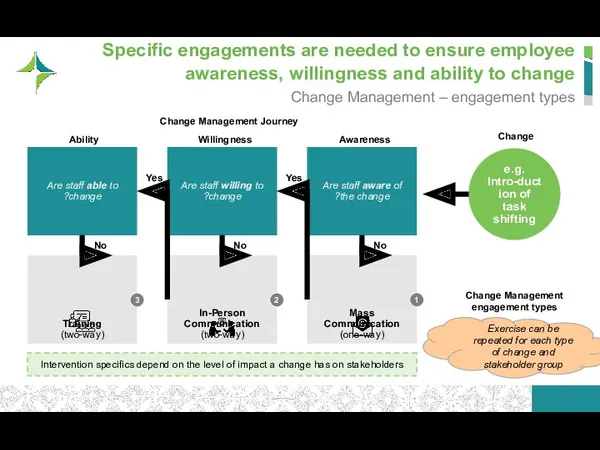
Specific engagements are needed to ensure employee awareness, willingness and ability
Specific engagements are needed to ensure employee awareness, willingness and ability
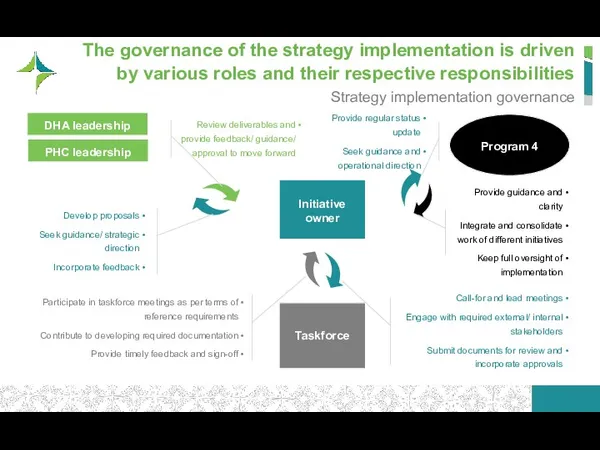
The governance of the strategy implementation is driven by various roles
The governance of the strategy implementation is driven by various roles
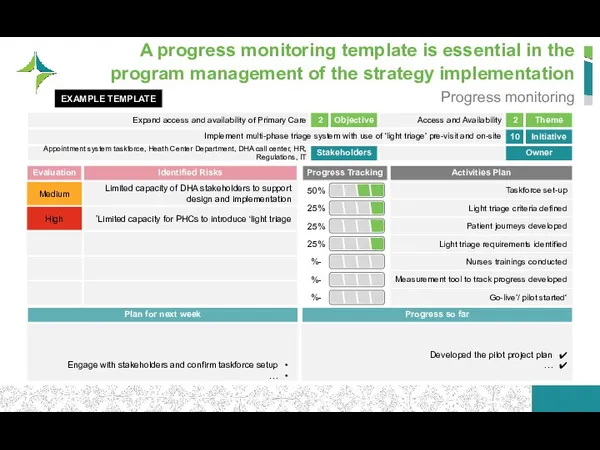
A progress monitoring template is essential in the program management of
A progress monitoring template is essential in the program management of
Table of Contents
Strategy Plan
Patient Journeys
Initiatives for Implementation
Business Case/ Financial Impact
Performance monitoring
Table of Contents
Strategy Plan
Patient Journeys
Initiatives for Implementation
Business Case/ Financial Impact
Performance monitoring
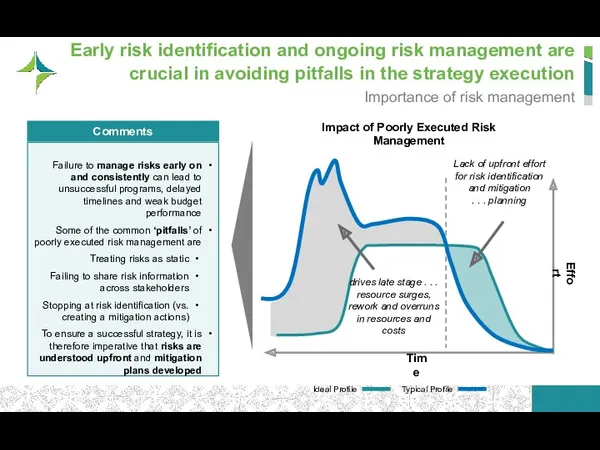
Early risk identification and ongoing risk management are crucial in avoiding
Early risk identification and ongoing risk management are crucial in avoiding
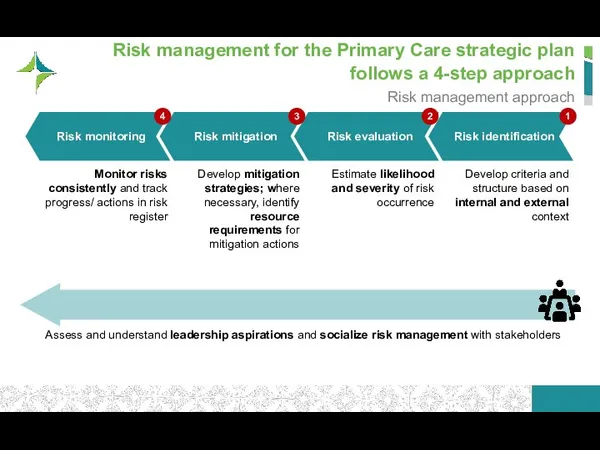
Risk management for the Primary Care strategic plan follows a 4-step
Risk management for the Primary Care strategic plan follows a 4-step
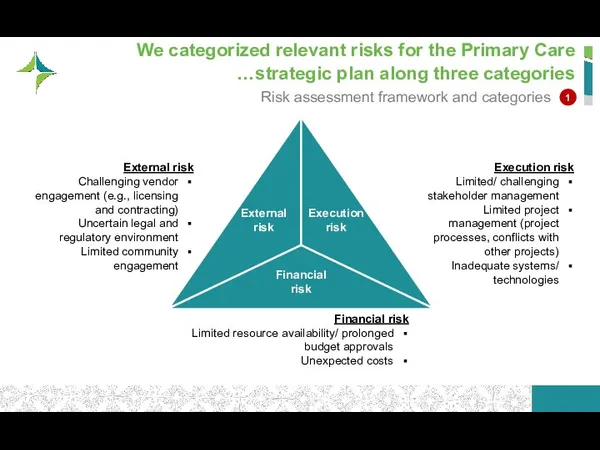
We categorized relevant risks for the Primary Care strategic plan along
We categorized relevant risks for the Primary Care strategic plan along
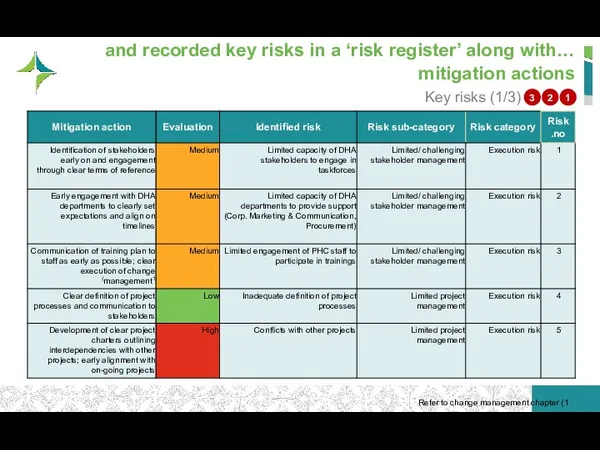
…and recorded key risks in a ‘risk register’ along with mitigation
…and recorded key risks in a ‘risk register’ along with mitigation
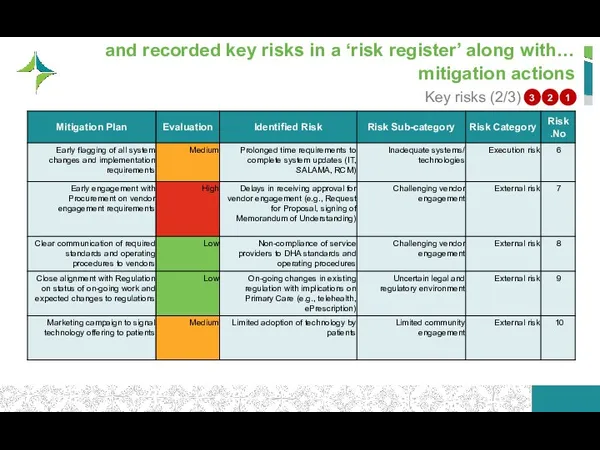
…and recorded key risks in a ‘risk register’ along with mitigation
…and recorded key risks in a ‘risk register’ along with mitigation
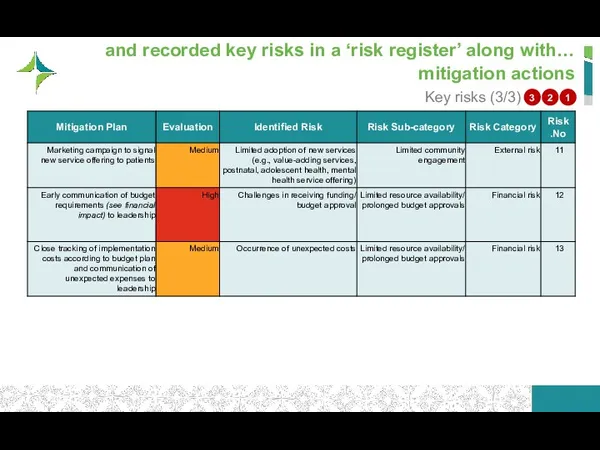
…and recorded key risks in a ‘risk register’ along with mitigation
…and recorded key risks in a ‘risk register’ along with mitigation
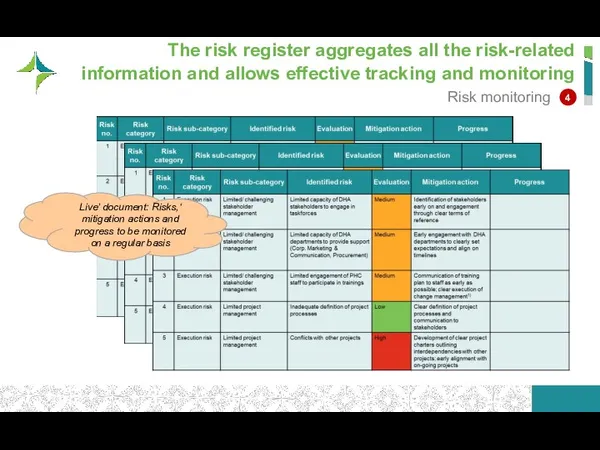
The risk register aggregates all the risk-related information and allows effective
The risk register aggregates all the risk-related information and allows effective
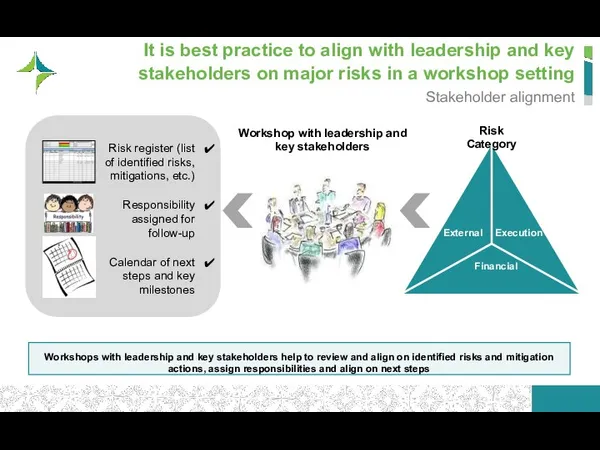
It is best practice to align with leadership and key stakeholders
It is best practice to align with leadership and key stakeholders
Table of Contents
Strategy Plan
Patient Journeys
Initiatives for Implementation
Business Case/ Financial Impact
Performance monitoring
Table of Contents
Strategy Plan
Patient Journeys
Initiatives for Implementation
Business Case/ Financial Impact
Performance monitoring
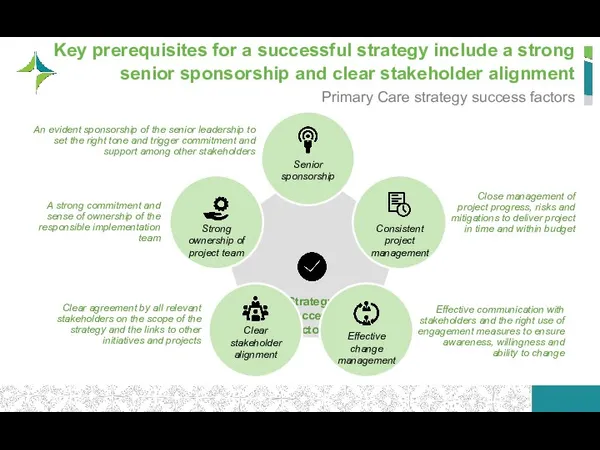
Key prerequisites for a successful strategy include a strong senior sponsorship
Key prerequisites for a successful strategy include a strong senior sponsorship
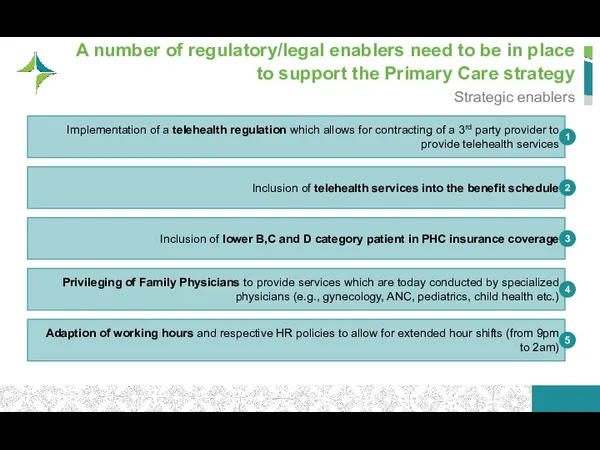
A number of regulatory/legal enablers need to be in place to
A number of regulatory/legal enablers need to be in place to
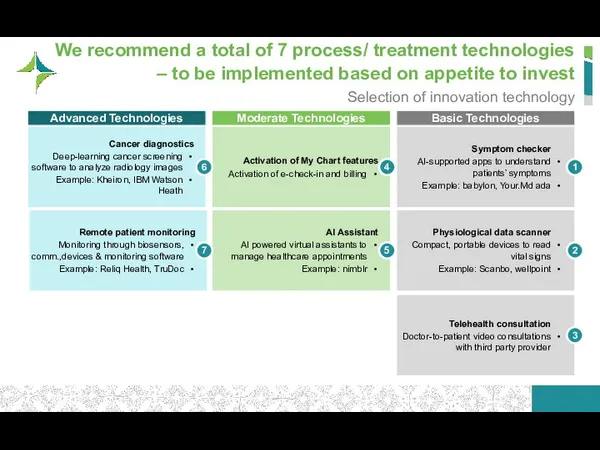
We recommend a total of 7 process/ treatment technologies – to
We recommend a total of 7 process/ treatment technologies – to

Artificial Intelligence can be utilized for diagnostics and prevention of chronic
Artificial Intelligence can be utilized for diagnostics and prevention of chronic
 Доктор Кэролайн Лиф
 Медицинская документация
 Факторы, влияющие на физическое развитие. Законы физического развития и принципы оценки. Семиотика нарушений
 Қолайсыз жағдайларда және апаттарда жедел жәрдем беру қызметінің ұйымдастырылуы
 Основы генетики. Лекция 2
 Диагностика родов и послеродового периода
 Роль Ильи Ильича Мечникова в развитии микробиологии и иммунологии
 Перитонит. Классификация
 Иммунодефициты (1)
 Неврологиялық бұзылыстары бар науқастардағы тері зақымданулары
 Натуральные соки
 Травматический шок и травматическая болезнь
 Нервная система
 Характеристика нарушений фонематического слуха у детей старшего дошкольного возраста с кохлеарным имплантом
 Огнестрельные раны и их лечение на этапах медицинской эвакуации
 Сахарный диабет у кошек и собак
 Образовательная программа^ профилактика ВИЧ-инфекции (для школьников и педагогов)
 Заболевания органов дыхания. Курсы повышения квалификации фельдшеров
 Мінливість у людини, як властивість життя і генетичне явище. (Лекція 6)
 Обучение в сестринском деле
 Международный совет по гармонизации технических требований к регистрации лекарственных средств для человека
 Диуретики (мочегонные средства )
 Гипертониялық криз
 Қанның қорғаныс қызметі
 Сүйектің эктопиялық дамуы
 Нарушение ритма сердечной деятельности
 Современные оттискные материалы
 Гемобластозы. Опухоли системы крови