- Right Heart Catheterization: Swan-Ganz Catheter

Содержание
- 2. Right Heart Catheterization Swan-Ganz Catheter: History Jeremy Swan (1922-2005), an Irish cardiologist, worked in the Mayo
- 3. Swan-Ganz Catheter: History Jeremy Swan (1922-2005), an Irish cardiologist, worked in the Mayo Clinic, Rochester, and
- 4. Swan-Ganz Catheter
- 5. The Pulmonary Artery Catheter: Swan-Ganz Catheter
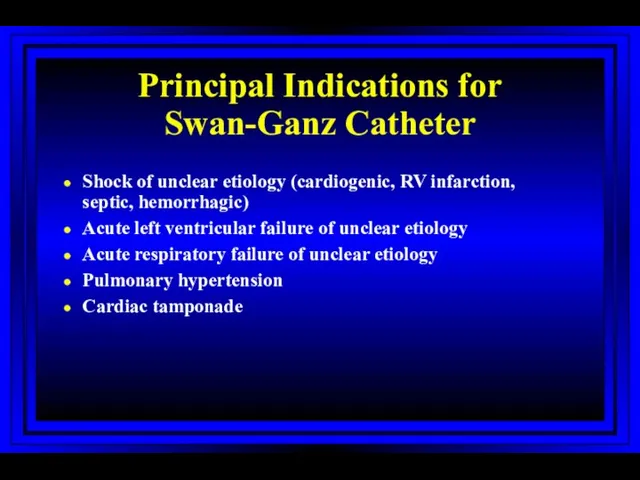
- 6. Principal Indications for Swan-Ganz Catheter Shock of unclear etiology (cardiogenic, RV infarction, septic, hemorrhagic) Acute left
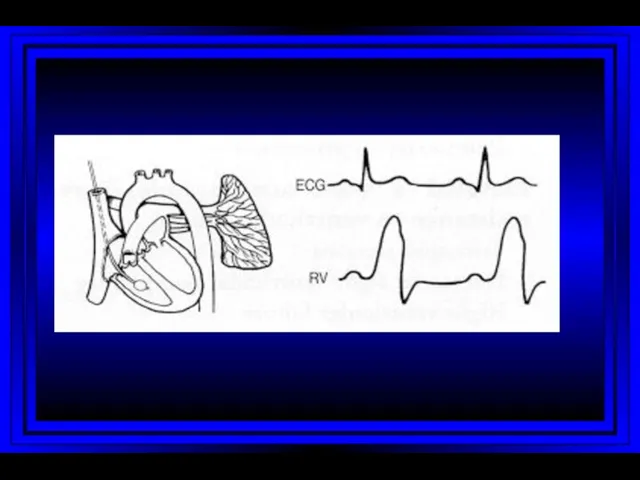
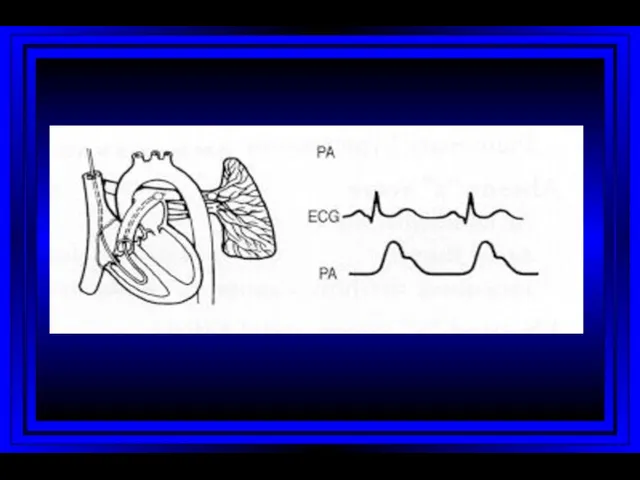
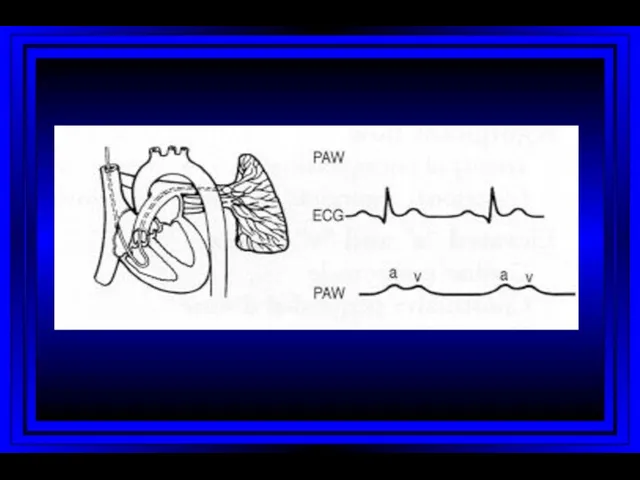
- 7. Right Heart Catheterization
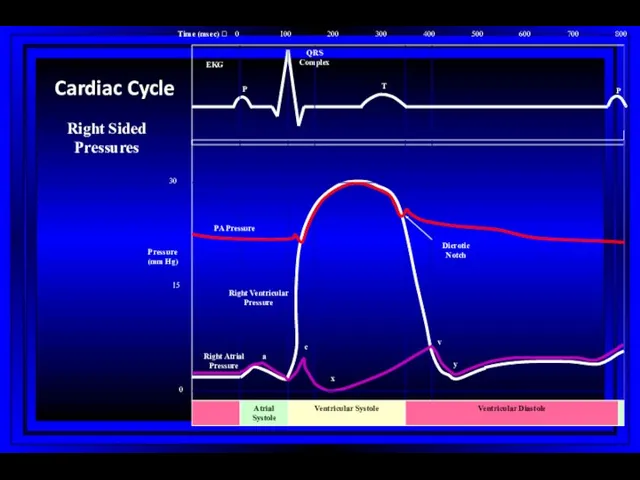
- 8. 0 100 200 300 400 500 600 700 800 0 15 30 Atrial Systole Ventricular Systole
- 9. Right Atrium Right Ventricle Pulmonary Artery PC Wedge Rt Heart Catheterization
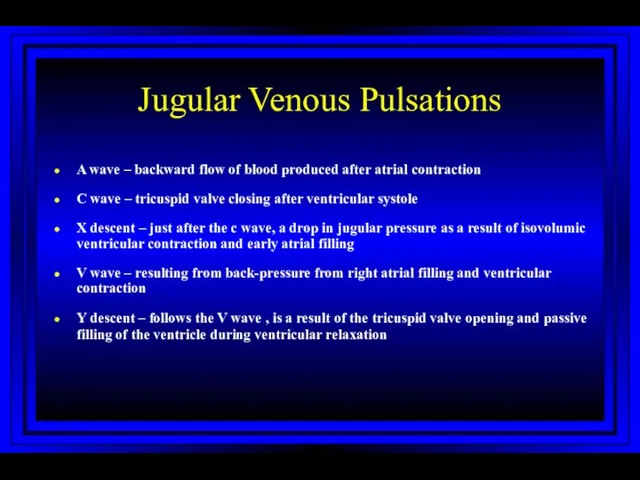
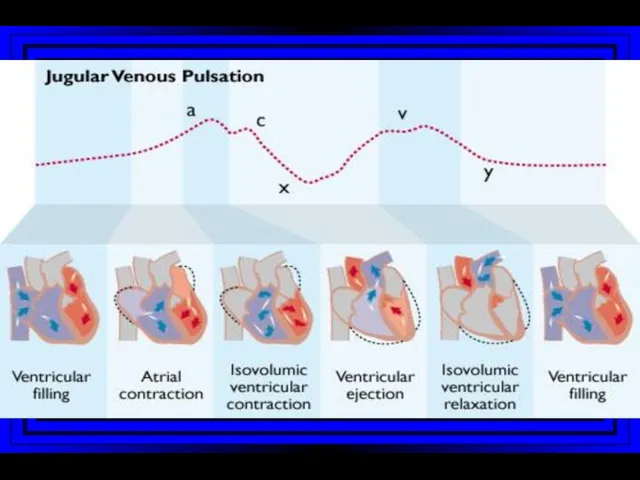
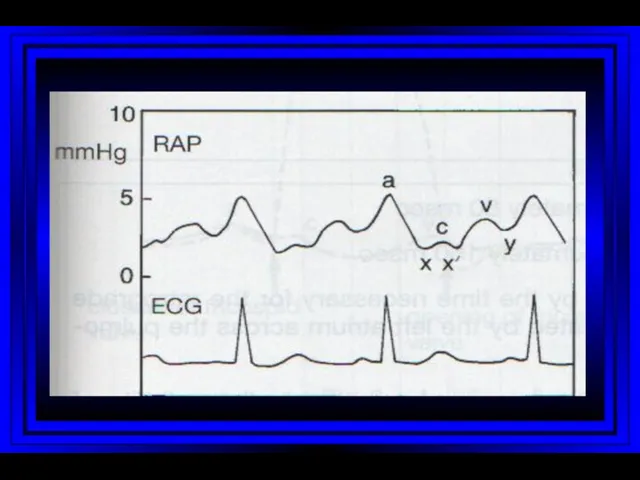
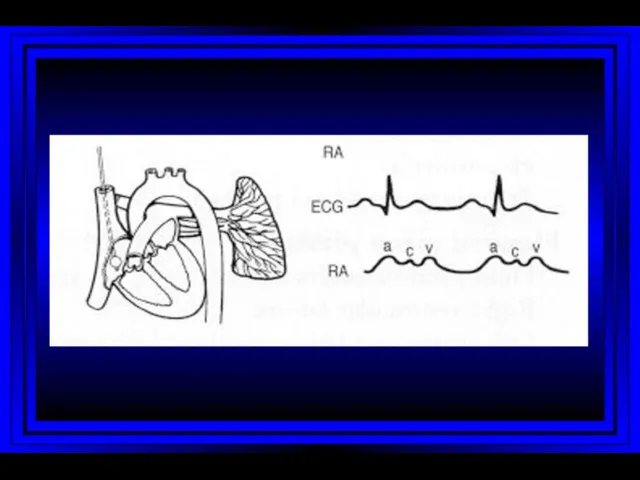
- 10. Jugular Venous Pulsations A wave – backward flow of blood produced after atrial contraction C wave
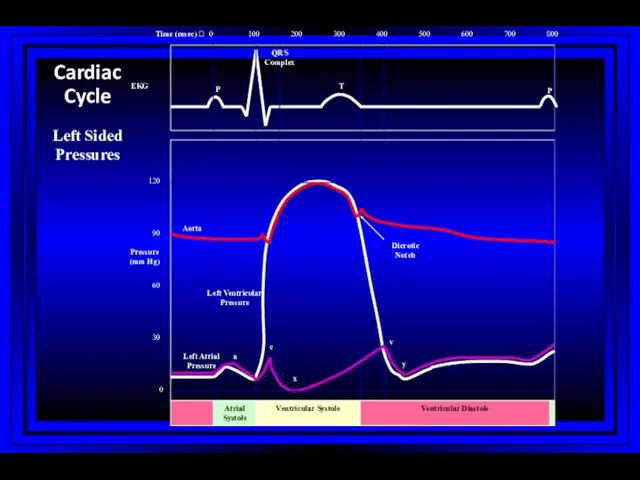
- 16. 0 100 200 300 400 500 600 700 800 0 30 60 90 120 Atrial Systole
- 18. Normal Cardiac Hemodynamics (Adult)
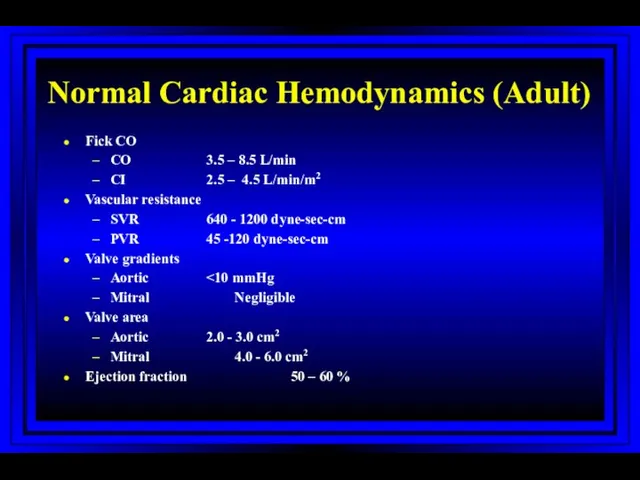
- 19. Normal Cardiac Hemodynamics (Adult) Fick CO CO 3.5 – 8.5 L/min CI 2.5 – 4.5 L/min/m2
- 20. Oxygen Parameters
- 21. Normal Pressures LA and PCW: Mean 4-12mmHg Aorta: Systolic 90-140mmHg Diastolic 60-90mmHg Mean 70-105mmHg Left Ventricle:
- 22. Measured Variables Mean and phasic arterial blood pressure Heart rate Mean right atrial pressure/waves Systolic and
- 23. Calculated Variables Cardiac index Stroke index Systemic vascular resistance Pulmonary vascular resistance Shunts Ventricular function Valvular
- 24. Stenotic Orifices Gradients Valve orifice cross-sectional areas Measurements assist in making decisions regarding surgical intervention
- 26. Mitral Stenosis Diastolic gradient from the left atrium to the left ventricle Atrial myxoma may produce
- 27. Cardiac Output Three main invasive methods of measurement Flick method Indicator-dilution method Angiographic method
- 28. Fick Method The amount of oxygen extracted by the lungs from air = The amount taken
- 29. The Indicator-dilution Technique and Thermodilution Technique Dilution of an indicator is proportional to the volume of
- 30. Cardiac Output (High) Acute Acute hypervolemia ARDS, severe pneumonia Septic shock Acute intoxications Fever, heat stress,
- 31. Cardiac Output (High) Chronic Severe chronic anemia Cirrhosis Chronic renal failure Pregnancy Thyrotoxicosis Polycythemia vera Labile
- 32. Cardiac Output (Low) Acute Acute hypovolemia (absolute or relative) Acute severe pulmonary hypertension Acute myocardial pump
- 33. Cardiac Output (Low) Acute Arrhythmias Sustained VT Extreme bradycardia Acute inotropic changes in a failing myocardium
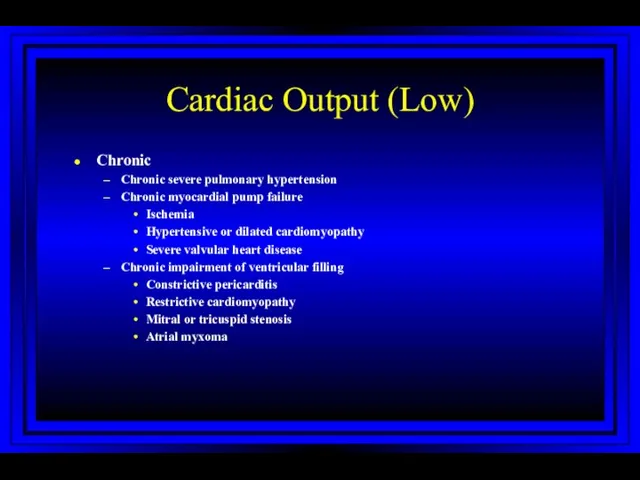
- 34. Cardiac Output (Low) Chronic Chronic severe pulmonary hypertension Chronic myocardial pump failure Ischemia Hypertensive or dilated
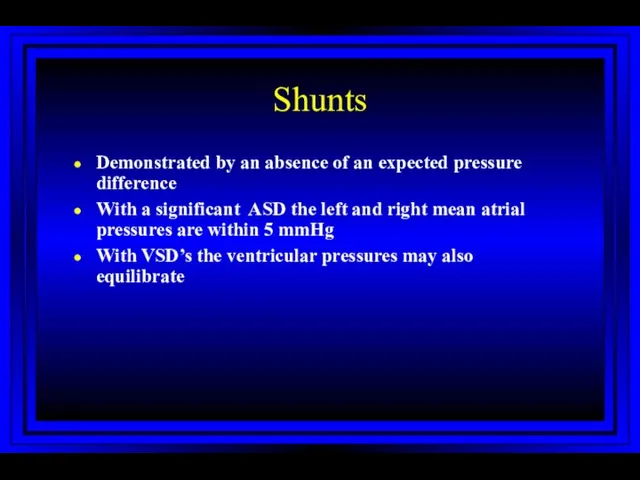
- 35. Shunts Demonstrated by an absence of an expected pressure difference With a significant ASD the left
- 36. Shunts Evaluation of shunts requires: Detection Classification Localization Quantitation
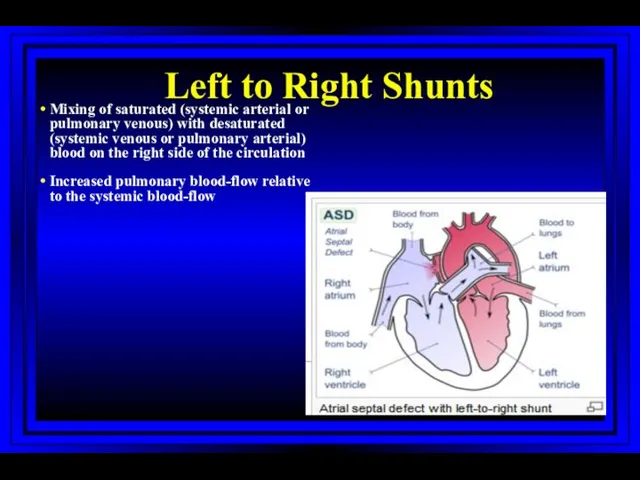
- 37. Left to Right Shunts Mixing of saturated (systemic arterial or pulmonary venous) with desaturated (systemic venous
- 38. Right to Left Shunts Mixing of desaturated (systemic venous or pulmonary arterial) with saturated (systemic arterial
- 39. Pulmonary Hypertension: Role of Right Heart Catheterization For diagnosis For evaluating acute vasodilator response For evaluating
- 40. PAH: Hemodynamic Definition PA = pulmonary artery; PVR = pulmonary vascular resistance; TPG = transpulmonary gradient
- 41. PAH Hemodynamic Calculations TPG: Transpulmonary gradient = PAmean – PCWmean CO: Cardiac Output (L/min) - by
- 42. Swan-Ganz Catheter Related Complications Harvey S et al. The Lancet 2005; 366:472-477
- 43. Wiggers Diagram
- 44. Left Heart Catheterization: History First human catheterization by Werner Forssmann: 1929 His work was not recognized
- 45. Vascular Access: Left Heart Cath Sones’ technique (brachial approach) Judkin’s technique (femoral approach) Radial approach
- 46. Left Heart Catheterization Coronary angiography Left ventriculogram Ascending aortogram Pressure measurements in LV/aorta
- 47. Cardiac Angiography: Ventriculography A contrast roadmap of the left ventricle allows for evaluation of: Ventricular chamber
- 48. Wall Motion Abnormalities
- 49. Aortic Stenosis
- 50. Coronary Anatomy Depending on coronary anatomy: 1 VD, 2 VD and 3 VD; LMCA disease mm
- 51. Treatment Strategies of CAD Medical treatment, PCI or CABG - for pts with distal CAD; risk
- 52. Percutaneous Coronary Interventions (PCI) 1977: 1st Coronary angioplasty by Gruntzig Limitation: restenosis 1939-1985
- 53. PCI Procedural refinements: Stents Expandable metal mesh tubes that buttresses the dilated segment, limit restenosis. Drug
- 54. Treatment Strategies of CAD Stable angina Unstable angina/non ST-elevation MI - Risk stratification; high-risk patients: elderly,
- 55. Treatment Strategies of CAD Stable angina Unstable angina/non ST-elevation MI - Risk stratification; high-risk patients: elderly,
- 56. STEMI: PCI vs. Thrombolysis Advantages of PCI Knowledge of CA anatomy Complete opening of the artery
- 57. Baseline LAO Baseline LAO/Cranial Baseline RAO Baseline Angiogram of Patient with Prolonged Anginal Pain and ST-elevation
- 58. Post PTCA with stent
- 59. Left Heart Catheterization: Complications Early: Death: 0.1-0.2% Acute MI : 0.5% CVA: 0.05% Severe arrhythmia: 1%
- 60. Contrast Induced Nephropathy: Pathogenesis Hemodynamic changes Reduction renal blood flow Deceleration of red blood cell velocity
- 61. Risk Factors for the Development of Contrast-Induced Nephropathy
- 62. Treatment Modalities Assessed in Randomized Trials on Prevention of CIN + positive effect; – no effect;
- 63. Intraaortic Balloon Catheter Inner Pressure Lumen Gas Shuttle Lumen Catheter Tip Membrane Sheath
- 64. • ↓ Cardiac Work • ↓ Myocardial O2 Consumption • ↑ Cardiac Output Principles of Counterpulsation
- 65. Impella Device
- 66. SYNERGY 1994 1995 1996 1997 1998 1999 2000 2002 2003 2004 2005 2006 2001 Bleeding risk
- 67. Dynamics of Antithrombotic Therapy in Patients with ACS and Patients Undergoing PCI Aspirin Aspirin Aspirin Aspirin
- 68. Mechanical Heart Failure Devices Mancini D, Burkoff D, Circulation, 2005;112:438-446
- 69. PARTNER Study Design N = 358 Inoperable Standard Therapy n = 179 ASSESSMENT: Transfemoral Access TF
- 70. All-Cause Mortality Landmark Analysis
- 71. Catheter-Based Mitral Valve Repair: MitraClip® System
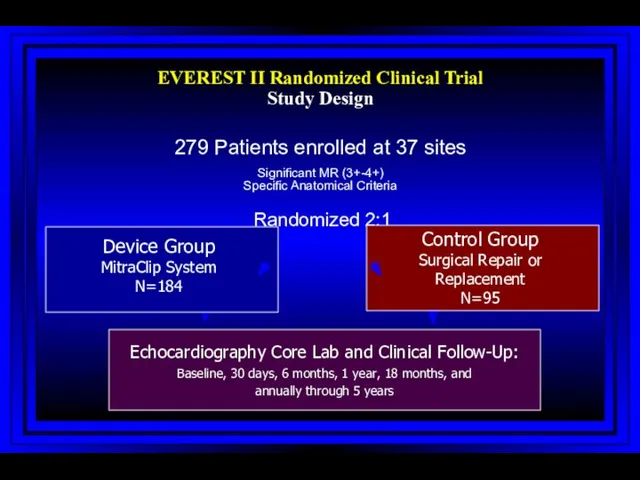
- 72. Investigational Device only in the US; Not available for sale in the US EVEREST II Randomized
- 74. Скачать презентацию
Right Heart Catheterization
Swan-Ganz Catheter: History
Jeremy Swan (1922-2005), an Irish cardiologist, worked
Right Heart Catheterization
Swan-Ganz Catheter: History
Jeremy Swan (1922-2005), an Irish cardiologist, worked
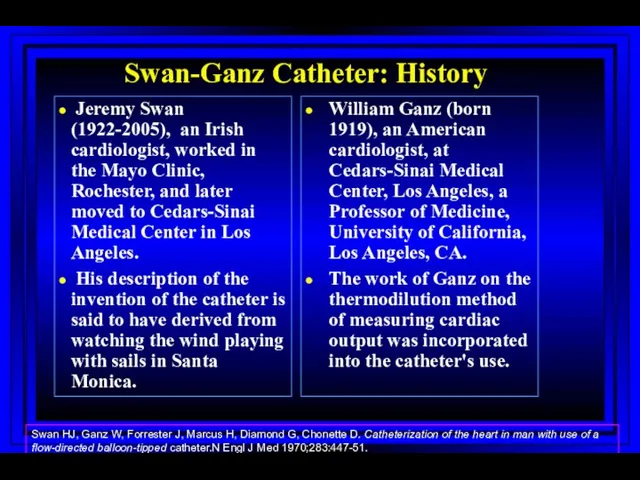
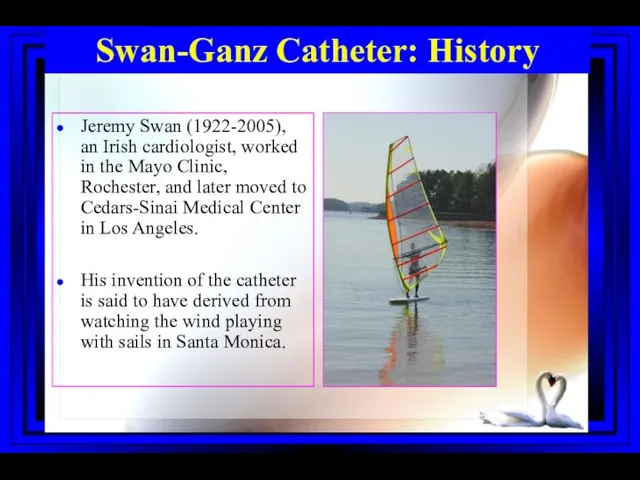
Swan-Ganz Catheter: History
Jeremy Swan (1922-2005), an Irish cardiologist, worked in
Swan-Ganz Catheter: History
Jeremy Swan (1922-2005), an Irish cardiologist, worked in
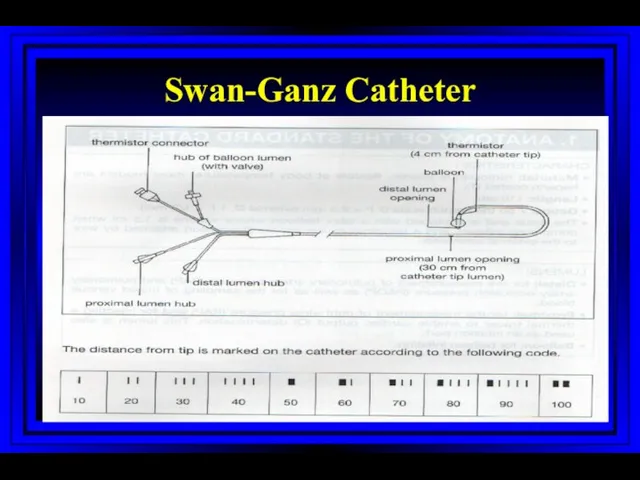
Swan-Ganz Catheter
Swan-Ganz Catheter
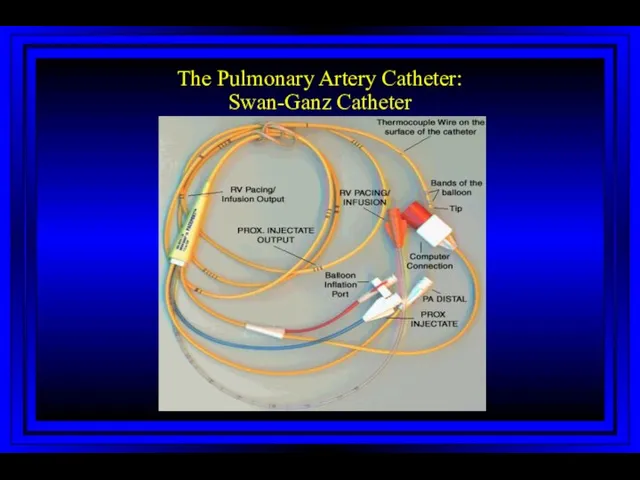
The Pulmonary Artery Catheter:
Swan-Ganz Catheter
The Pulmonary Artery Catheter:
Swan-Ganz Catheter
Principal Indications for
Swan-Ganz Catheter
Shock of unclear etiology (cardiogenic, RV infarction,
Principal Indications for
Swan-Ganz Catheter
Shock of unclear etiology (cardiogenic, RV infarction,
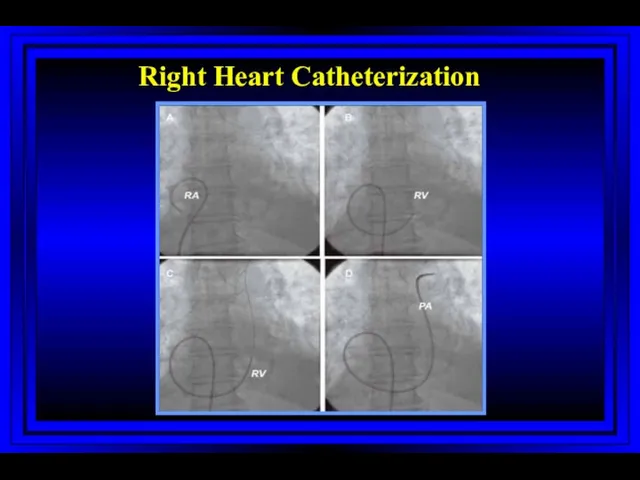
Right Heart Catheterization
Right Heart Catheterization
0
100
200
300
400
500
600
700
800
0
15
30
Atrial Systole
Ventricular Systole
Ventricular Diastole
EKG
Time (msec) ?
Pressure (mm Hg)
P
QRS Complex
T
P
PA Pressure
Dicrotic Notch
Right
0
100
200
300
400
500
600
700
800
0
15
30
Atrial Systole
Ventricular Systole
Ventricular Diastole
EKG
Time (msec) ?
Pressure (mm Hg)
P
QRS Complex
T
P
PA Pressure
Dicrotic Notch
Right
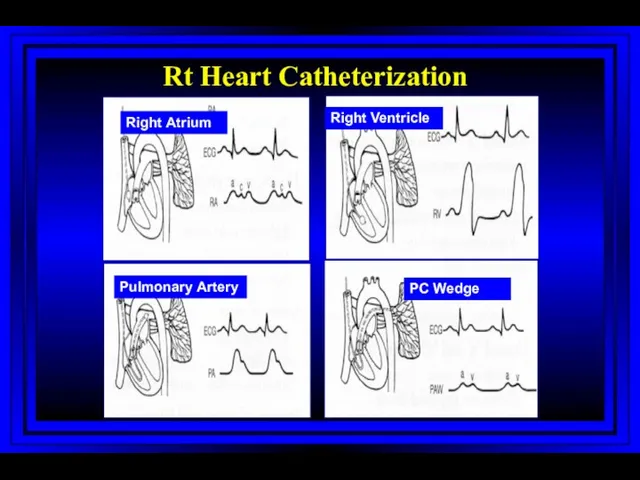
Right Atrium
Right Ventricle
Pulmonary Artery
PC Wedge
Rt Heart Catheterization
Right Atrium
Right Ventricle
Pulmonary Artery
PC Wedge
Rt Heart Catheterization
Jugular Venous Pulsations
A wave – backward flow of blood produced after
Jugular Venous Pulsations
A wave – backward flow of blood produced after
0
100
200
300
400
500
600
700
800
0
30
60
90
120
Atrial Systole
Ventricular Systole
Ventricular Diastole
EKG
Time (msec) ?
Pressure (mm Hg)
P
QRS Complex
T
P
Aorta
Dicrotic Notch
Left Ventricular
0
100
200
300
400
500
600
700
800
0
30
60
90
120
Atrial Systole
Ventricular Systole
Ventricular Diastole
EKG
Time (msec) ?
Pressure (mm Hg)
P
QRS Complex
T
P
Aorta
Dicrotic Notch
Left Ventricular
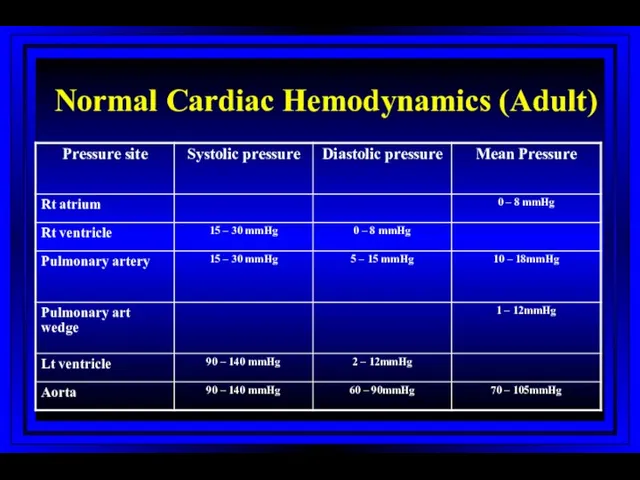
Normal Cardiac Hemodynamics (Adult)
Normal Cardiac Hemodynamics (Adult)
Normal Cardiac Hemodynamics (Adult)
Fick CO
CO 3.5 – 8.5 L/min
CI 2.5 – 4.5 L/min/m2
Vascular
Normal Cardiac Hemodynamics (Adult)
Fick CO
CO 3.5 – 8.5 L/min
CI 2.5 – 4.5 L/min/m2
Vascular
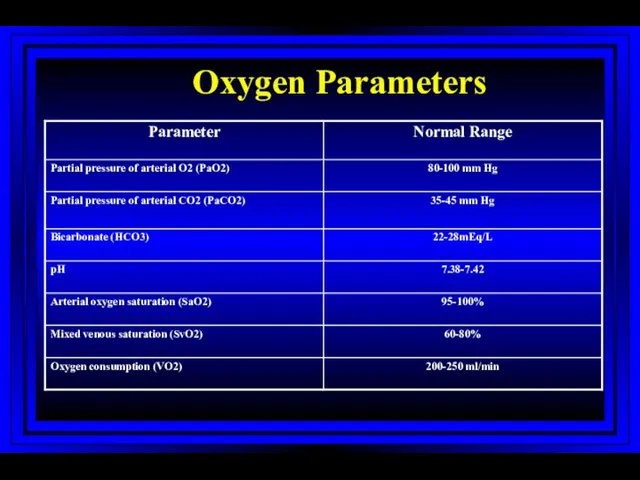
Oxygen Parameters
Oxygen Parameters
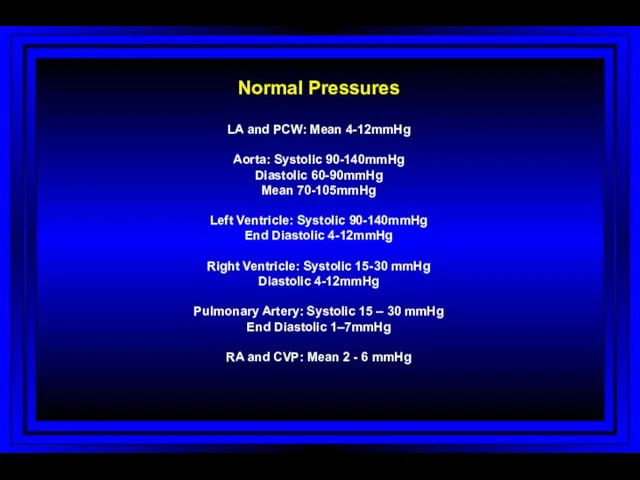
Normal Pressures
LA and PCW: Mean 4-12mmHg
Aorta: Systolic 90-140mmHg
Diastolic 60-90mmHg
Mean 70-105mmHg
Left Ventricle:
Normal Pressures
LA and PCW: Mean 4-12mmHg
Aorta: Systolic 90-140mmHg
Diastolic 60-90mmHg
Mean 70-105mmHg
Left Ventricle:
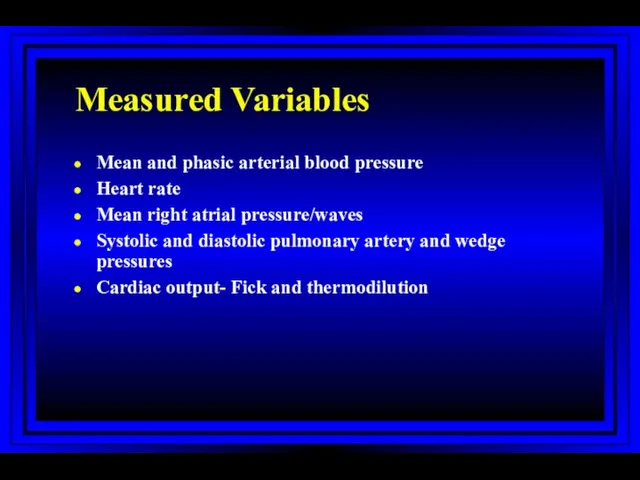
Measured Variables
Mean and phasic arterial blood pressure
Heart rate
Mean right atrial pressure/waves
Systolic
Measured Variables
Mean and phasic arterial blood pressure
Heart rate
Mean right atrial pressure/waves
Systolic
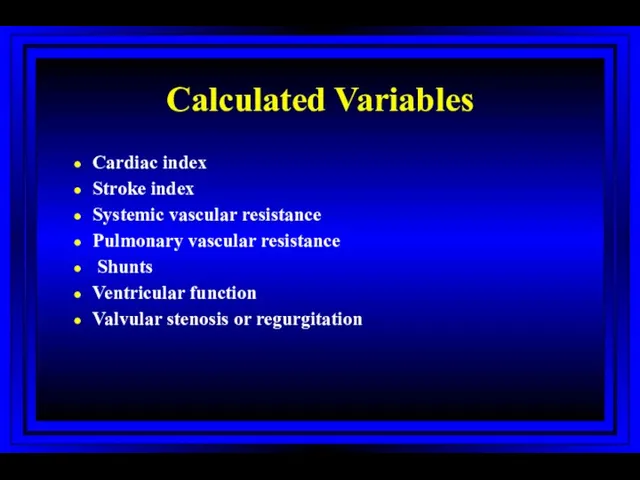
Calculated Variables
Cardiac index
Stroke index
Systemic vascular resistance
Pulmonary vascular resistance
Shunts
Ventricular function
Valvular stenosis
Calculated Variables
Cardiac index
Stroke index
Systemic vascular resistance
Pulmonary vascular resistance
Shunts
Ventricular function
Valvular stenosis
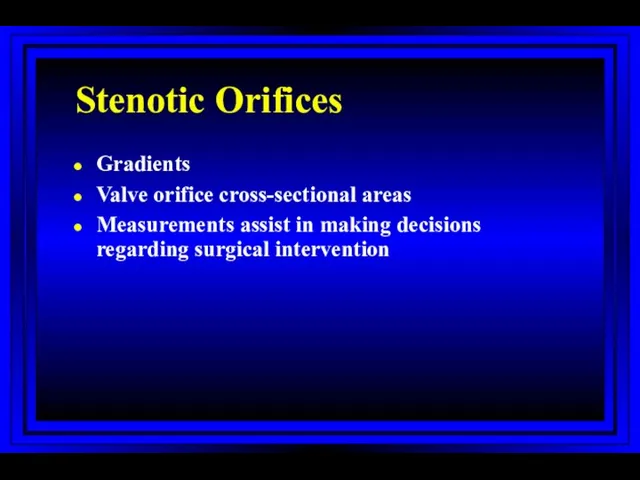
Stenotic Orifices
Gradients
Valve orifice cross-sectional areas
Measurements assist in making decisions regarding surgical
Stenotic Orifices
Gradients
Valve orifice cross-sectional areas
Measurements assist in making decisions regarding surgical
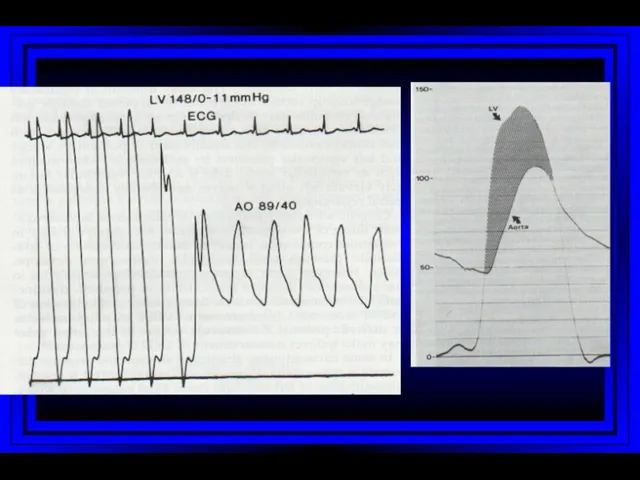
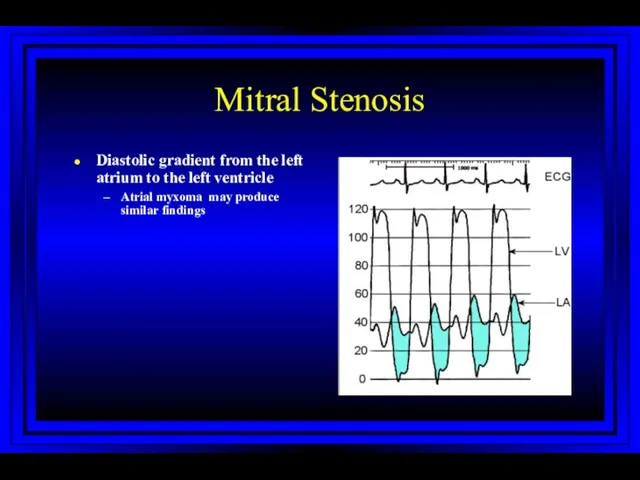
Mitral Stenosis
Diastolic gradient from the left atrium to the left ventricle
Atrial
Mitral Stenosis
Diastolic gradient from the left atrium to the left ventricle
Atrial
Cardiac Output
Three main invasive methods of measurement
Flick method
Indicator-dilution method
Angiographic method
Cardiac Output
Three main invasive methods of measurement
Flick method
Indicator-dilution method
Angiographic method
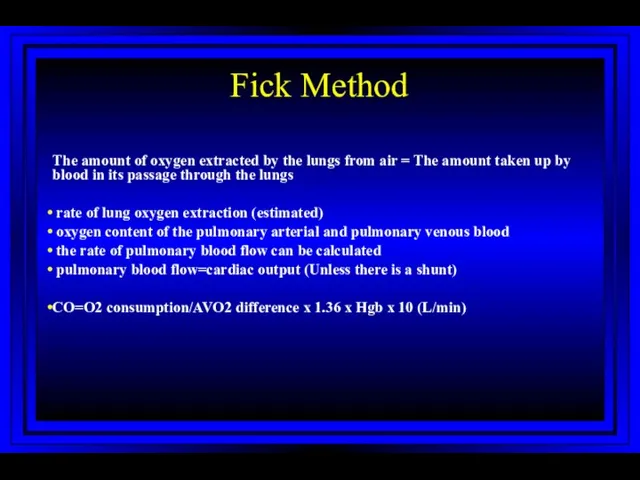
Fick Method
The amount of oxygen extracted by the lungs from
Fick Method
The amount of oxygen extracted by the lungs from
The Indicator-dilution Technique and Thermodilution Technique
Dilution of an indicator is
The Indicator-dilution Technique and Thermodilution Technique
Dilution of an indicator is
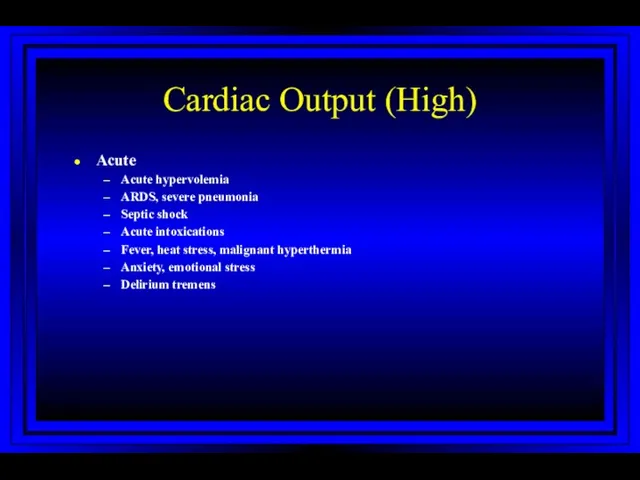
Cardiac Output (High)
Acute
Acute hypervolemia
ARDS, severe pneumonia
Septic shock
Acute intoxications
Fever, heat stress,
Cardiac Output (High)
Acute
Acute hypervolemia
ARDS, severe pneumonia
Septic shock
Acute intoxications
Fever, heat stress,
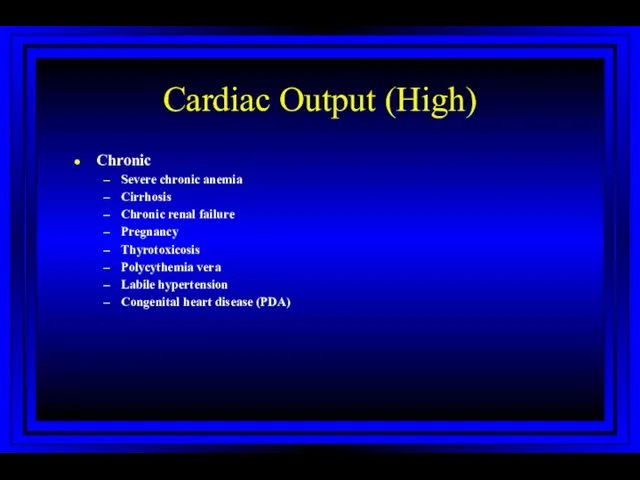
Cardiac Output (High)
Chronic
Severe chronic anemia
Cirrhosis
Chronic renal failure
Pregnancy
Thyrotoxicosis
Polycythemia vera
Labile hypertension
Congenital heart disease
Cardiac Output (High)
Chronic
Severe chronic anemia
Cirrhosis
Chronic renal failure
Pregnancy
Thyrotoxicosis
Polycythemia vera
Labile hypertension
Congenital heart disease
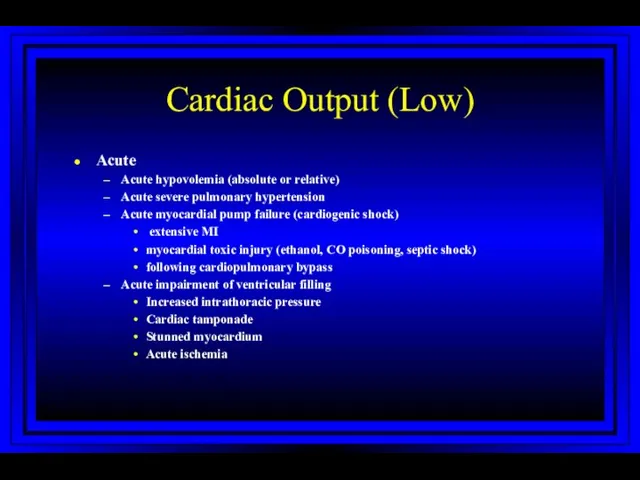
Cardiac Output (Low)
Acute
Acute hypovolemia (absolute or relative)
Acute severe pulmonary hypertension
Acute myocardial
Cardiac Output (Low)
Acute
Acute hypovolemia (absolute or relative)
Acute severe pulmonary hypertension
Acute myocardial
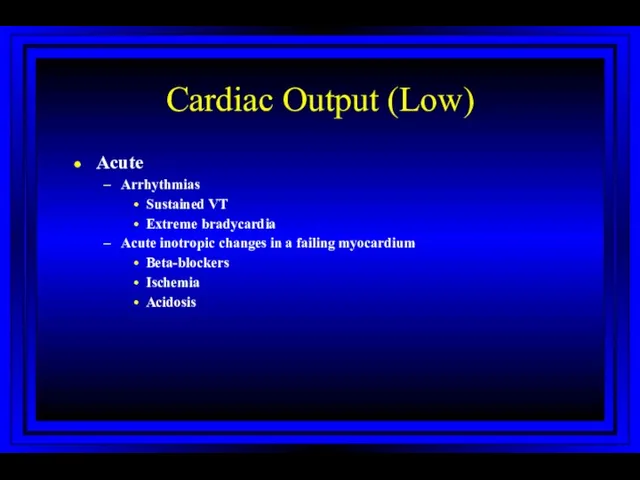
Cardiac Output (Low)
Acute
Arrhythmias
Sustained VT
Extreme bradycardia
Acute inotropic changes in a failing myocardium
Beta-blockers
Ischemia
Acidosis
Cardiac Output (Low)
Acute
Arrhythmias
Sustained VT
Extreme bradycardia
Acute inotropic changes in a failing myocardium
Beta-blockers
Ischemia
Acidosis
Cardiac Output (Low)
Chronic
Chronic severe pulmonary hypertension
Chronic myocardial pump failure
Ischemia
Hypertensive or dilated
Cardiac Output (Low)
Chronic
Chronic severe pulmonary hypertension
Chronic myocardial pump failure
Ischemia
Hypertensive or dilated
Shunts
Demonstrated by an absence of an expected pressure difference
With a significant
Shunts
Demonstrated by an absence of an expected pressure difference
With a significant
Shunts
Evaluation of shunts requires:
Detection
Classification
Localization
Quantitation
Shunts
Evaluation of shunts requires:
Detection
Classification
Localization
Quantitation
Left to Right Shunts
Mixing of saturated (systemic arterial or pulmonary venous)
Left to Right Shunts
Mixing of saturated (systemic arterial or pulmonary venous)
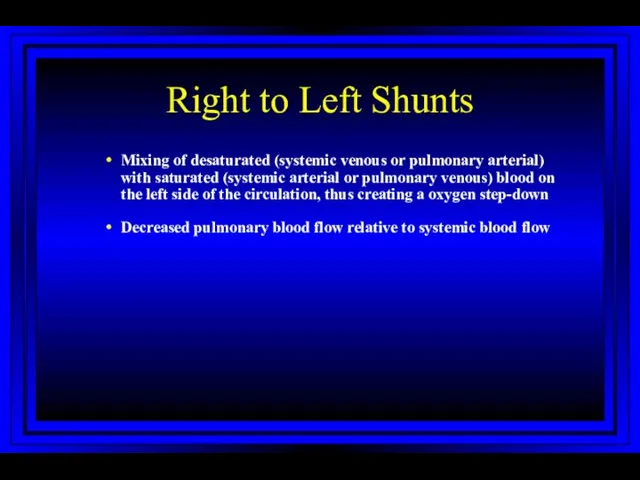
Right to Left Shunts
Mixing of desaturated (systemic venous or pulmonary arterial)
Right to Left Shunts
Mixing of desaturated (systemic venous or pulmonary arterial)
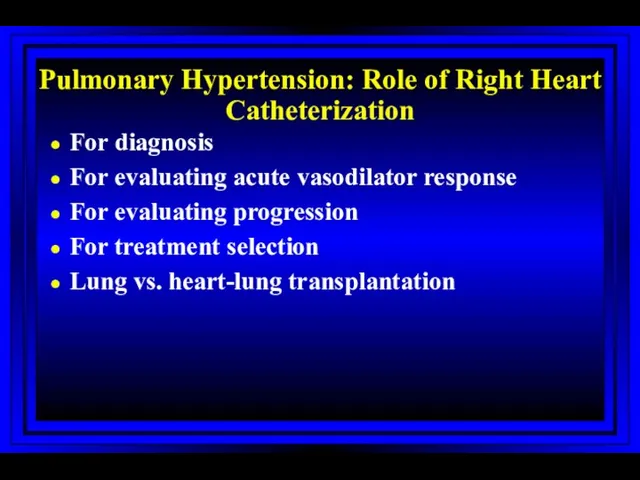
Pulmonary Hypertension: Role of Right Heart Catheterization
For diagnosis
For evaluating acute vasodilator
Pulmonary Hypertension: Role of Right Heart Catheterization
For diagnosis
For evaluating acute vasodilator
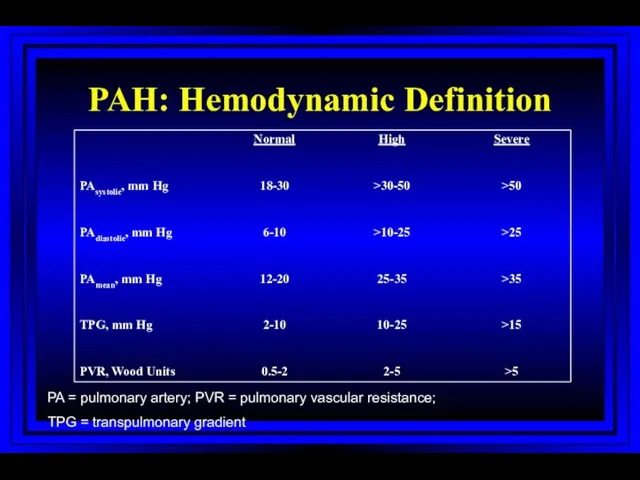
PAH: Hemodynamic Definition
PA = pulmonary artery; PVR = pulmonary vascular resistance;
PAH: Hemodynamic Definition
PA = pulmonary artery; PVR = pulmonary vascular resistance;
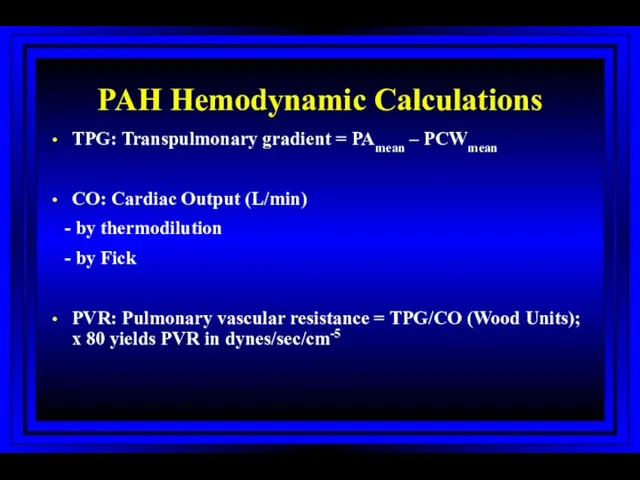
PAH Hemodynamic Calculations
TPG: Transpulmonary gradient = PAmean – PCWmean
CO: Cardiac Output
PAH Hemodynamic Calculations
TPG: Transpulmonary gradient = PAmean – PCWmean
CO: Cardiac Output
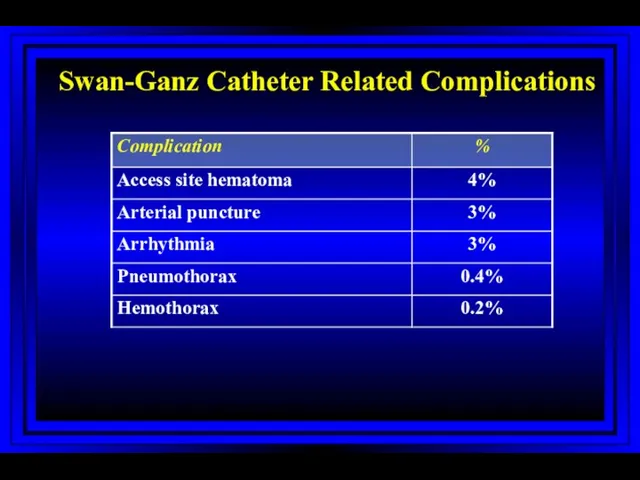
Swan-Ganz Catheter Related Complications
Harvey S et al. The Lancet 2005; 366:472-477
Swan-Ganz Catheter Related Complications
Harvey S et al. The Lancet 2005; 366:472-477
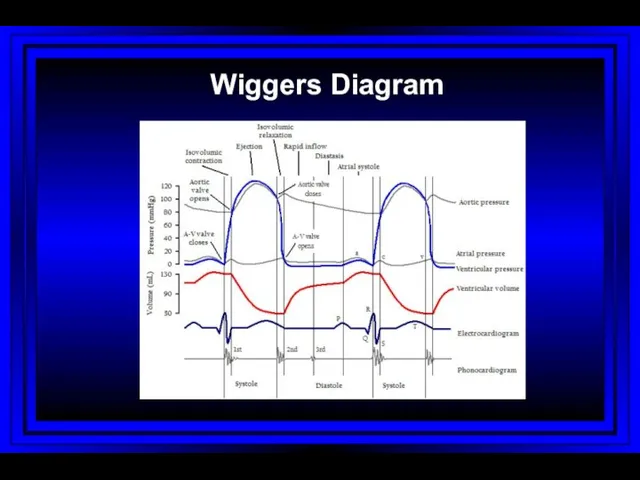
Wiggers Diagram
Wiggers Diagram
Left Heart Catheterization: History
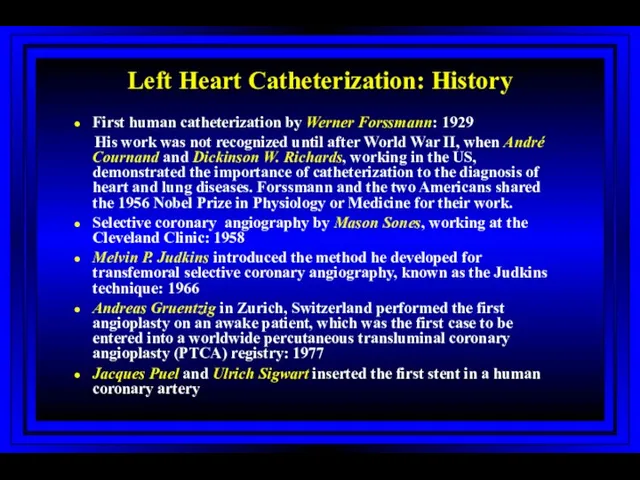
First human catheterization by Werner Forssmann: 1929
His
Left Heart Catheterization: History
First human catheterization by Werner Forssmann: 1929
His
Vascular Access: Left Heart Cath
Sones’ technique (brachial approach)
Judkin’s technique (femoral approach)
Radial
Vascular Access: Left Heart Cath
Sones’ technique (brachial approach)
Judkin’s technique (femoral approach)
Radial
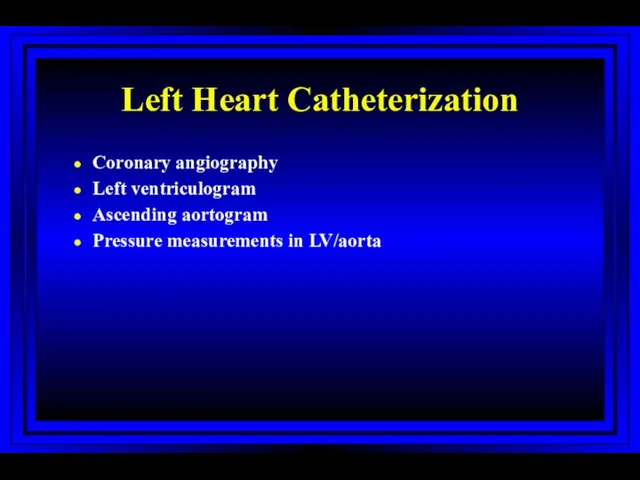
Left Heart Catheterization
Coronary angiography
Left ventriculogram
Ascending aortogram
Pressure measurements in LV/aorta
Left Heart Catheterization
Coronary angiography
Left ventriculogram
Ascending aortogram
Pressure measurements in LV/aorta
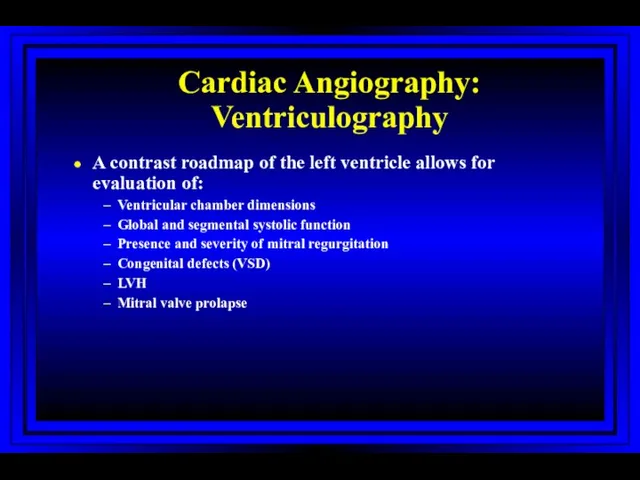
Cardiac Angiography: Ventriculography
A contrast roadmap of the left ventricle allows for
Cardiac Angiography: Ventriculography
A contrast roadmap of the left ventricle allows for
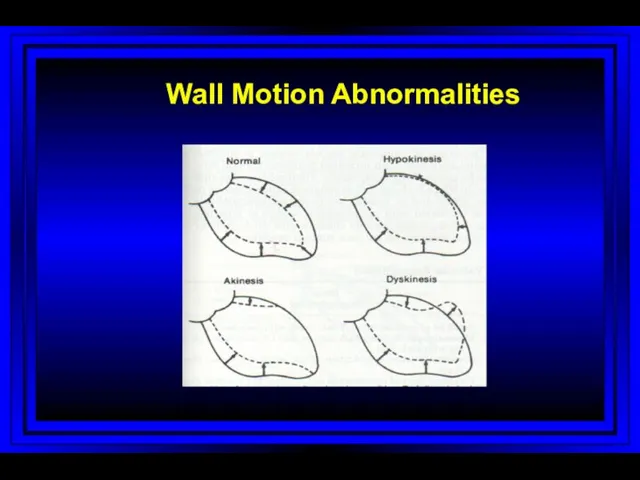
Wall Motion Abnormalities
Wall Motion Abnormalities
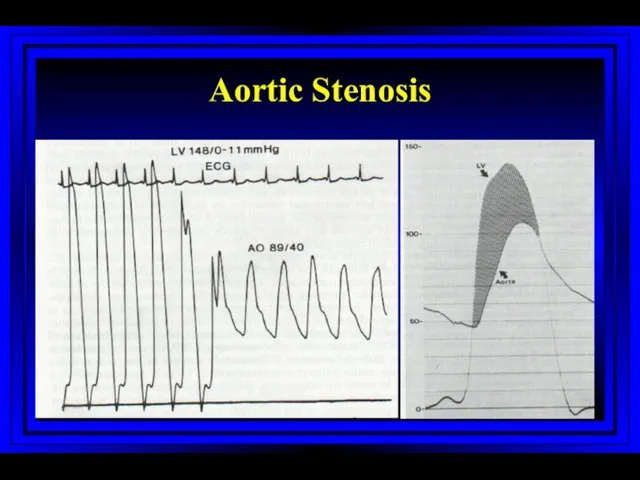
Aortic Stenosis
Aortic Stenosis
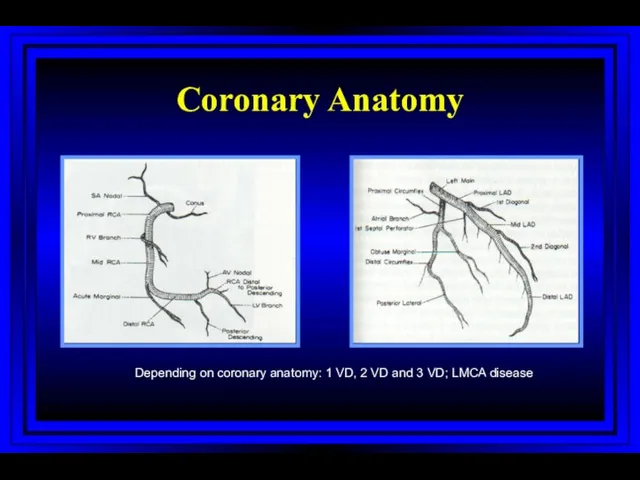
Coronary Anatomy
Depending on coronary anatomy: 1 VD, 2 VD and 3
Coronary Anatomy
Depending on coronary anatomy: 1 VD, 2 VD and 3
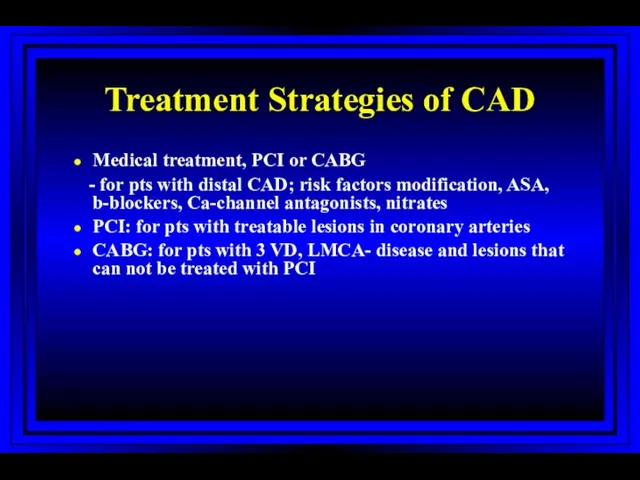
Treatment Strategies of CAD
Medical treatment, PCI or CABG
- for pts
Treatment Strategies of CAD
Medical treatment, PCI or CABG
- for pts
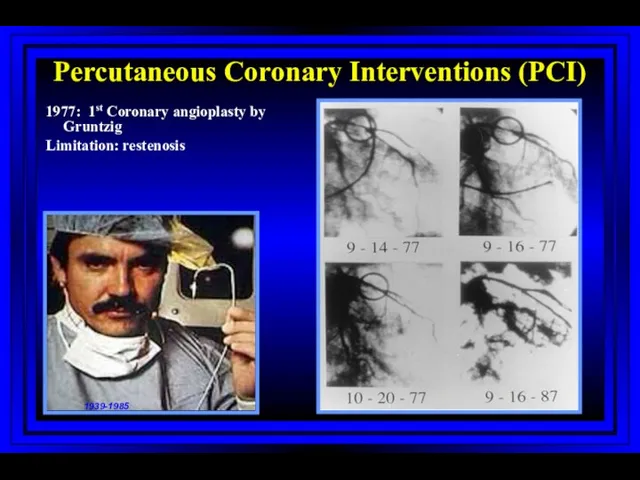
Percutaneous Coronary Interventions (PCI)
1977: 1st Coronary angioplasty by Gruntzig
Limitation: restenosis
1939-1985
Percutaneous Coronary Interventions (PCI)
1977: 1st Coronary angioplasty by Gruntzig
Limitation: restenosis
1939-1985
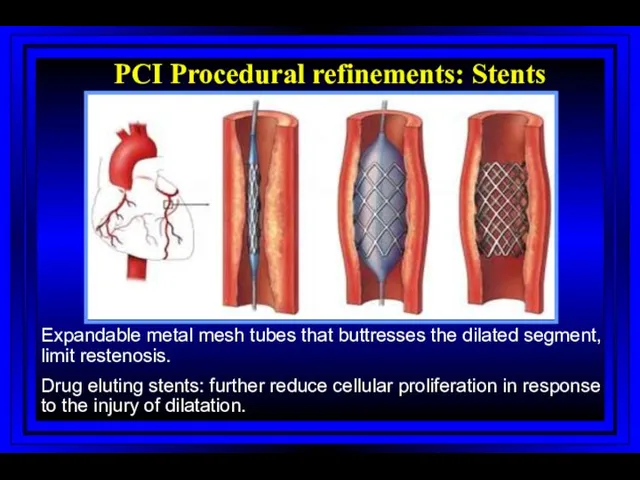
PCI Procedural refinements: Stents
Expandable metal mesh tubes that buttresses the dilated
PCI Procedural refinements: Stents
Expandable metal mesh tubes that buttresses the dilated
Treatment Strategies of CAD
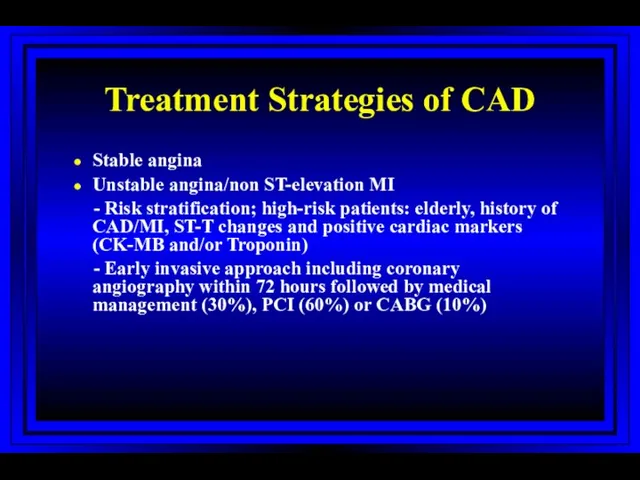
Stable angina
Unstable angina/non ST-elevation MI
- Risk stratification;
Treatment Strategies of CAD
Stable angina
Unstable angina/non ST-elevation MI
- Risk stratification;
Treatment Strategies of CAD
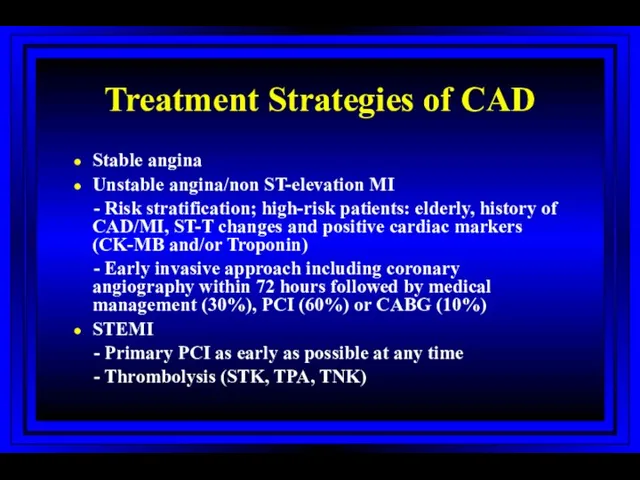
Stable angina
Unstable angina/non ST-elevation MI
- Risk stratification;
Treatment Strategies of CAD
Stable angina
Unstable angina/non ST-elevation MI
- Risk stratification;
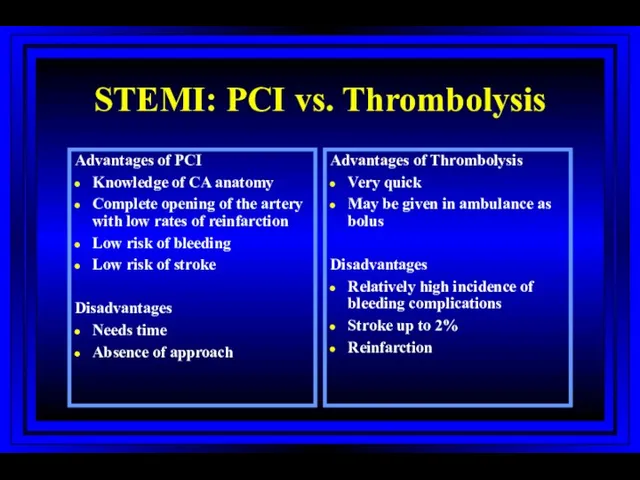
STEMI: PCI vs. Thrombolysis
Advantages of PCI
Knowledge of CA anatomy
Complete opening of
STEMI: PCI vs. Thrombolysis
Advantages of PCI
Knowledge of CA anatomy
Complete opening of
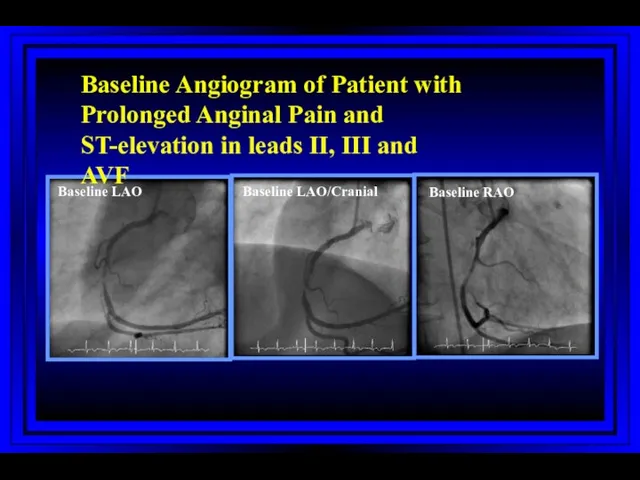
Baseline LAO
Baseline LAO/Cranial
Baseline RAO
Baseline Angiogram of Patient with Prolonged Anginal Pain
Baseline LAO
Baseline LAO/Cranial
Baseline RAO
Baseline Angiogram of Patient with Prolonged Anginal Pain
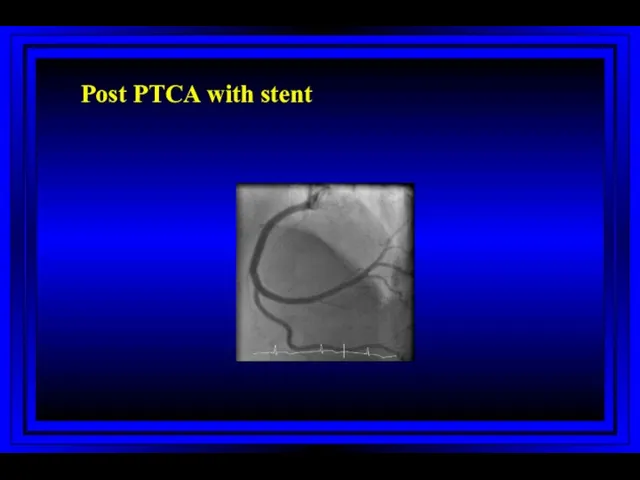
Post PTCA with stent
Post PTCA with stent
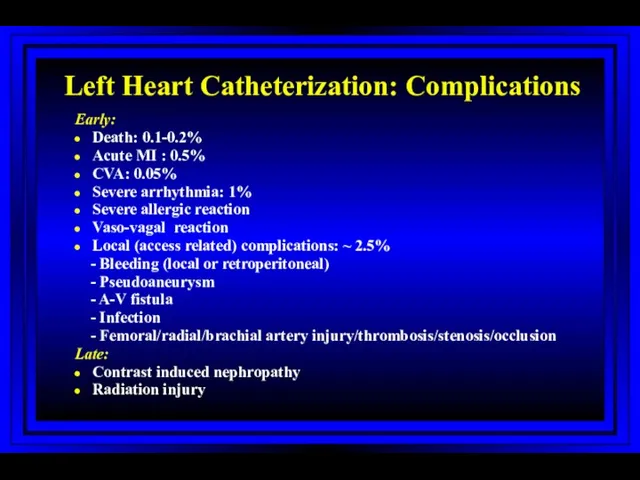
Left Heart Catheterization: Complications
Early:
Death: 0.1-0.2%
Acute MI : 0.5%
CVA: 0.05%
Severe arrhythmia: 1%
Severe
Left Heart Catheterization: Complications
Early:
Death: 0.1-0.2%
Acute MI : 0.5%
CVA: 0.05%
Severe arrhythmia: 1%
Severe
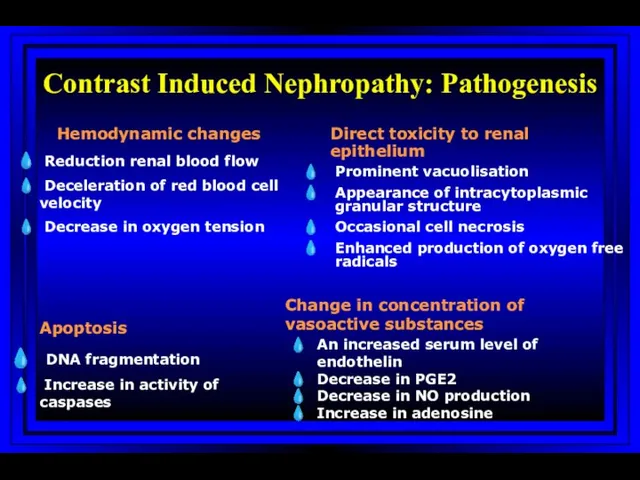
Contrast Induced Nephropathy: Pathogenesis
Hemodynamic changes
Reduction renal blood flow
Deceleration of
Contrast Induced Nephropathy: Pathogenesis
Hemodynamic changes
Reduction renal blood flow
Deceleration of
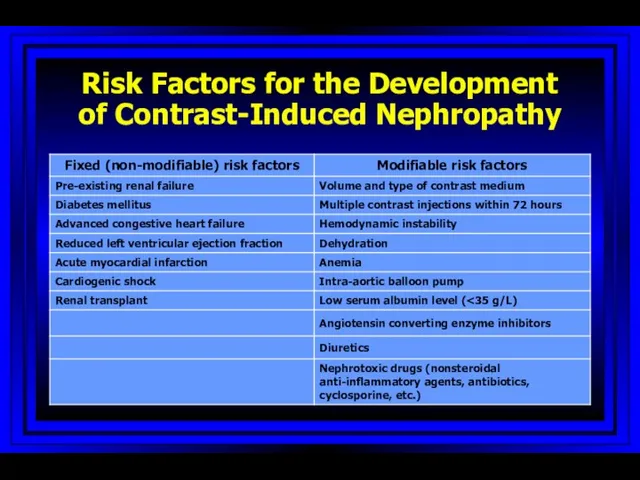
Risk Factors for the Development of Contrast-Induced Nephropathy
Risk Factors for the Development of Contrast-Induced Nephropathy
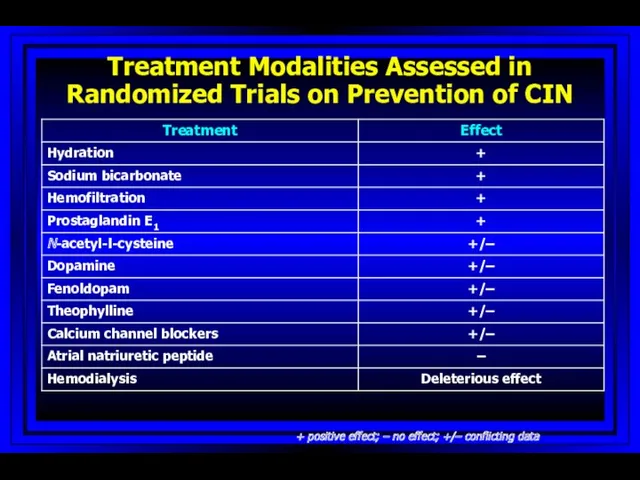
Treatment Modalities Assessed in Randomized Trials on Prevention of CIN
+
Treatment Modalities Assessed in Randomized Trials on Prevention of CIN
+
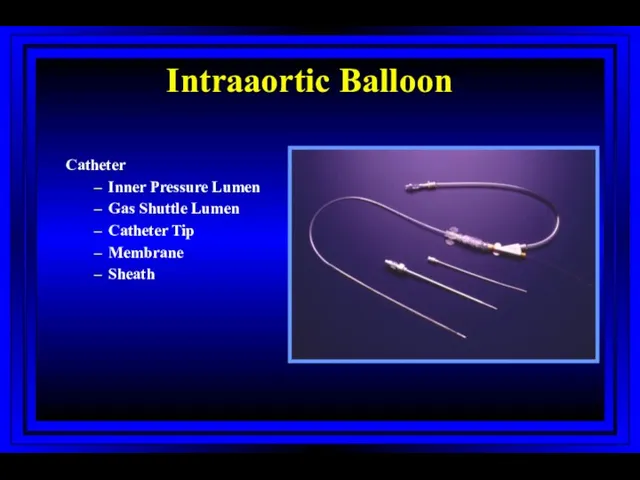
Intraaortic Balloon
Catheter
Inner Pressure Lumen
Gas Shuttle Lumen
Catheter Tip
Membrane
Sheath
Intraaortic Balloon
Catheter
Inner Pressure Lumen
Gas Shuttle Lumen
Catheter Tip
Membrane
Sheath
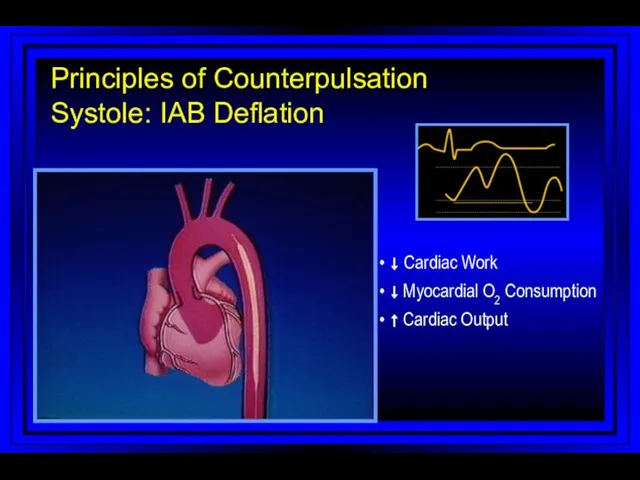
• ↓ Cardiac Work
• ↓ Myocardial O2 Consumption
• ↑ Cardiac Output
Principles
• ↓ Cardiac Work
• ↓ Myocardial O2 Consumption
• ↑ Cardiac Output
Principles
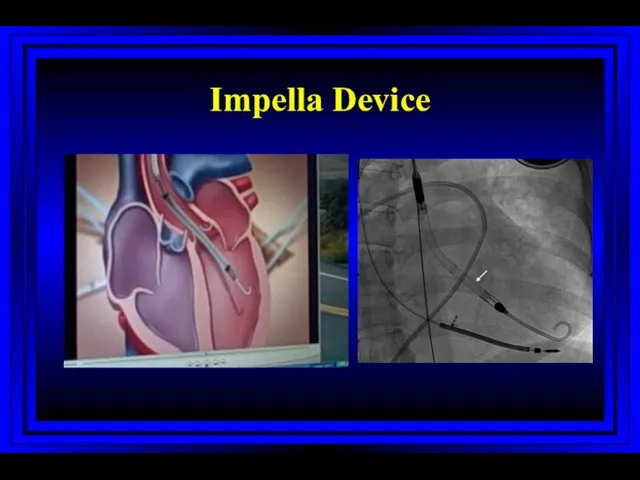
Impella Device
Impella Device
SYNERGY
1994
1995
1996
1997
1998
1999
2000
2002
2003
2004
2005
2006
2001
Bleeding risk
Ischemic risk
ACUITY
ISAR-REACT 2
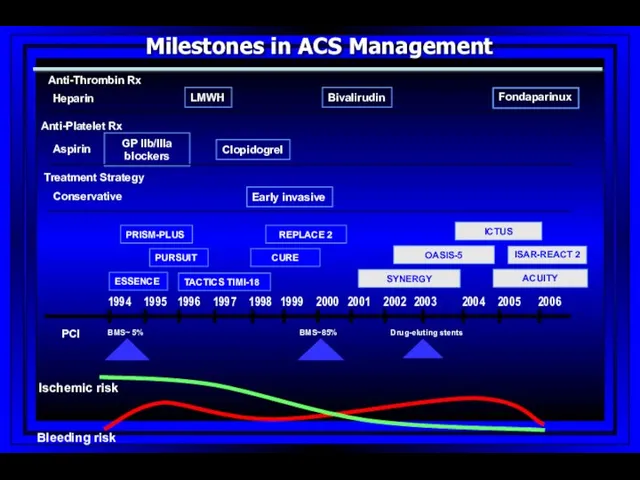
Milestones in ACS Management
Anti-Thrombin Rx
Anti-Platelet Rx
Treatment Strategy
Heparin
Aspirin
Conservative
ICTUS
SYNERGY
1994
1995
1996
1997
1998
1999
2000
2002
2003
2004
2005
2006
2001
Bleeding risk
Ischemic risk
ACUITY
ISAR-REACT 2
Milestones in ACS Management
Anti-Thrombin Rx
Anti-Platelet Rx
Treatment Strategy
Heparin
Aspirin
Conservative
ICTUS
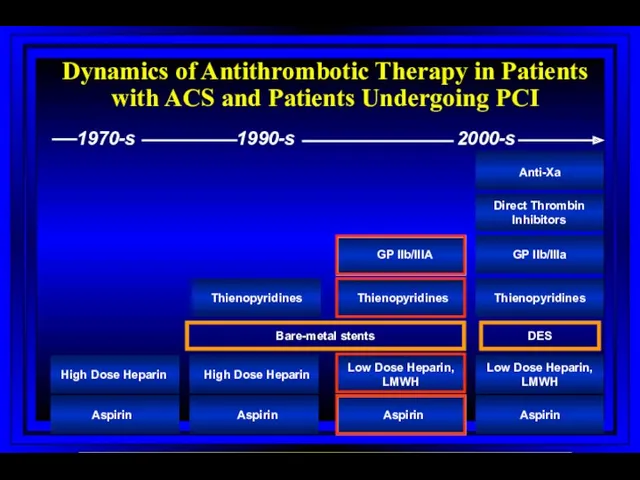
Dynamics of Antithrombotic Therapy in Patients with ACS and Patients Undergoing
Dynamics of Antithrombotic Therapy in Patients with ACS and Patients Undergoing
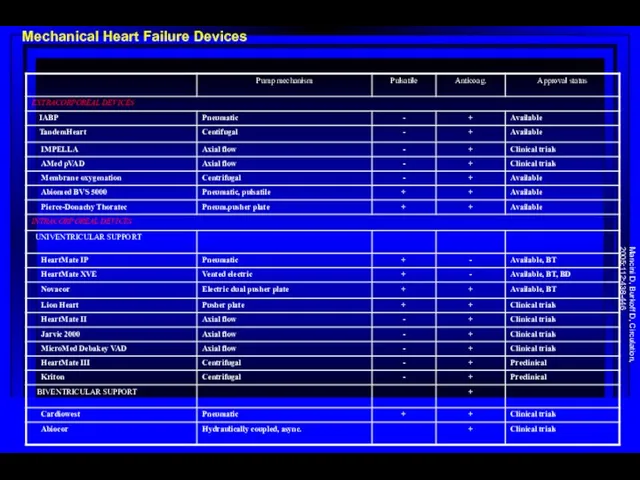
Mechanical Heart Failure Devices
Mancini D, Burkoff D, Circulation, 2005;112:438-446
Mechanical Heart Failure Devices
Mancini D, Burkoff D, Circulation, 2005;112:438-446
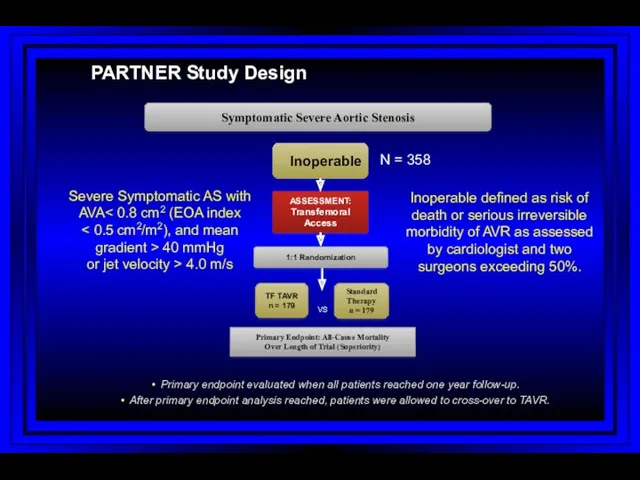
PARTNER Study Design
N = 358
Inoperable
Standard
Therapy
n = 179
ASSESSMENT: Transfemoral Access
TF TAVR
n =
PARTNER Study Design
N = 358
Inoperable
Standard
Therapy
n = 179
ASSESSMENT: Transfemoral Access
TF TAVR
n =
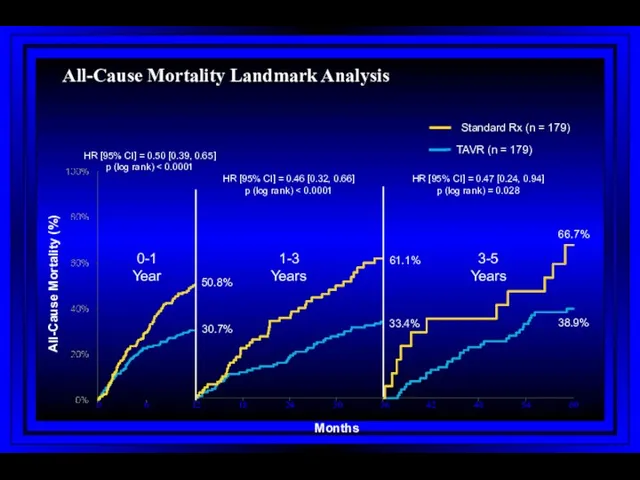
All-Cause Mortality Landmark Analysis
All-Cause Mortality Landmark Analysis
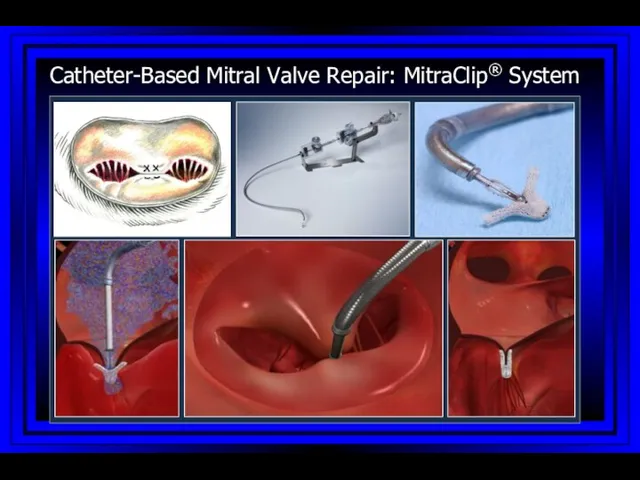
Catheter-Based Mitral Valve Repair: MitraClip® System
Catheter-Based Mitral Valve Repair: MitraClip® System
Investigational Device only in the US; Not available for sale in
Investigational Device only in the US; Not available for sale in
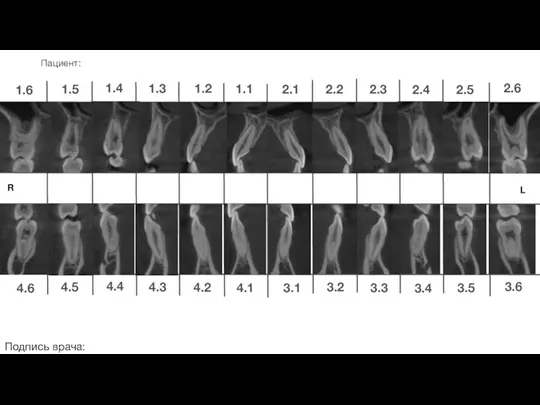 Ортодонтическое лечение. Пациент
 Клапанная болезнь сердца и беременность
 Логопедическая работа
 Острые отравления этанолом
 Сосудистые анастомозы РУС
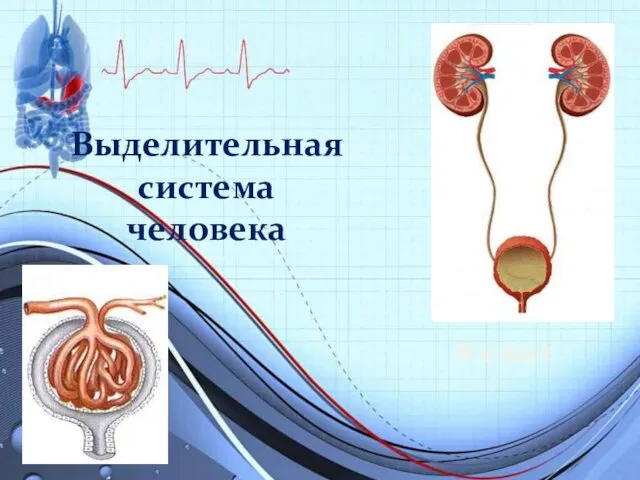 Выделительная система человека
 Организация деятельности аптечных организаций
 Дәрілік өсімдіктер
 Зрительные функции и методы их исследования
 Сахарный диабет I типа
 Рак слизистой оболочки полости рта
 О передаче медицинскими организациями электронных медицинских документов в РЭМД ЕГИСЗ
 Мысқыл (паротит)
 Сосудистый шов
 Ургентная помощь при острой сердечной и острой сосудистой недостаточности. Обморок, коллапс, шок
 Нарушения кислотно-основного состояния
 Детский хоспис Дом с маяком
 Гомеопатия
 Методы диагностики гипертрофии миокарда
 Жүктіліктің УД зерттеу әдісі
 Система непрерывного профессионального развития среднего медицинского персонала
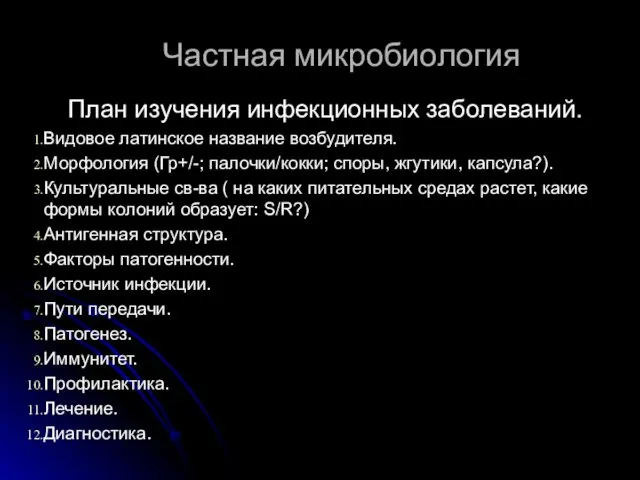 Частная микробиология
 Общие принципы микробиологической диагностики кишечной группы бактерии. Постановка этиологического диагноза
 Витаминные добавки в парфюмерно-косметической промышленности
 Балалардың жақ-бет аймағындағы деформациялар мен ақауларды емдеудің негізгі әдістері
 Бүйрек, несепағар жарақаты
 Клинико-фармакологическая характеристика лекарств, влияющих на моторно-секреторную функцию желудочно-кишечного тракта
 Всесвітній день боротьби зі СНІДом