- Project Management Tools - Planning & Scheduling Tools (P2). GANTT Charts

Содержание
- 2. Learning Outcomes Know the difference between Planning and Scheduling Know the different project management tools available
- 3. Planning Planning is the process by which the elements required to perform a task are determined
- 4. Planning Process Involves Determining the project Develop a project plan. This entails the sequence of the
- 5. Levels of Planning Long-range planning: it covers a period of 3 to 5 years and sets
- 6. Scheduling Is the process by which tasks are matched with resources and sequenced to be executed
- 7. Scheduling Scheduling deals with the specific time and phasing of planned tasks together with the orders
- 8. Reliable Schedule Must Take Into Consideration A task priority ranking reflecting the criticality of each task
- 9. Scheduling The objective of scheduling is to construct a time chart showing: The start and finish
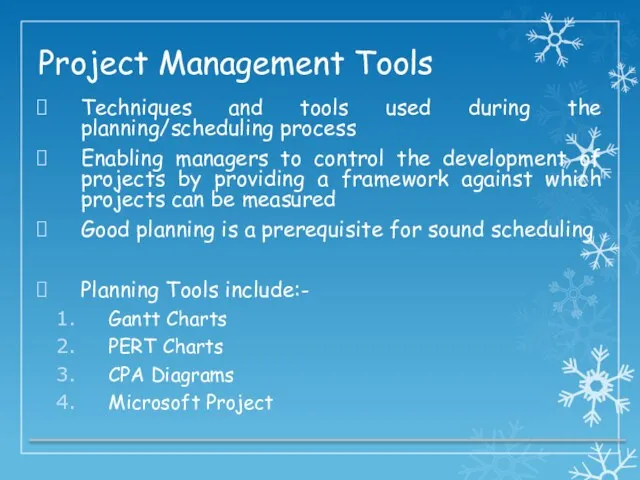
- 10. Project Management Tools Techniques and tools used during the planning/scheduling process Enabling managers to control the
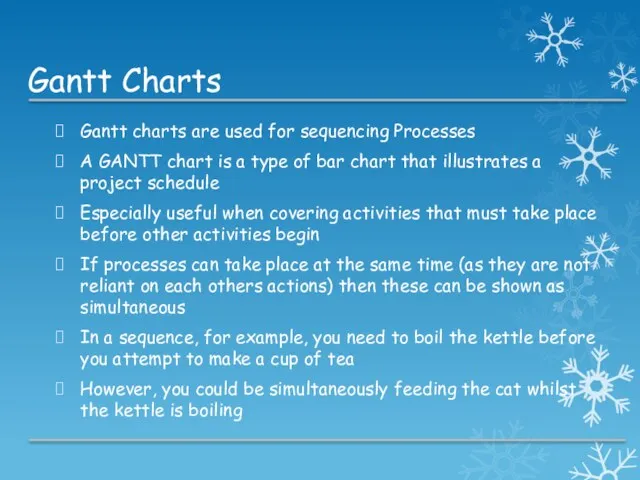
- 11. Gantt Charts Gantt charts are used for sequencing Processes A GANTT chart is a type of
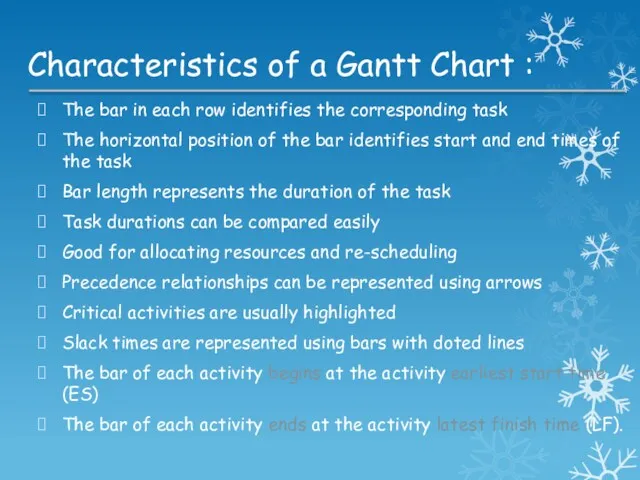
- 12. Characteristics of a Gantt Chart : The bar in each row identifies the corresponding task The
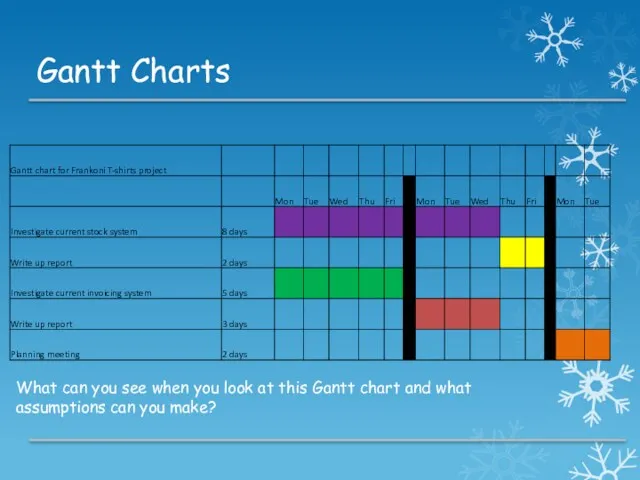
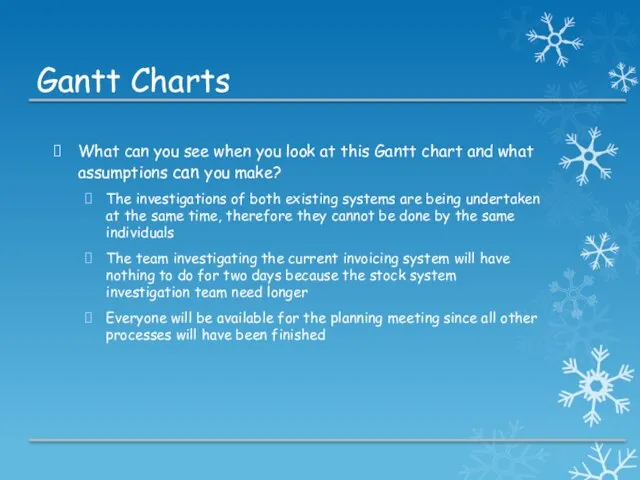
- 13. Gantt Charts What can you see when you look at this Gantt chart and what assumptions
- 14. Gantt Charts What can you see when you look at this Gantt chart and what assumptions
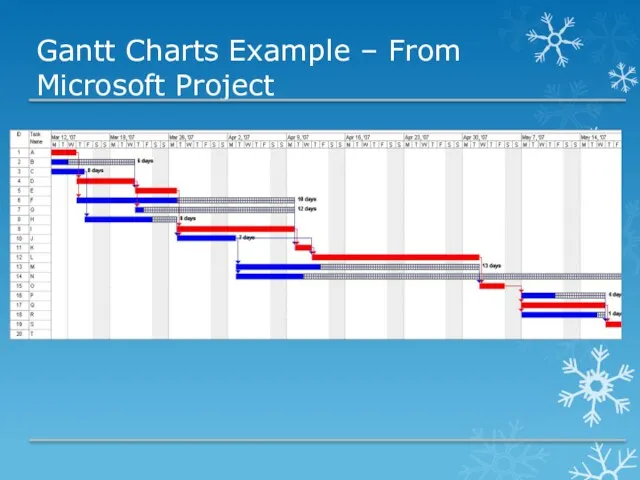
- 15. Gantt Charts Example – From Microsoft Project
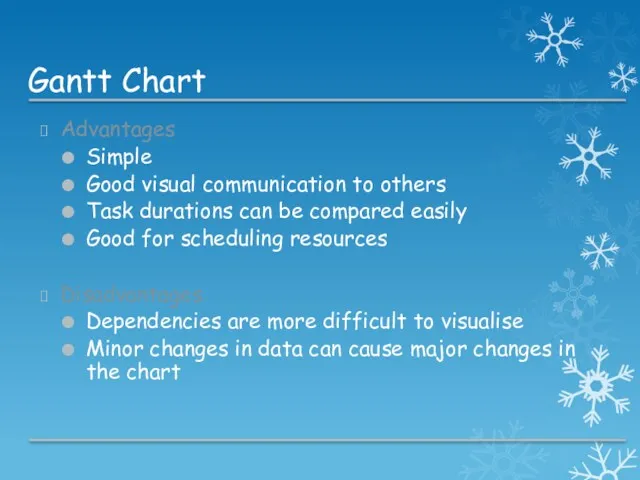
- 16. Gantt Chart Advantages Simple Good visual communication to others Task durations can be compared easily Good
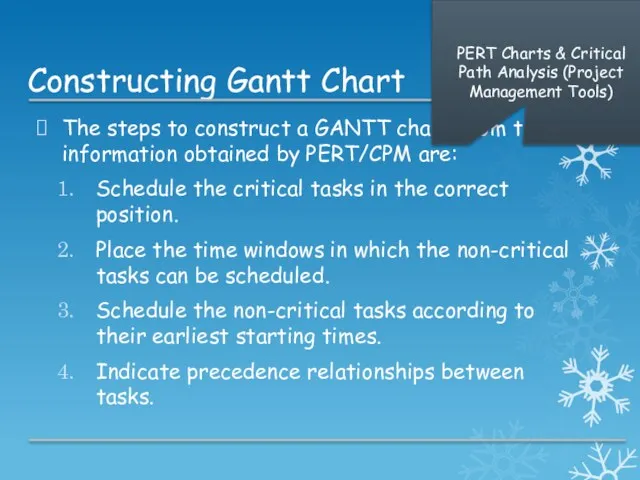
- 17. Constructing Gantt Chart The steps to construct a GANTT chart from the information obtained by PERT/CPM
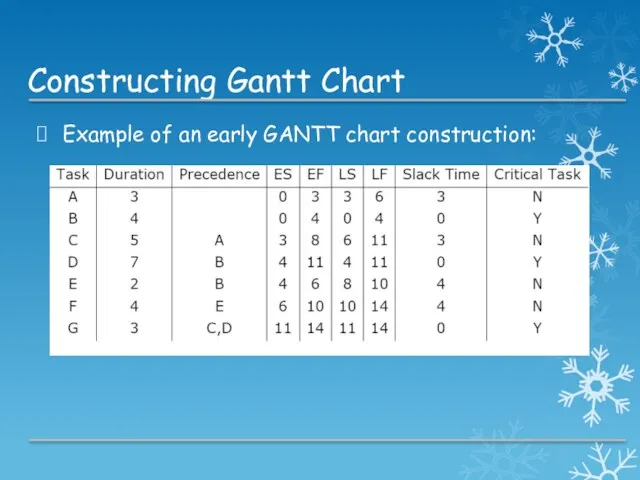
- 18. Constructing Gantt Chart Example of an early GANTT chart construction:
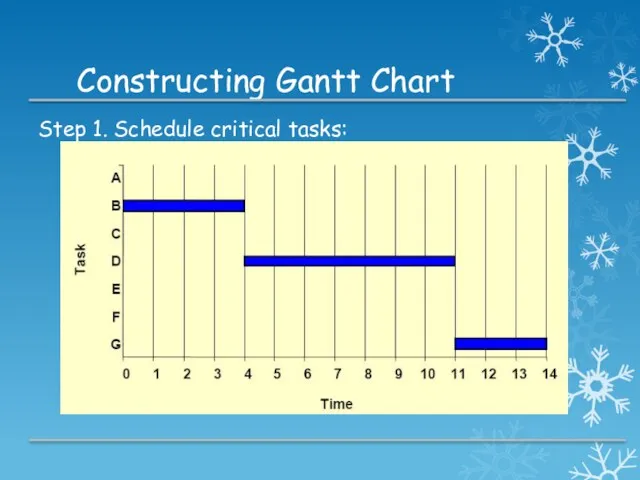
- 19. Constructing Gantt Chart Step 1. Schedule critical tasks:
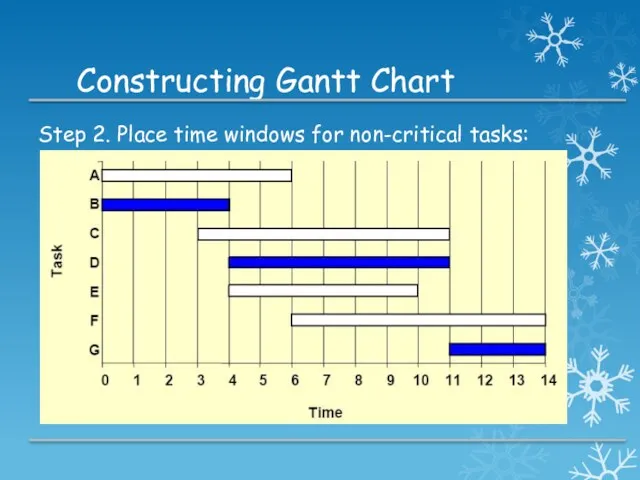
- 20. Constructing Gantt Chart Step 2. Place time windows for non-critical tasks:
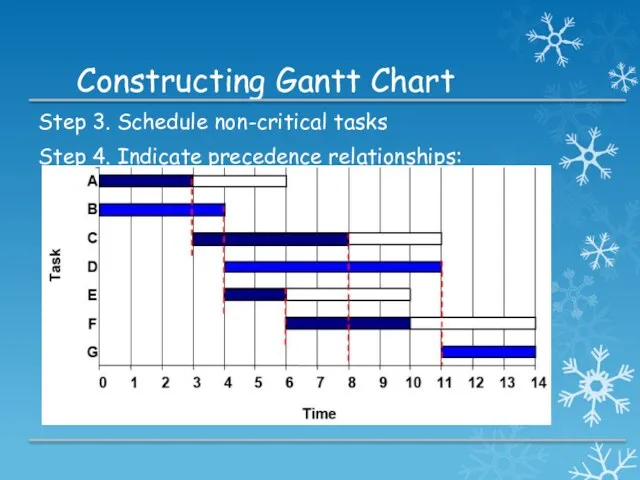
- 21. Constructing Gantt Chart Step 3. Schedule non-critical tasks Step 4. Indicate precedence relationships:
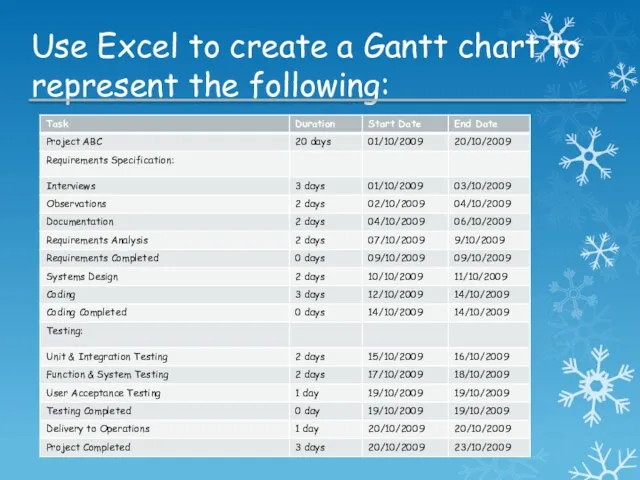
- 22. Use Excel to create a Gantt chart to represent the following:
- 24. Скачать презентацию
Learning Outcomes
Know the difference between Planning and Scheduling
Know the different project management
Learning Outcomes
Know the difference between Planning and Scheduling
Know the different project management
Planning
Planning is the process by which the elements required to perform a
Planning
Planning is the process by which the elements required to perform a
Planning Process Involves
Determining the project
Develop a project plan. This entails the sequence
Planning Process Involves
Determining the project
Develop a project plan. This entails the sequence
Levels of Planning
Long-range planning: it covers a period of 3 to 5 years
Levels of Planning
Long-range planning: it covers a period of 3 to 5 years
Scheduling
Is the process by which tasks are matched with resources and sequenced
Scheduling
Is the process by which tasks are matched with resources and sequenced
Scheduling
Scheduling deals with the specific time and phasing of planned tasks together
Scheduling
Scheduling deals with the specific time and phasing of planned tasks together
Reliable Schedule Must Take Into Consideration
A task priority ranking reflecting the criticality
Reliable Schedule Must Take Into Consideration
A task priority ranking reflecting the criticality
Scheduling
The objective of scheduling is to construct a time chart showing:
The start
Scheduling
The objective of scheduling is to construct a time chart showing:
The start
Project Management Tools
Techniques and tools used during the planning/scheduling process
Enabling managers to
Project Management Tools
Techniques and tools used during the planning/scheduling process
Enabling managers to
Gantt Charts
Gantt charts are used for sequencing Processes
A GANTT chart is a type
Gantt Charts
Gantt charts are used for sequencing Processes
A GANTT chart is a type
Characteristics of a Gantt Chart :
The bar in each row identifies the corresponding
Characteristics of a Gantt Chart :
The bar in each row identifies the corresponding
Gantt Charts
What can you see when you look at this Gantt chart and
Gantt Charts
What can you see when you look at this Gantt chart and
Gantt Charts
What can you see when you look at this Gantt chart and
Gantt Charts
What can you see when you look at this Gantt chart and
Gantt Charts Example – From Microsoft Project
Gantt Charts Example – From Microsoft Project
Gantt Chart
Advantages
Simple
Good visual communication to others
Task durations can be compared easily
Good for scheduling
Gantt Chart
Advantages
Simple
Good visual communication to others
Task durations can be compared easily
Good for scheduling
Constructing Gantt Chart
The steps to construct a GANTT chart from the information obtained
Constructing Gantt Chart
The steps to construct a GANTT chart from the information obtained
Constructing Gantt Chart
Example of an early GANTT chart construction:
Constructing Gantt Chart
Example of an early GANTT chart construction:
Constructing Gantt Chart
Step 1. Schedule critical tasks:
Constructing Gantt Chart
Step 1. Schedule critical tasks:
Constructing Gantt Chart
Step 2. Place time windows for non-critical tasks:
Constructing Gantt Chart
Step 2. Place time windows for non-critical tasks:
Constructing Gantt Chart
Step 3. Schedule non-critical tasks
Step 4. Indicate precedence relationships:
Constructing Gantt Chart
Step 3. Schedule non-critical tasks
Step 4. Indicate precedence relationships:
Use Excel to create a Gantt chart to represent the following:
Use Excel to create a Gantt chart to represent the following:
 Gazprom
 Управление технологическими проектами
 Мотивация и стимулирование персонала
 Операционная логистическая деятельность организации
 Внешняя и внутренняя среда организации
 Методы совершенствования системы мотивации труда на авиапредприятии
 Производственная инфраструктура предприятия
 Набор и отбор персонала
 Стратегии масштабирования бизнеса
 Виды корпораций, их классификация. Модели управления акционерными обществами развитых рынков капитала
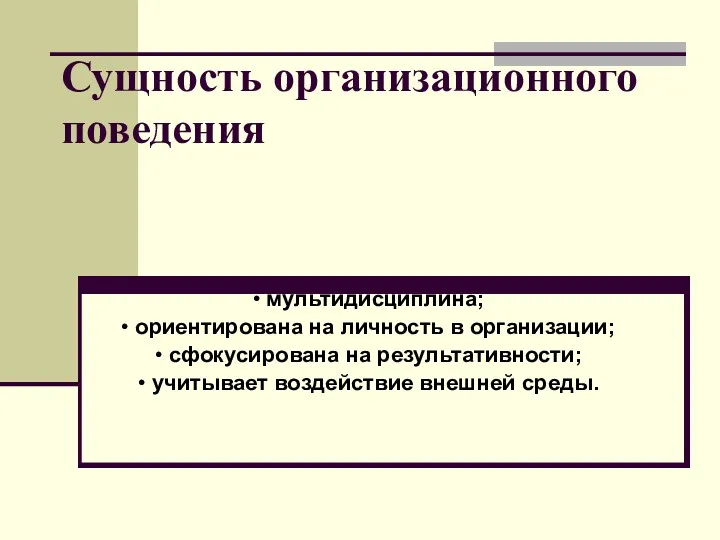 Сущность организационного поведения
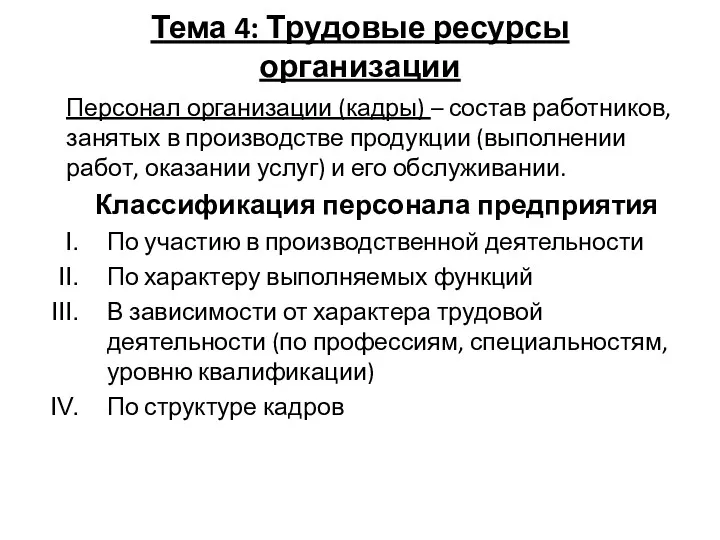 Трудовые ресурсы организации
 Організаційний механізм управління корпораціями в туристичному бізнесі
 1С:ERP. Управление предприятием 2.0
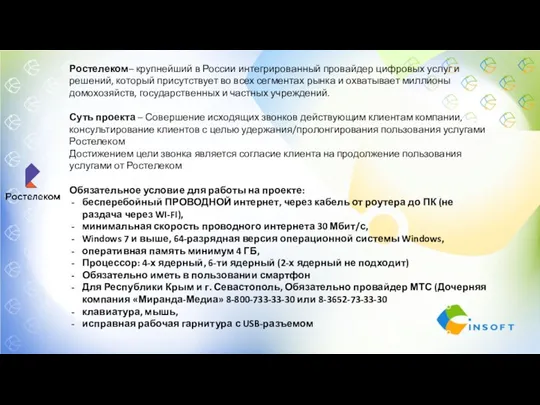 Ростелеком. Трудоустройство
 Руководство и лидерство
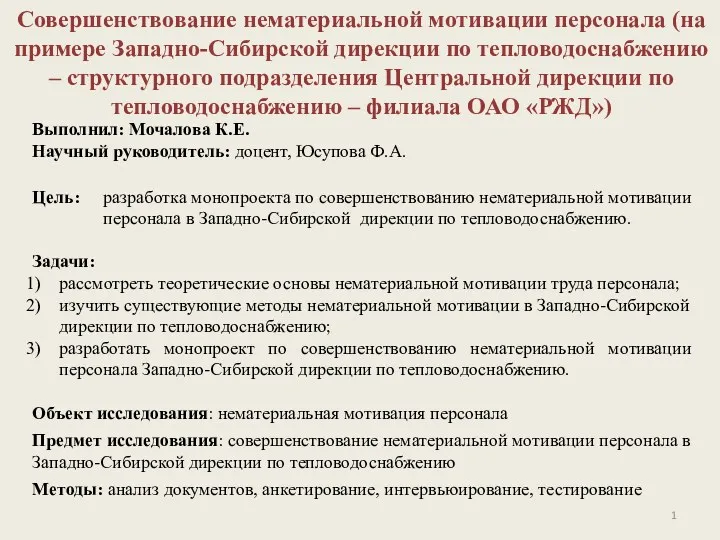 Совершенствование нематериальной мотивации персонала (на примере Западно-Сибирской дирекции по тепловодоснабжению
 Анализ и оценка корпоративных рисков
 Влияние управленческих воздействий на рост маржинальности АО
 Внутренний аудит системы менеджмента в испытательной лаборатории в соответствии с ГОСТ ISO/IEC 17025-2019, ГОСТ Р ИСО 19011
 Как нанимать и удерживать лучших сотрудников, когда рынок для найма сокращается
 Conceptul de decizie managerială. Definirea şi structura sistemului decizional. Metode şi tehnici decizionale
 Понятие и причины текучести кадров. Расчет коэффициента текучести
 Контроллинг в системе управления
 Метод PERT и управление проектами
 Кодекс деловой этики
 Научные школы управления персоналом
 Кодекс поведения государственных служащих. Игра