- Review. Data Classification

Содержание
- 2. Unit 1-2 Data Classification
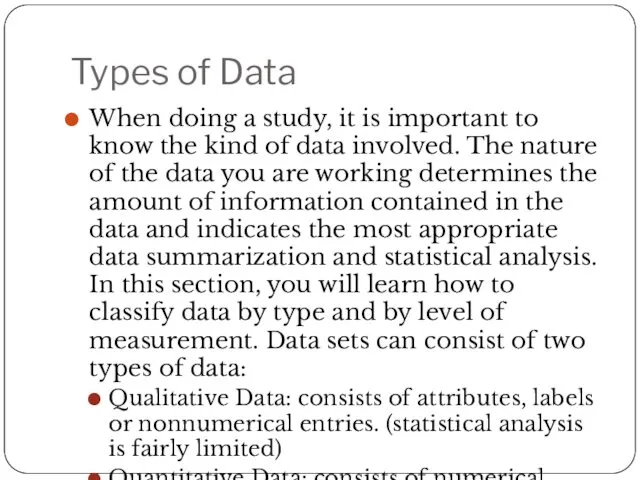
- 3. Types of Data When doing a study, it is important to know the kind of data
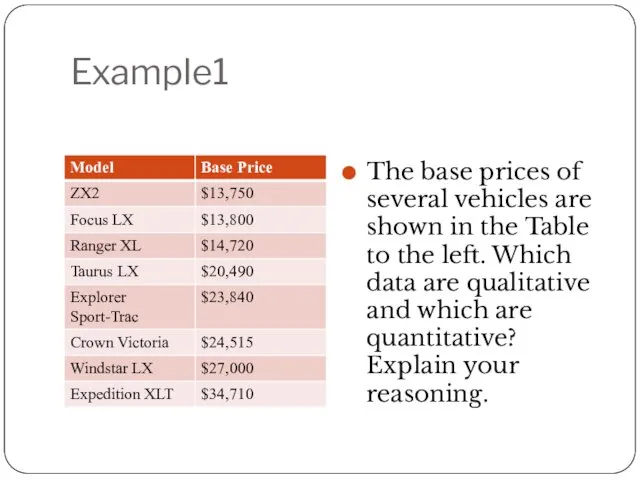
- 4. Example1 The base prices of several vehicles are shown in the Table to the left. Which
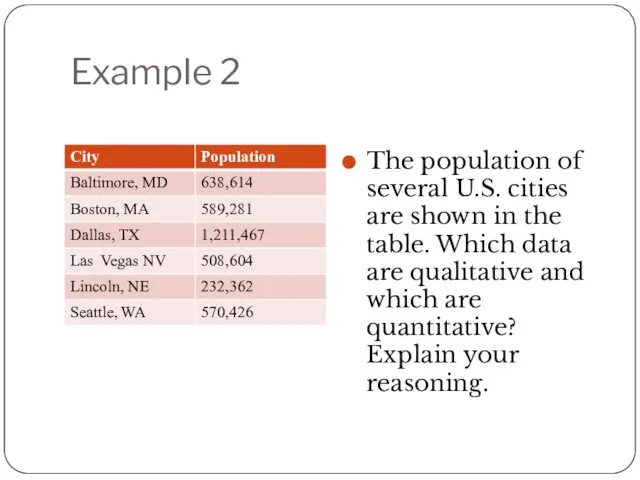
- 5. Example 2 The population of several U.S. cities are shown in the table. Which data are
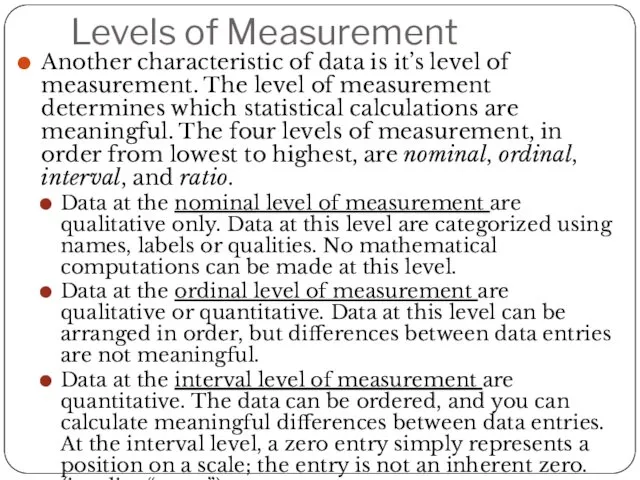
- 6. Levels of Measurement Another characteristic of data is it’s level of measurement. The level of measurement
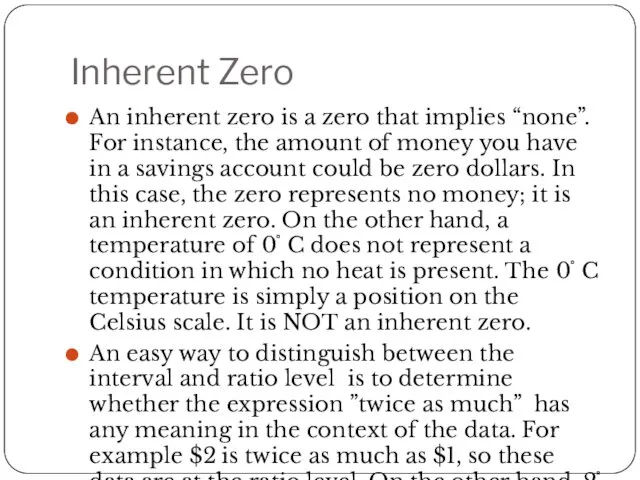
- 7. Inherent Zero An inherent zero is a zero that implies “none”. For instance, the amount of
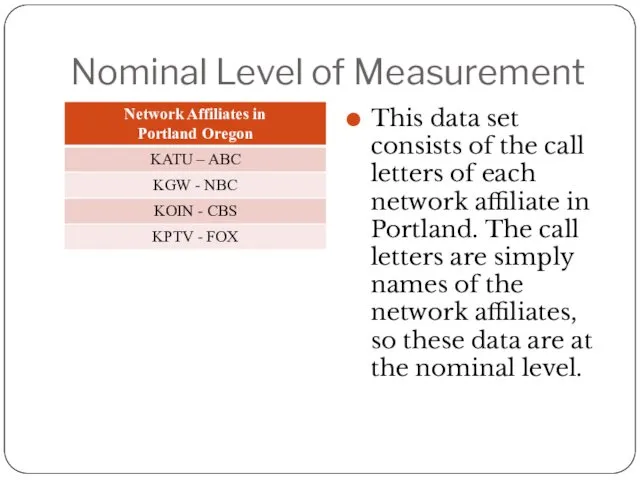
- 8. Nominal Level of Measurement This data set consists of the call letters of each network affiliate
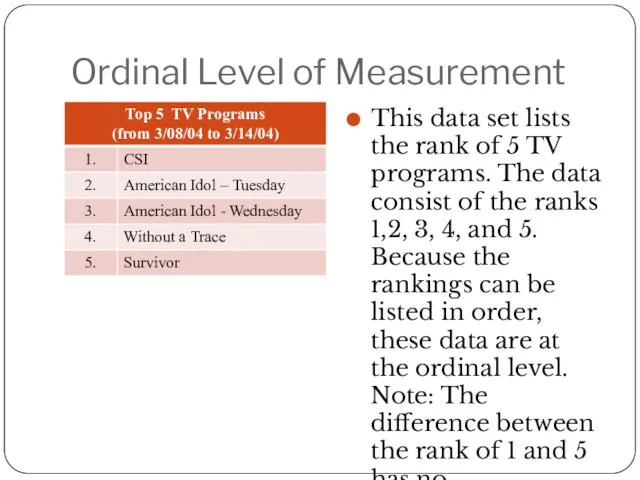
- 9. Ordinal Level of Measurement This data set lists the rank of 5 TV programs. The data
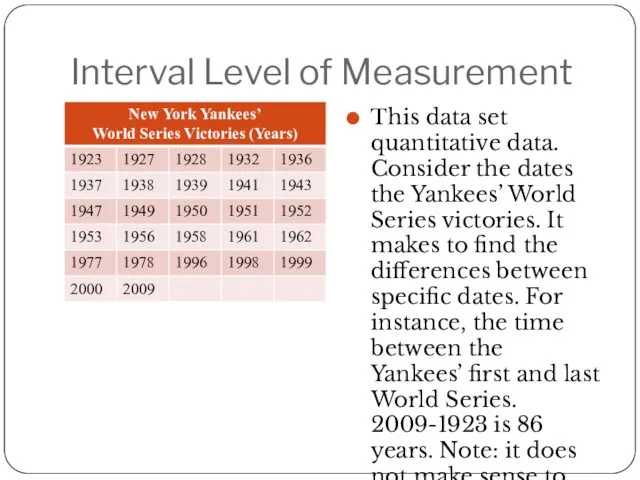
- 10. Interval Level of Measurement This data set quantitative data. Consider the dates the Yankees’ World Series
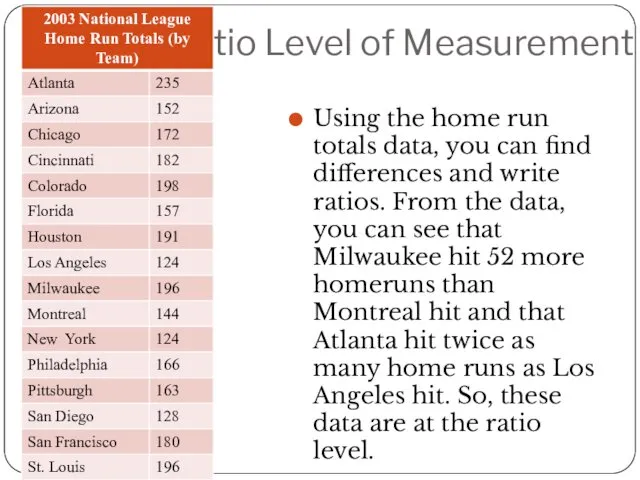
- 11. Ratio Level of Measurement Using the home run totals data, you can find differences and write
- 12. Summarization
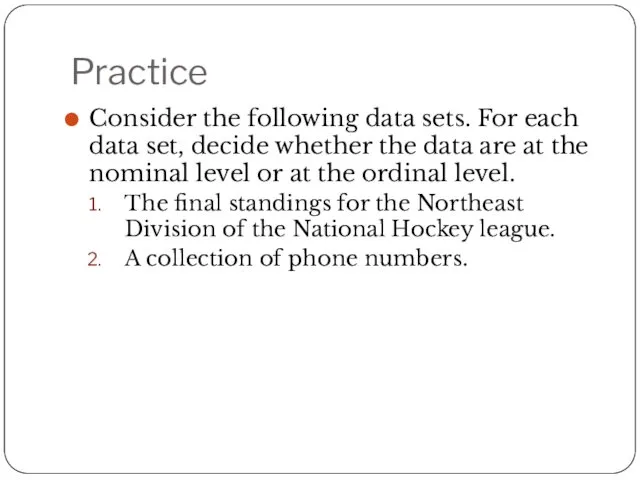
- 13. Practice Consider the following data sets. For each data set, decide whether the data are at
- 14. Practice Consider the following data sets. For each data set, decide whether the data are at
- 16. Скачать презентацию
Unit 1-2
Data Classification
Unit 1-2
Data Classification
Types of Data
When doing a study, it is important to know
Types of Data
When doing a study, it is important to know
Example1
The base prices of several vehicles are shown in the Table
Example1
The base prices of several vehicles are shown in the Table
Example 2
The population of several U.S. cities are shown in the
Example 2
The population of several U.S. cities are shown in the
Levels of Measurement
Another characteristic of data is it’s level of measurement.
Levels of Measurement
Another characteristic of data is it’s level of measurement.
Inherent Zero
An inherent zero is a zero that implies “none”. For
Inherent Zero
An inherent zero is a zero that implies “none”. For
Nominal Level of Measurement
This data set consists of the call letters
Nominal Level of Measurement
This data set consists of the call letters
Ordinal Level of Measurement
This data set lists the rank of 5
Ordinal Level of Measurement
This data set lists the rank of 5
Interval Level of Measurement
This data set quantitative data. Consider the dates
Interval Level of Measurement
This data set quantitative data. Consider the dates
Ratio Level of Measurement
Using the home run totals data, you can
Ratio Level of Measurement
Using the home run totals data, you can
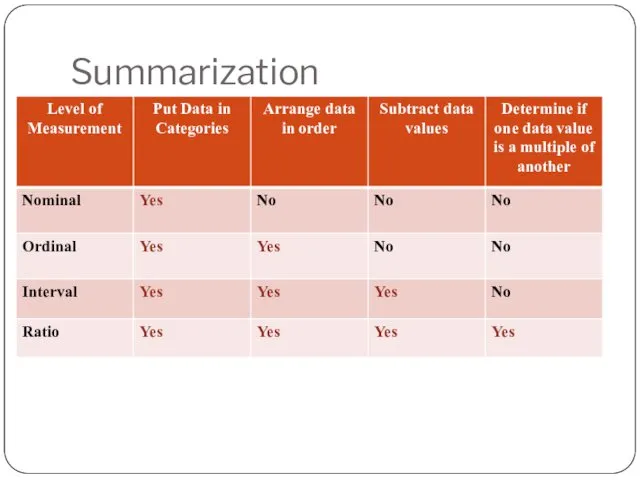
Summarization
Summarization
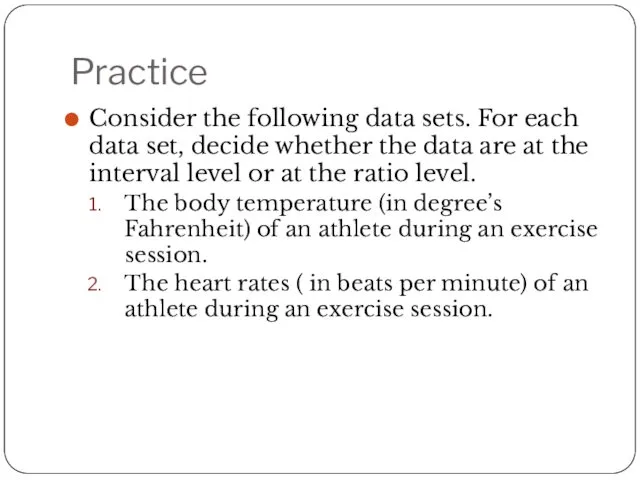
Practice
Consider the following data sets. For each data set, decide whether
Practice
Consider the following data sets. For each data set, decide whether
Practice
Consider the following data sets. For each data set, decide whether
Practice
Consider the following data sets. For each data set, decide whether
 Заңды білу – заман талабы
 Опрос, как метод социального исследования
 Деятельность волонтерского движения МЧС России в Республике Башкортостан. Для открытого урока
 Державна служба зайнятості
 Введение в волонтёрскую деятельность
 Соціально-політичні небезпеки
 Социальный контроль и девиантное поведение
 Доброе дело. Акция Аллея славы
 Этнос и этничность
 Манипулирование. Причины
 Политические партии. Обществознание, 9 класс
 Социальное проектирование
 Лебяжьевский районный клуб молодых семей Подкова
 Организация и проведение социологического исследования к Международной конференции Цифровая культура открытых городов
 Школа Активного Гражданина
 Урок повторения по теме Семья
 Модернизация общества и разрушение семьи
 Направление Развитие международного и межрегионального молодёжного сотрудничества
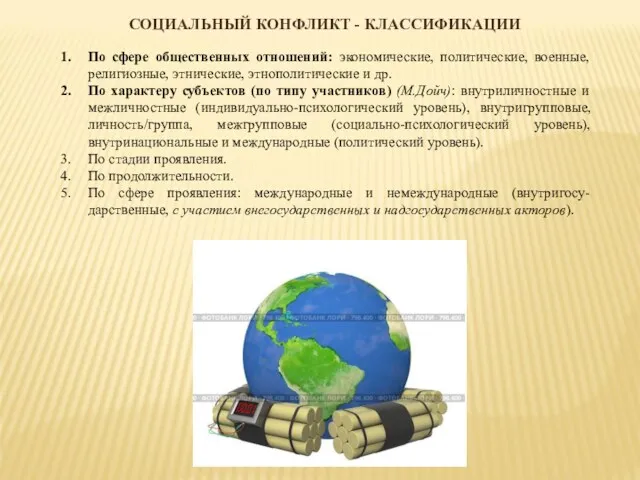 Социальный конфликт - классификации
 Урок в 6 классе Что значит быть патриотом
 День пожилого человека
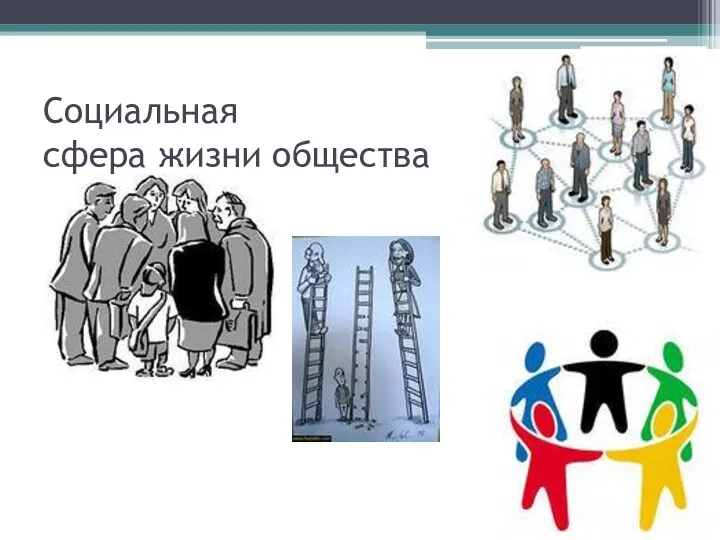 Социальная сфера жизни общества
 Событийное волонтерство: городской волонтер Проект: Молодёжь VGORODE
 Отряд РДШ МАОУ СОШ № 5 города Ишима
 Семья. Семейное древо
 Причины ограничения потребления пищи. Причины отказа от различных видов пищи
 презентация к парламентскому уроку Путешествие Ивана-царевича в Россию
 Культура, как фактор социальных изменений