- Decision environment

Содержание
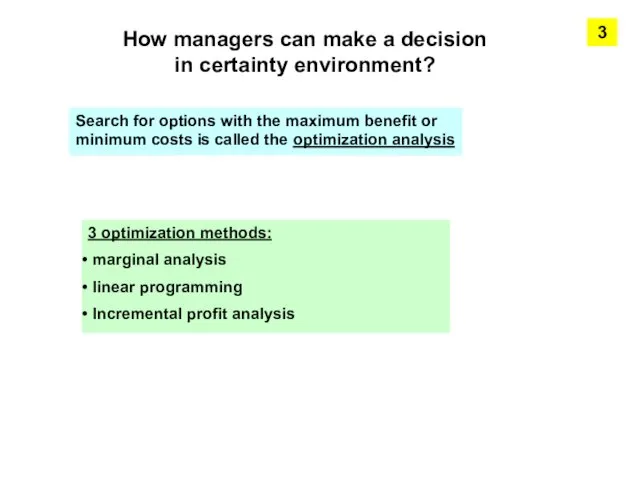
- 2. 3 How managers can make a decision in certainty environment? Search for options with the maximum
- 3. 4 How managers can make a decision in risk – and uncertainty environment?
- 4. Unlike short-term decisions, long-term decisions are made under risk and uncertainty I don't know what events
- 5. Solutions matrix I wonder, what is it? Payment matrix In conditions of risk and uncertainty typical
- 6. This tool: Formalizes the process of decision-making Provides a summary of return for different purposes and
- 7. Decision-making in terms of risk
- 8. Methods of risk evaluation: (Risk – probability of undesired occurense) 9
- 9. 2 approach to objective measurement of probability (degree of risk) A priori (deductive method) Aposteriori (statistical
- 10. A priori (deductive method) No experiment and analysis of past experience characteristics of possible cases are
- 11. Aposteriori (statistical analysis of empirical data) past experience will continue in the future Watch the frequency
- 12. Frequency distribution can be converted into a probability distribution 13 If a certain load factor appeared
- 13. Determine and minimize the risks inherent to a particular project One of the methods: the calculation
- 14. Expected value - Value of i outcome - Probability of i outcome The expected value of
- 15. Manager choose strategy with the highest expected value 16
- 16. Expected value E(S) 5,90 9,50 17,65 15,00 15,10 Optimum strategy 17
- 17. Suppose that expected value of alternatives strategies are equal How can we choose between S1 and
- 18. New criteria – degree of risk May be determined as deviation scope of probable outcome from
- 19. By intuition we feel that the further away from the average value will be the actual
- 20. swing (amplitude) - the difference between the extreme values of probable outcomes Swing for S1 –
- 21. root-mean-square deviation The higher root-mean-square deviation - the higher risk 22
- 22. Calculation of the root-mean-square deviation: 23
- 24. Скачать презентацию
3
How managers can make a decision in certainty environment?
Search for options
3
How managers can make a decision in certainty environment?
Search for options
4
How managers can make a decision in risk – and uncertainty
4
How managers can make a decision in risk – and uncertainty
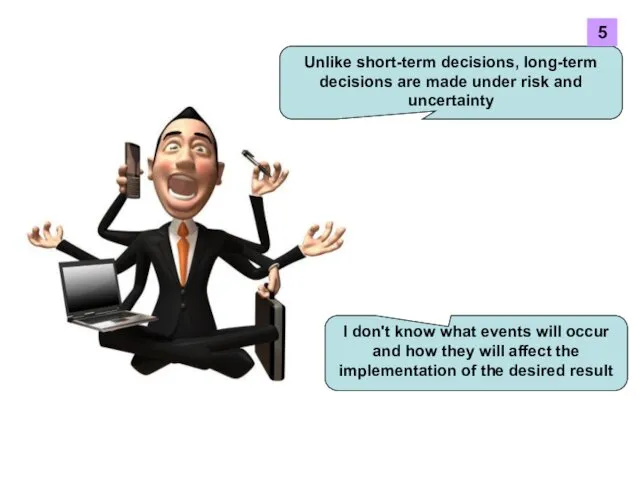
Unlike short-term decisions, long-term decisions are made under risk and uncertainty
I
Unlike short-term decisions, long-term decisions are made under risk and uncertainty
I
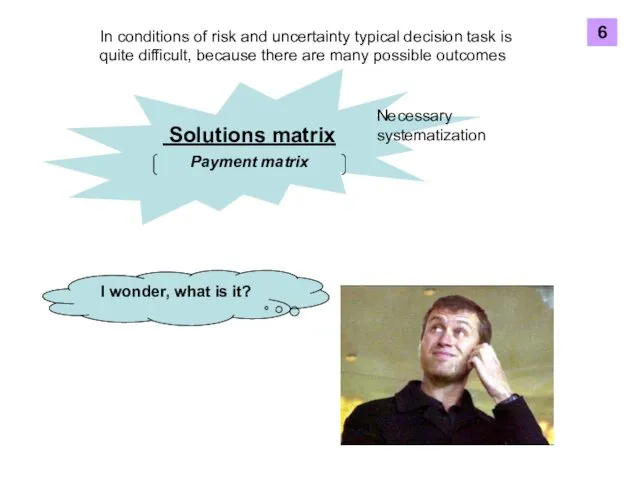
Solutions matrix
I wonder, what is it?
Payment matrix
In conditions of risk
Solutions matrix
I wonder, what is it?
Payment matrix
In conditions of risk
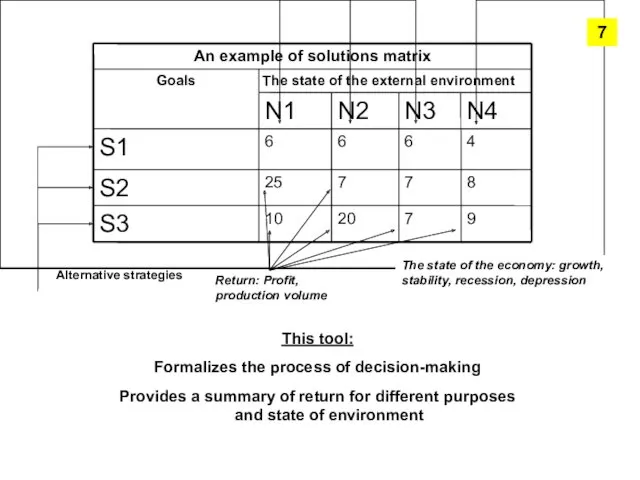
This tool:
Formalizes the process of decision-making
Provides a summary of return for
This tool:
Formalizes the process of decision-making
Provides a summary of return for

Decision-making in terms of risk
Decision-making in terms of risk
Methods of risk evaluation:
(Risk – probability of undesired occurense)
9
Methods of risk evaluation:
(Risk – probability of undesired occurense)
9
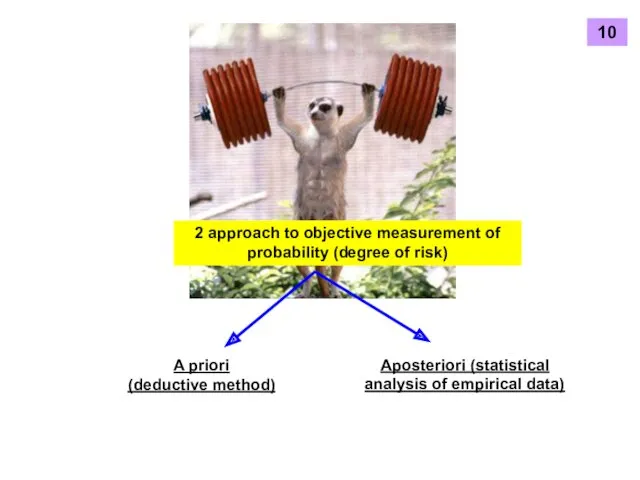
2 approach to objective measurement of probability (degree of risk)
A priori
2 approach to objective measurement of probability (degree of risk)
A priori
A priori
(deductive method)
No experiment and analysis of past experience
characteristics
A priori
(deductive method)
No experiment and analysis of past experience
characteristics
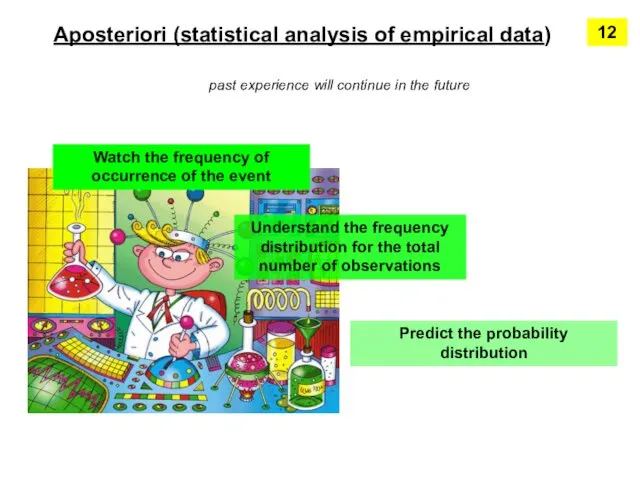
Aposteriori (statistical analysis of empirical data)
past experience will continue in the
Aposteriori (statistical analysis of empirical data)
past experience will continue in the
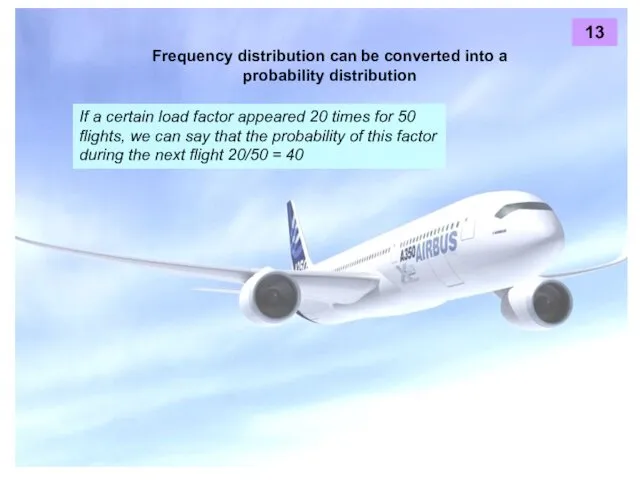
Frequency distribution can be converted into a probability distribution
13
If a certain
Frequency distribution can be converted into a probability distribution
13
If a certain
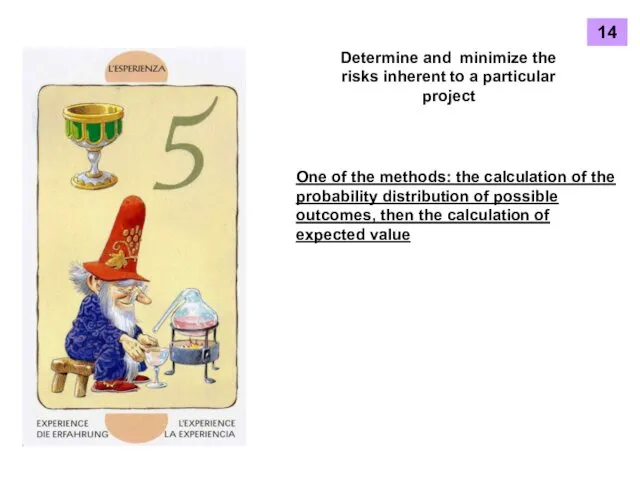
Determine and minimize the risks inherent to a particular project
One of
Determine and minimize the risks inherent to a particular project
One of
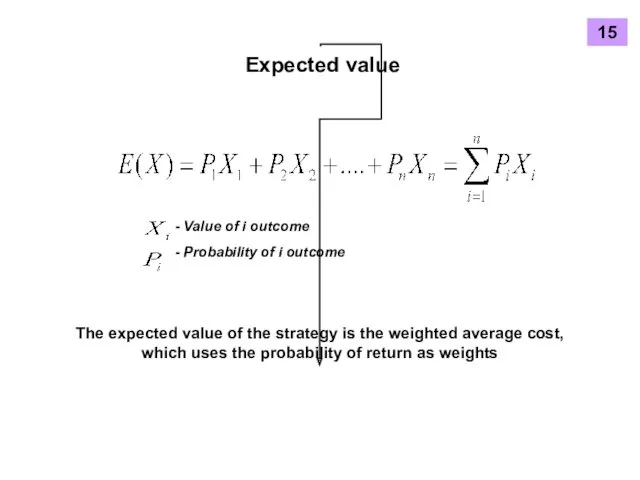
Expected value
- Value of i outcome
- Probability of i outcome
The expected
Expected value
- Value of i outcome
- Probability of i outcome
The expected
Manager choose strategy with the highest expected value
16
Manager choose strategy with the highest expected value
16
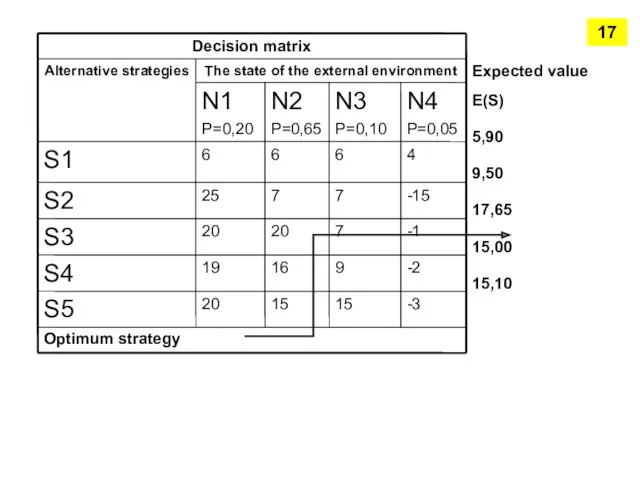
Expected value
E(S)
5,90
9,50
17,65
15,00
15,10
Optimum strategy
17
Expected value
E(S)
5,90
9,50
17,65
15,00
15,10
Optimum strategy
17
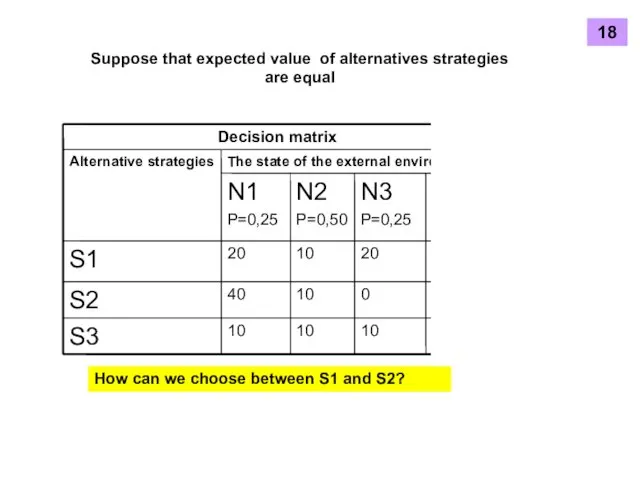
Suppose that expected value of alternatives strategies are equal
How can we
Suppose that expected value of alternatives strategies are equal
How can we
New criteria – degree of risk
May be determined as deviation scope
New criteria – degree of risk
May be determined as deviation scope
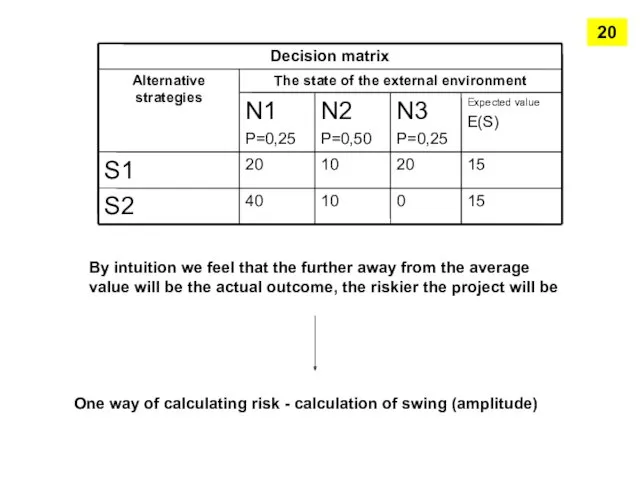
By intuition we feel that the further away from the average
By intuition we feel that the further away from the average
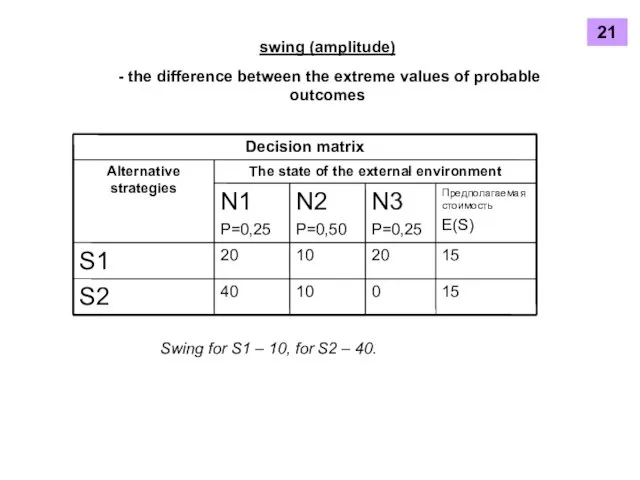
swing (amplitude)
- the difference between the extreme values of probable
swing (amplitude)
- the difference between the extreme values of probable
root-mean-square deviation
The higher root-mean-square deviation - the higher risk
22
root-mean-square deviation
The higher root-mean-square deviation - the higher risk
22
Calculation of the root-mean-square deviation:
23
Calculation of the root-mean-square deviation:
23
 Готовность ребёнка к школе
 презентация к семинару для педагогов
 Пути выхода из конфликтных ситуаций
 Психолого-педагогическое сопровождение адаптации учащихся 10-х классов к новой ситуации обучения
 Психічне старіння
 Психологічні особливості педагогічного спілкування. (Лекція 7)
 Технология развития критического мышления
 Индивидуально-психологические особенности руководителя
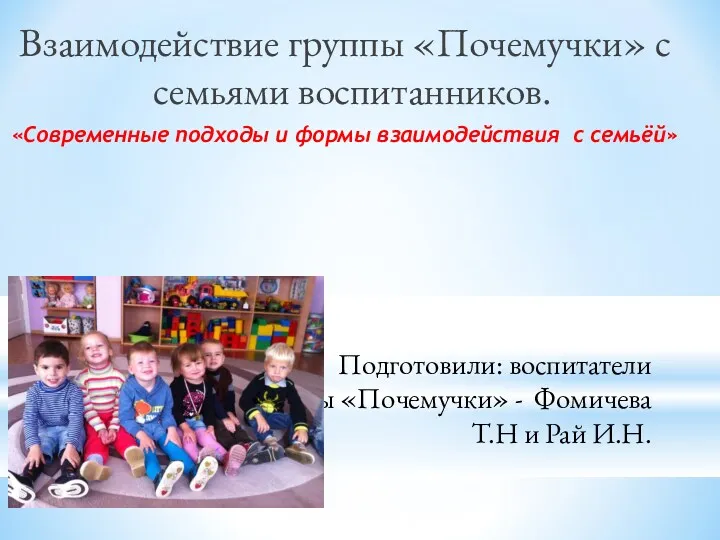 Взаимодействие группы Почемучки с семьями воспитанников. Современные подходы и формы взаимодействия с семьёй
 Девиантное поведение подростков
 Вчимося жити разом
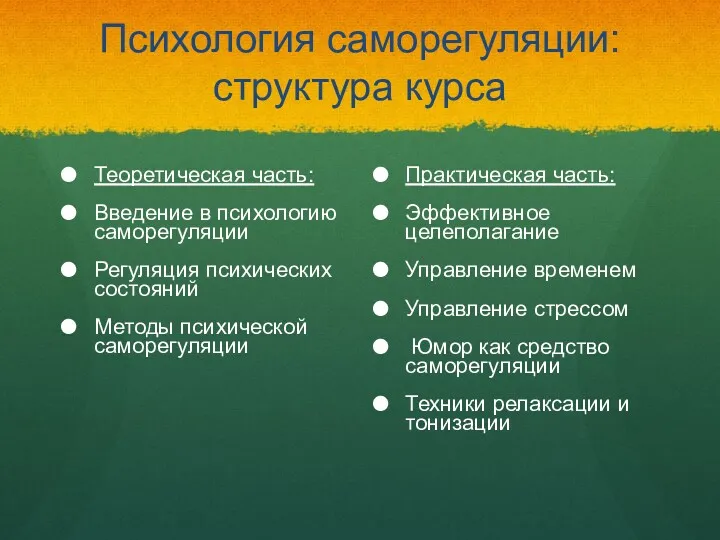 Психология саморегуляции: структура курса
 Понятие об уровнях коммуникации
 Потреби людей
 Проведение экспертизы медийных продуктов
 Как научиться понимать других людей
 Психологические закономерности общения
 Психологические основы профессиональной деятельности
 Физиологические и психологические особенности подросткового возраста
 Сущность и содержание деловых коммуникаций
 Устранение причин стресса путем совершенствования поведенческих навыков
 Научное исследование как особая форма познавательной деятельности в области психологии и педагогики
 Дискурсивное поведение мужчин и женщин
 The Reasoned Action Approach
 Қазіргі этнопсихология
 Всесвітній день запобігання самогубствам
 Обучение
 Как работать с желаниями