- Psychology. Research Methods and Ethics in Psychology

Содержание
- 2. Science/Empiricism Goals of the Scientific Method: Description and Measurement Understanding and Prediction Application and Control Types
- 3. Steps in the Scientific Process Observation ? The art of looking Develop hypothesis (if/then) Test hypothesis
- 4. Types of Research Descriptive Research Accurate & systematic measurement Increases awareness of multiple variables Correlational/Non-experimental Research
- 5. Three Descriptive Approaches Naturalistic Observation Observing others--people watchers? Case Study One of, Case Study Research Surveys
- 6. Random Sampling: Generalizability
- 7. Correlation Correlation: Two variables are said to be correlated when variations in the value of one
- 8. Correlation Correlation coefficient: Measure of the direction and strength of a correlation (r) r ranges -1.0
- 9. Three Kinds of Correlations
- 10. Positive Correlations of Different Strengths
- 11. Experiments: Logic & Definition A research method in which the investigator manipulates a variable under controlled
- 12. Variables: IV and DV Independent Variable: Manipulated Called that because we vary it independently of the
- 13. Elements of an Experiment Other Variables Extraneous Confounding Experimental Group Control Group Random Assignment (Random Sampling?)
- 14. Random Assignment: Equivalent Groups
- 15. Elements for Inferring Causation Random assignment Equivalent groups Control of all other factors Operational definitions Temporally
- 16. Limitations of Experiments Sampling bias Limits generalizability Experimenter Bias Placebo Effects Demand Characteristics Lab to Life?
- 17. Statistics Why? Central Tendency mean median mode Variability Inferential Statistics Statistical Significance
- 18. Brief History of Ethics The Nuremberg Code 1948 The Tuskegee Experiment 1932 – 1972 US Public
- 19. Ethics – Humans in Research Designing an Ethical Study obtaining informed consent deception allowing subjects to
- 20. Ethics Animals in Research protection through regulations what have we learned from animals? Examples: - Roger
- 21. Summary Question ? hypothesis (prediction) Choose a research method, design the study Descriptive? Correlational/Non-experimental? Experimental? Need
- 22. Focus questions: What is the scientific method? Why can theories be proven wrong but not right?
- 23. How do people respond when they know they’re being observed? Why is it important for subjects
- 24. What’s the difference between a positive and a negative correlation? How can correlations be measured? What
- 26. Скачать презентацию
Science/Empiricism
Goals of the Scientific Method:
Description and Measurement
Understanding and Prediction
Application and Control
Types
Science/Empiricism
Goals of the Scientific Method:
Description and Measurement
Understanding and Prediction
Application and Control
Types
Steps in the Scientific Process
Observation ? The art of looking
Develop
Steps in the Scientific Process
Observation ? The art of looking
Develop
Types of Research
Descriptive Research
Accurate & systematic measurement
Increases awareness of multiple variables
Correlational/Non-experimental
Types of Research
Descriptive Research
Accurate & systematic measurement
Increases awareness of multiple variables
Correlational/Non-experimental
Three Descriptive Approaches
Naturalistic Observation
Observing others--people watchers?
Case Study
One of, Case Study Research
Surveys
Tools:
Three Descriptive Approaches
Naturalistic Observation
Observing others--people watchers?
Case Study
One of, Case Study Research
Surveys
Tools:
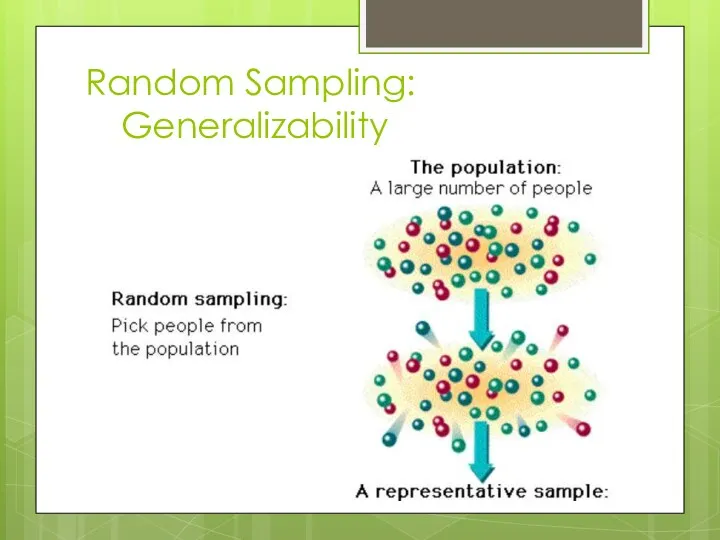
Random Sampling:
Generalizability
Random Sampling:
Generalizability
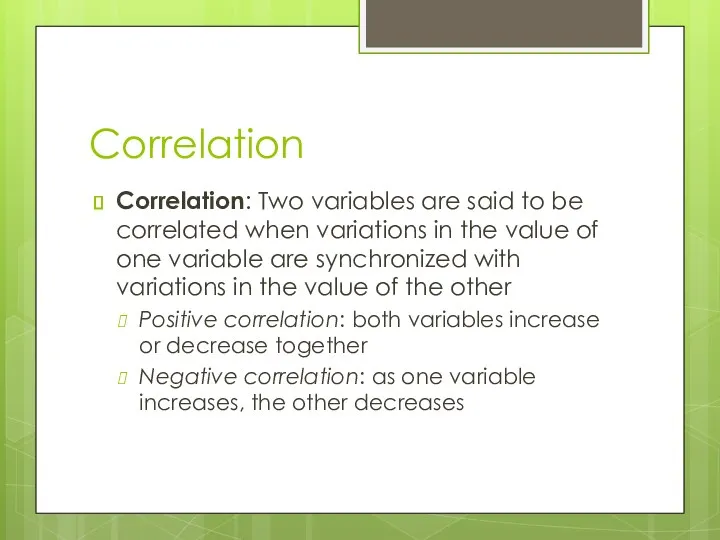
Correlation
Correlation: Two variables are said to be correlated when variations in
Correlation
Correlation: Two variables are said to be correlated when variations in
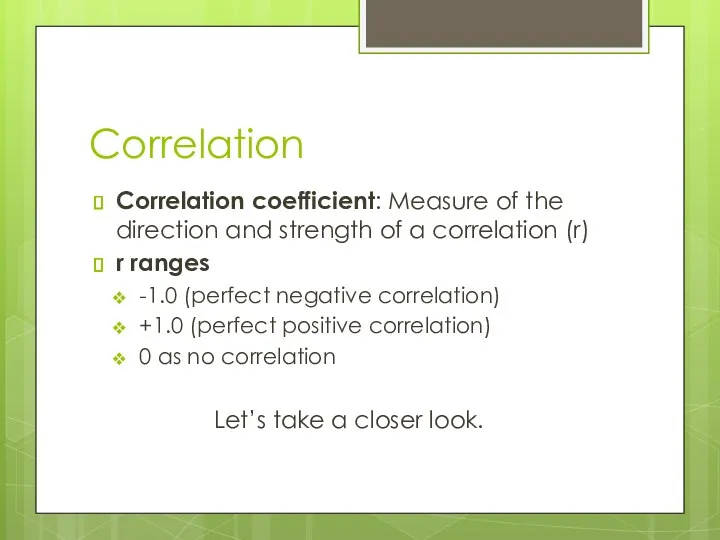
Correlation
Correlation coefficient: Measure of the direction and strength of a correlation
Correlation
Correlation coefficient: Measure of the direction and strength of a correlation
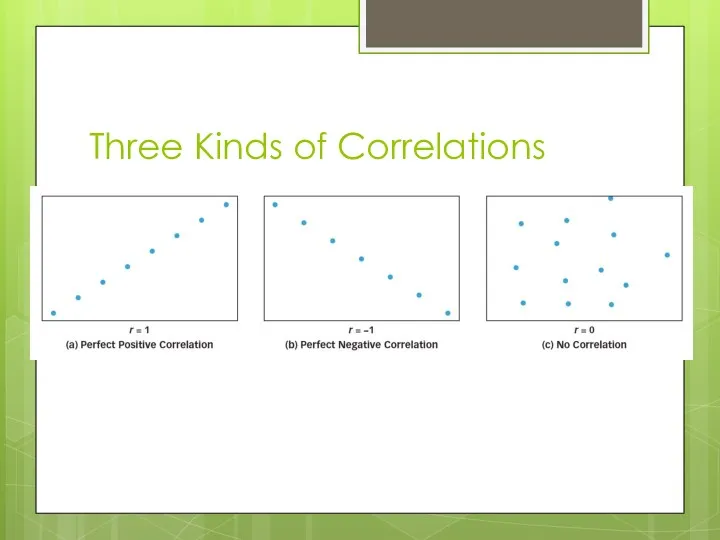
Three Kinds of Correlations
Three Kinds of Correlations
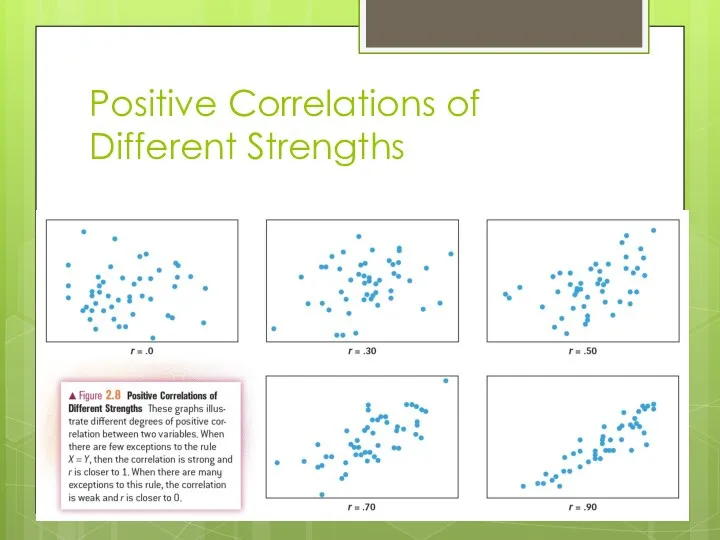
Positive Correlations of Different Strengths
Positive Correlations of Different Strengths
Experiments:
Logic & Definition
A research method in which the investigator manipulates
Experiments:
Logic & Definition
A research method in which the investigator manipulates
Variables: IV and DV
Independent Variable: Manipulated
Called that because we vary it
Variables: IV and DV
Independent Variable: Manipulated
Called that because we vary it
Elements of an Experiment
Other Variables
Extraneous
Confounding
Experimental Group
Control Group
Random Assignment (Random Sampling?)
VERY IMPORTANT
Elements of an Experiment
Other Variables
Extraneous
Confounding
Experimental Group
Control Group
Random Assignment (Random Sampling?)
VERY IMPORTANT
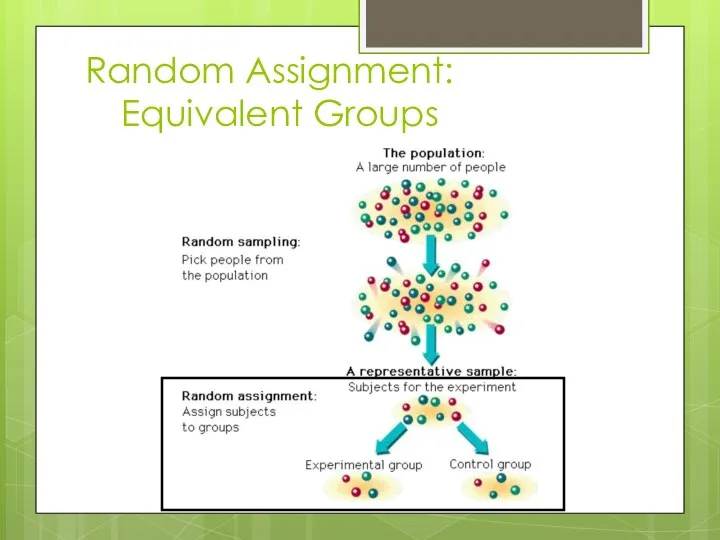
Random Assignment:
Equivalent Groups
Random Assignment:
Equivalent Groups
Elements for Inferring Causation
Random assignment
Equivalent groups
Control of all other factors
Operational definitions
Temporally
Elements for Inferring Causation
Random assignment
Equivalent groups
Control of all other factors
Operational definitions
Temporally
Limitations of Experiments
Sampling bias
Limits generalizability
Experimenter Bias
Placebo Effects
Demand Characteristics
Lab
Limitations of Experiments
Sampling bias
Limits generalizability
Experimenter Bias
Placebo Effects
Demand Characteristics
Lab
Statistics
Why?
Central Tendency
mean
median
mode
Variability
Inferential Statistics
Statistical Significance
Statistics
Why?
Central Tendency
mean
median
mode
Variability
Inferential Statistics
Statistical Significance
Brief History of Ethics
The Nuremberg Code
1948
The Tuskegee Experiment
1932 – 1972
US Public
Brief History of Ethics
The Nuremberg Code
1948
The Tuskegee Experiment
1932 – 1972
US Public
Ethics – Humans in Research
Designing an Ethical Study
obtaining informed consent
deception
allowing subjects
Ethics – Humans in Research
Designing an Ethical Study
obtaining informed consent
deception
allowing subjects
Ethics
Animals in Research
protection through regulations
what have we learned from animals?
Examples: - Roger
Ethics
Animals in Research
protection through regulations
what have we learned from animals?
Examples: - Roger
Summary
Question ? hypothesis (prediction)
Choose a research method, design the study
Descriptive?
Correlational/Non-experimental?
Experimental?
Need to
Summary
Question ? hypothesis (prediction)
Choose a research method, design the study
Descriptive?
Correlational/Non-experimental?
Experimental?
Need to
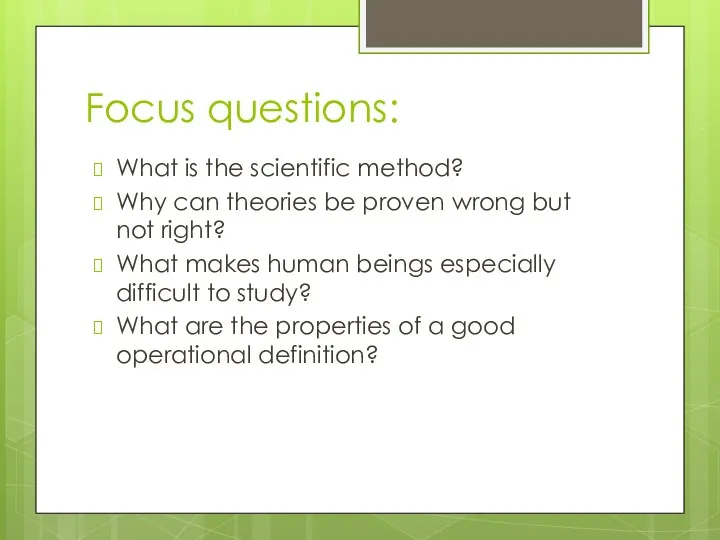
Focus questions:
What is the scientific method?
Why can theories be proven wrong
Focus questions:
What is the scientific method?
Why can theories be proven wrong
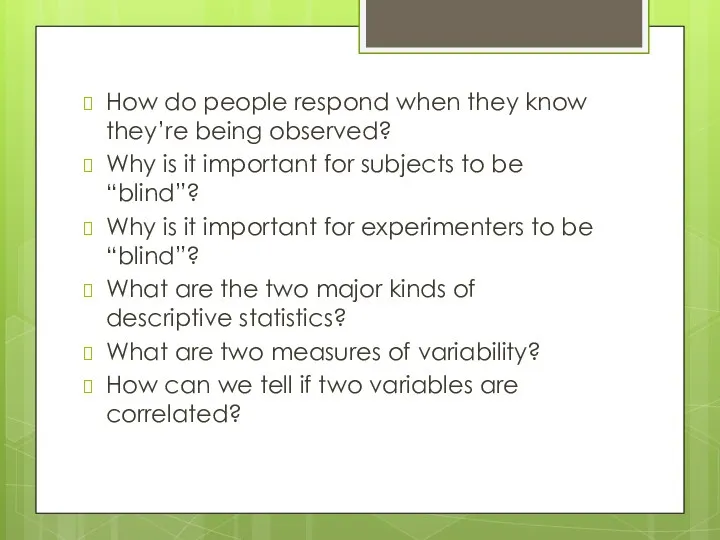
How do people respond when they know they’re being observed?
Why is
How do people respond when they know they’re being observed?
Why is
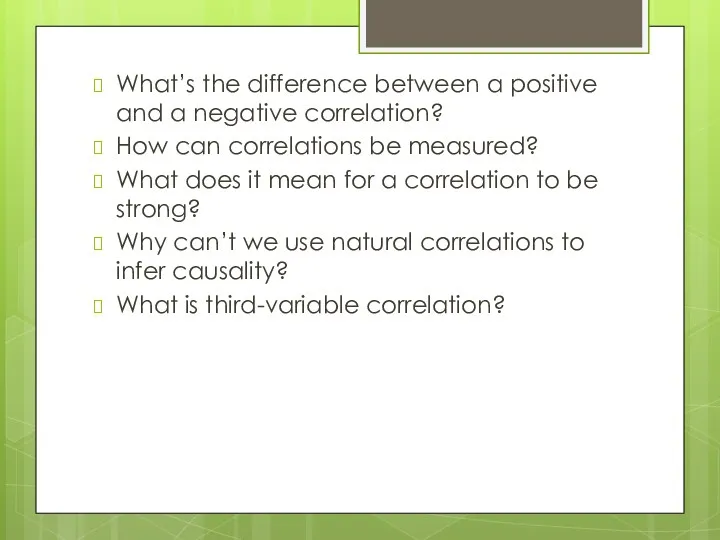
What’s the difference between a positive and a negative correlation?
How can
What’s the difference between a positive and a negative correlation?
How can
 Влияние цветовой гаммы одежды педагогов на эмоциональное состояние обучающихся и мотивацию
 Методы психодиагностики. Методика 1.
 Правила поведения в толпе
 Подросток.Возрастная психология для родителей.
 Семинар: Дыхание Любви
 Psixologik konfliktologiya fanining predmeti va vazifalari
 Толерантность. Межкультурная толерантность
 Лекции по психодиагностике. Требования к построению и проверке психодиагностических методов
 Fears and phobias
 Разбуди в себе лидера
 Культурно-историческая концепция развития личности Л.С. Выготского
 Толпа
Толпа Золотое правило этики
 Профилактика употребления психоактивных веществ у подростков в деятельности педагога дополнительного образования
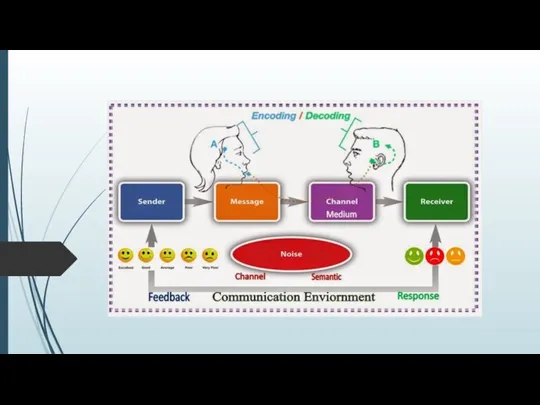 Verbal behaviors categories
 Онтопсихолингвистика. Становление языкового сознания
 Психолингвистика
 Тесты
Тесты Травля, или буллинг, или моббинг
 Введение в психологию семейных отношений
 Мастер-класс Я устраиваюсь на работу. Золотые правила собеседования
 Трудности в поведении детей дошкольного возраста. Методы и приёмы психолого-педагогической коррекции
 Сознание. Определение, виды, свойства сознания
 Психологическая подготовка выпускников к новым формам итоговой аттестации
 Психологическая готовность ребенка к школе
 Рекомендації для батьків з розвитку емоційної сфери дітей
 Темперамент. Типы темперамента
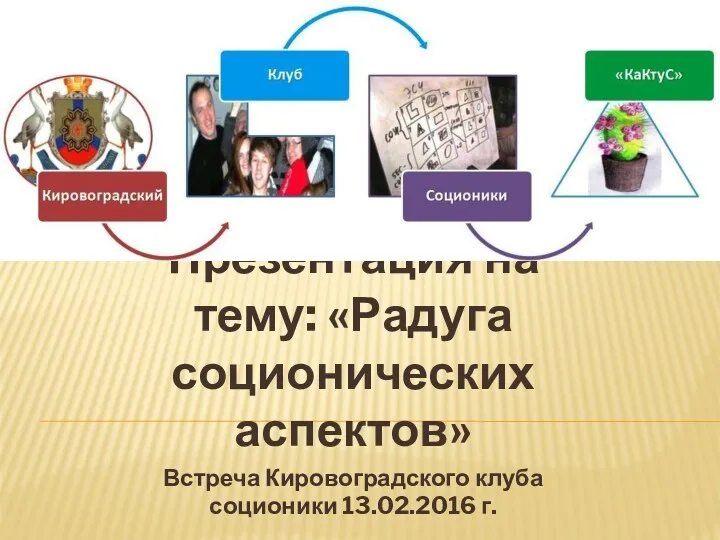 Радуга соционических аспектов