- Economics as a science

Содержание
- 2. economics The study of how individuals and societies choose to use the scarce resources that nature
- 3. Three fundamental concepts: Opportunity cost Marginalism Efficient markets To Learn a Way of Thinking Why Study
- 4. To Learn a Way of Thinking Why Study Economics? Opportunity Cost opportunity cost The best alternative
- 5. To Learn a Way of Thinking Why Study Economics? Marginalism marginalism The process of analyzing the
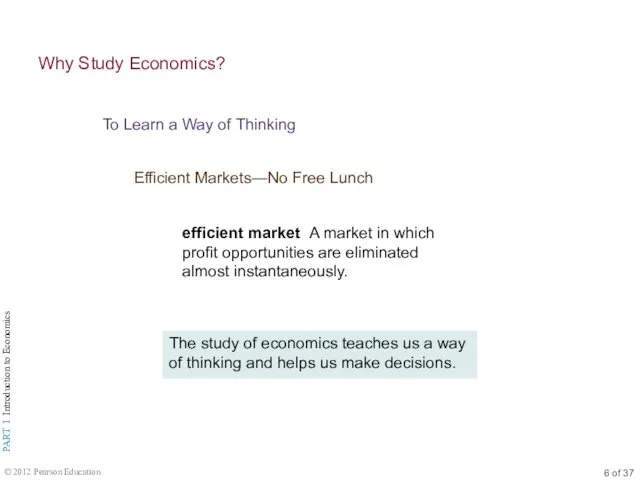
- 6. To Learn a Way of Thinking Why Study Economics? Efficient Markets—No Free Lunch efficient market A
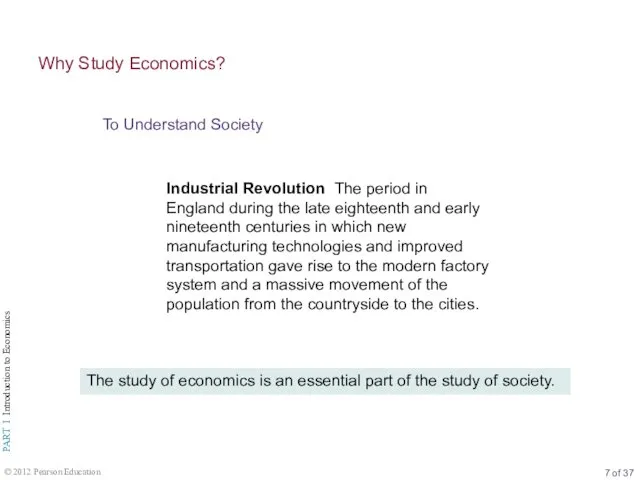
- 7. To Understand Society Why Study Economics? Industrial Revolution The period in England during the late eighteenth
- 8. To Understand Global Affairs Why Study Economics? An understanding of economics is essential to an understanding
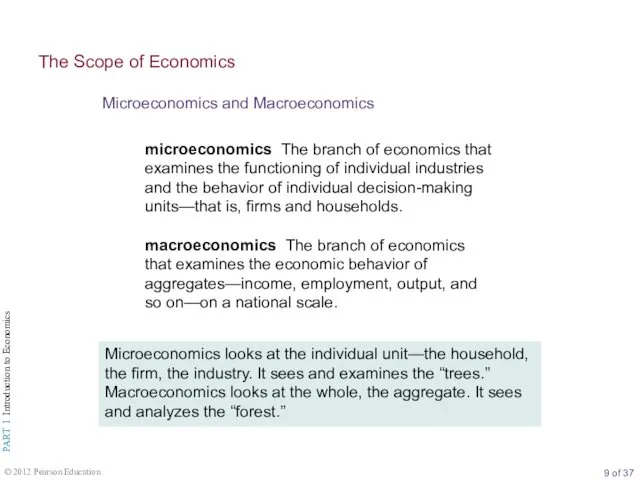
- 9. Microeconomics and Macroeconomics The Scope of Economics microeconomics The branch of economics that examines the functioning
- 10. Microeconomics and Macroeconomics The Scope of Economics
- 11. The Diverse Fields of Economics The Scope of Economics Continued...
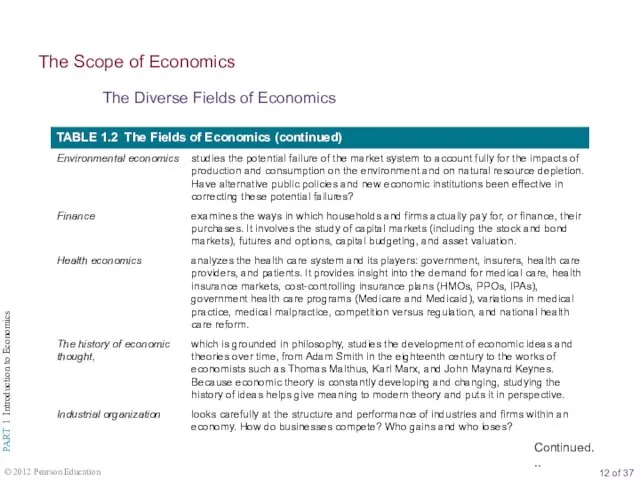
- 12. The Diverse Fields of Economics The Scope of Economics Continued...
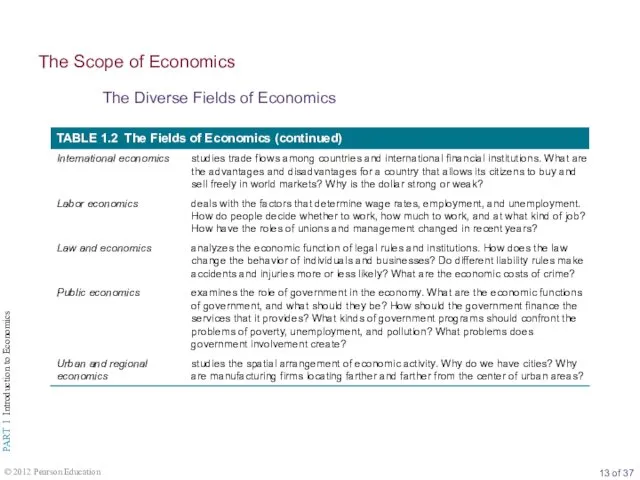
- 13. The Diverse Fields of Economics The Scope of Economics
- 14. E C O N O M I C S I N P R A C T
- 15. The Method of Economics positive economics An approach to economics that seeks to understand behavior and
- 16. Descriptive Economics and Economic Theory The Method of Economics descriptive economics The compilation of data that
- 17. Theories and Models The Method of Economics model A formal statement of a theory, usually a
- 18. All Else Equal: Ceteris Paribus ceteris paribus, or all else equal A device used to analyze
- 19. Expressing Models in Words, Graphs, and Equations Theories and Models The Method of Economics Methods of
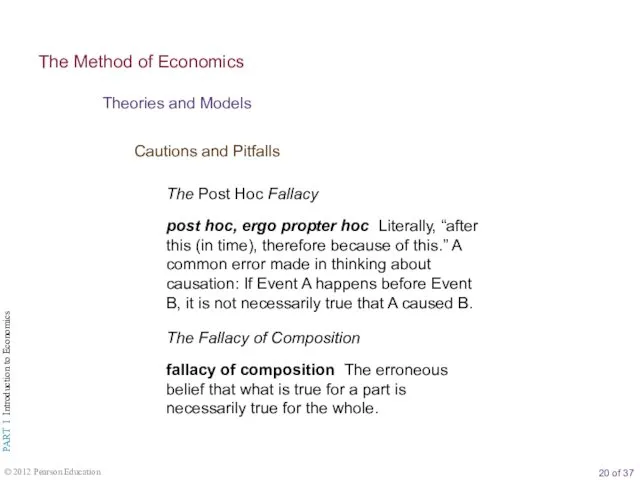
- 20. Cautions and Pitfalls Theories and Models The Method of Economics The Post Hoc Fallacy post hoc,
- 21. Testing Theories and Models: Empirical Economics Theories and Models The Method of Economics empirical economics The
- 22. Economic Policy The Method of Economics Criteria for judging economic outcomes: 1. Efficiency 2. Equity 3.
- 23. Efficiency Economic Policy The Method of Economics Equity efficiency In economics, allocative efficiency. An efficient economy
- 24. Growth Economic Policy The Method of Economics Stability economic growth An increase in the total output
- 25. R E V I E W T E R M S A N D C O
- 26. A graph is a two-dimensional representation of a set of numbers, or data. How to Read
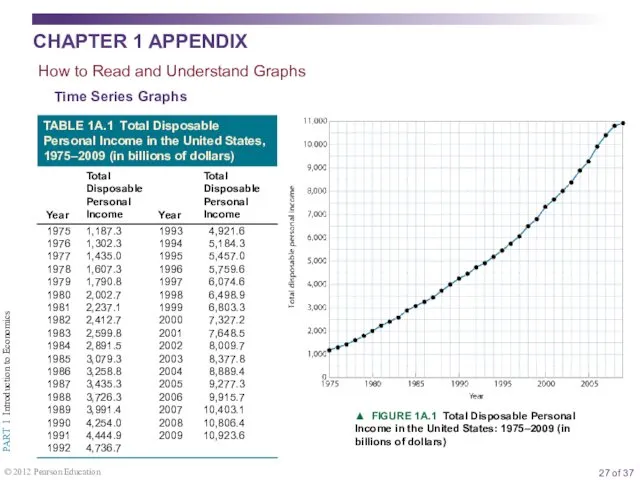
- 27. How to Read and Understand Graphs Time Series Graphs ▲ FIGURE 1A.1 Total Disposable Personal Income
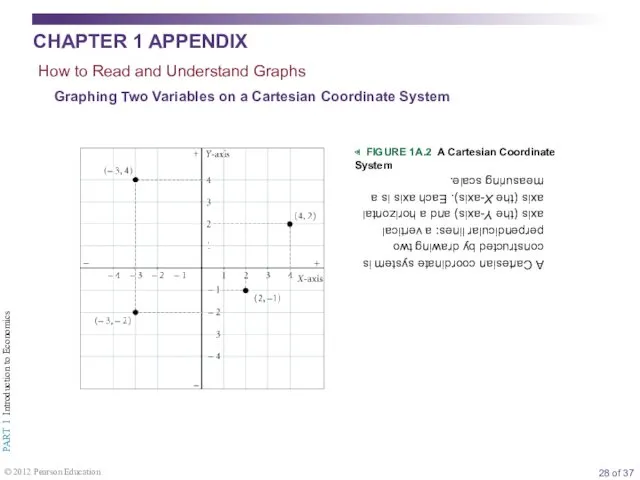
- 28. Graphing Two Variables on a Cartesian Coordinate System Appendix ◀ FIGURE 1A.2 A Cartesian Coordinate System
- 29. A graph is a simple two-dimensional geometric representation of data. This graph displays the data from
- 30. Slope ▼ FIGURE 1A.4 A Curve with (a) Positive Slope and (b) Negative Slope How to
- 31. ▲ FIGURE 1A.5 Changing Slopes along Curves How to Read and Understand Graphs Slope CHAPTER 1
- 32. ▶ FIGURE 1A.6 National Income and Consumption Some Precautions It is important to think carefully about
- 34. Скачать презентацию
economics The study of how individuals and societies choose to use
economics The study of how individuals and societies choose to use
Three fundamental concepts:
Opportunity cost
Marginalism
Efficient markets
To Learn a Way of Thinking
Why Study
Three fundamental concepts:
Opportunity cost
Marginalism
Efficient markets
To Learn a Way of Thinking
Why Study
To Learn a Way of Thinking
Why Study Economics?
Opportunity Cost
opportunity cost The
To Learn a Way of Thinking
Why Study Economics?
Opportunity Cost
opportunity cost The
To Learn a Way of Thinking
Why Study Economics?
Marginalism
marginalism The process of
To Learn a Way of Thinking
Why Study Economics?
Marginalism
marginalism The process of
To Learn a Way of Thinking
Why Study Economics?
Efficient Markets—No Free Lunch
efficient
To Learn a Way of Thinking
Why Study Economics?
Efficient Markets—No Free Lunch
efficient
To Understand Society
Why Study Economics?
Industrial Revolution The period in England during
To Understand Society
Why Study Economics?
Industrial Revolution The period in England during
To Understand Global Affairs
Why Study Economics?
An understanding of economics is essential
To Understand Global Affairs
Why Study Economics?
An understanding of economics is essential
Microeconomics and Macroeconomics
The Scope of Economics
microeconomics The branch of economics that
Microeconomics and Macroeconomics
The Scope of Economics
microeconomics The branch of economics that
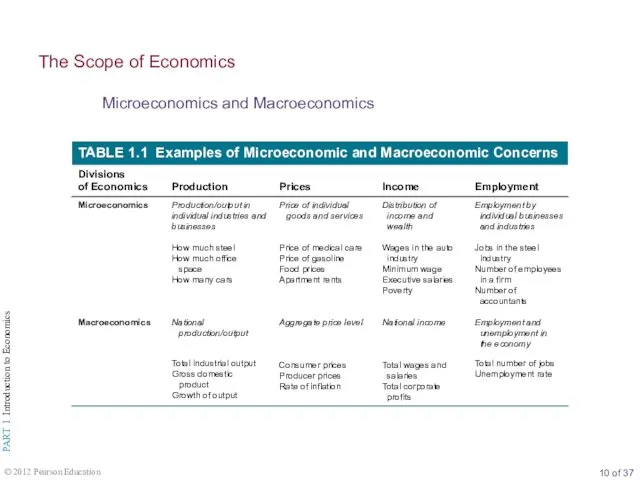
Microeconomics and Macroeconomics
The Scope of Economics
Microeconomics and Macroeconomics
The Scope of Economics
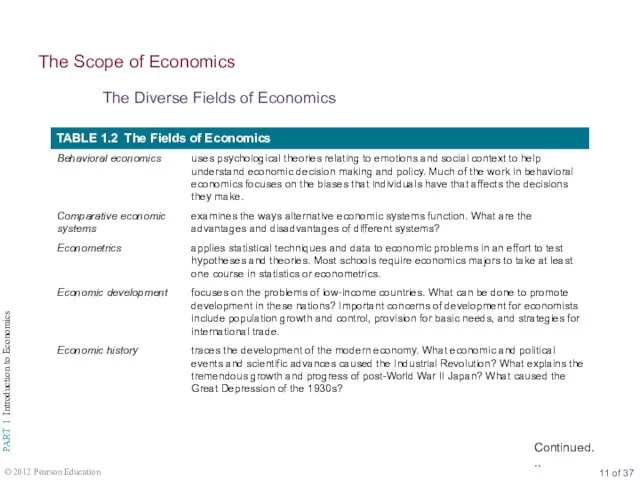
The Diverse Fields of Economics
The Scope of Economics
Continued...
The Diverse Fields of Economics
The Scope of Economics
Continued...
The Diverse Fields of Economics
The Scope of Economics
Continued...
The Diverse Fields of Economics
The Scope of Economics
Continued...
The Diverse Fields of Economics
The Scope of Economics
The Diverse Fields of Economics
The Scope of Economics
E C O N O M I C S I N
E C O N O M I C S I N
The Method of Economics
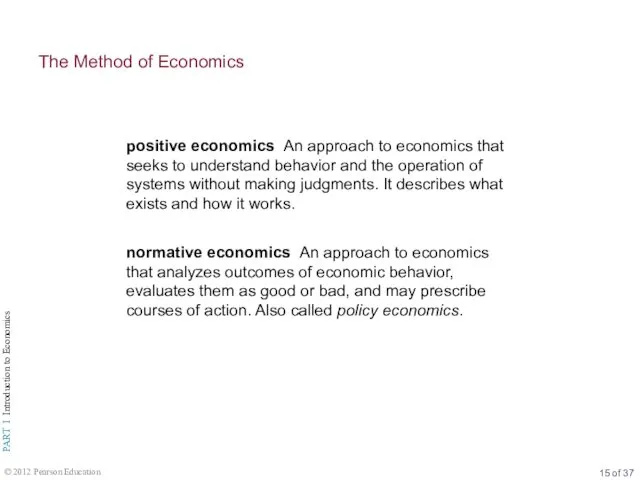
positive economics An approach to economics that seeks
The Method of Economics
positive economics An approach to economics that seeks
Descriptive Economics and Economic Theory
The Method of Economics
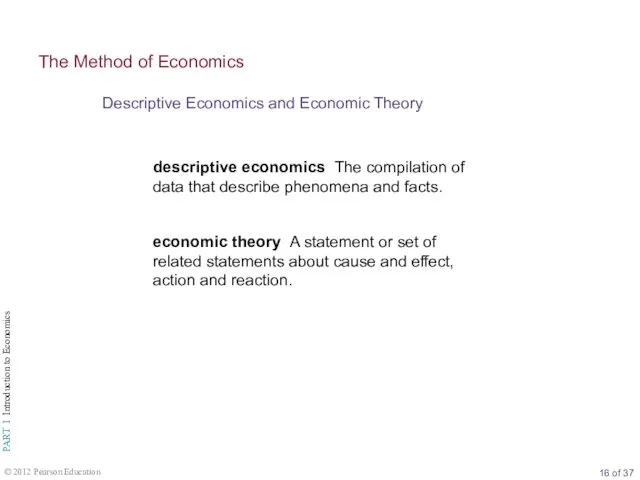
descriptive economics The compilation
Descriptive Economics and Economic Theory
The Method of Economics
descriptive economics The compilation
Theories and Models
The Method of Economics
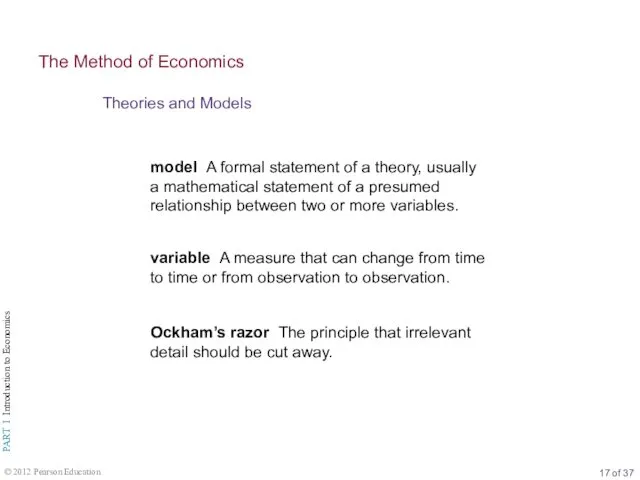
model A formal statement of a
Theories and Models
The Method of Economics
model A formal statement of a
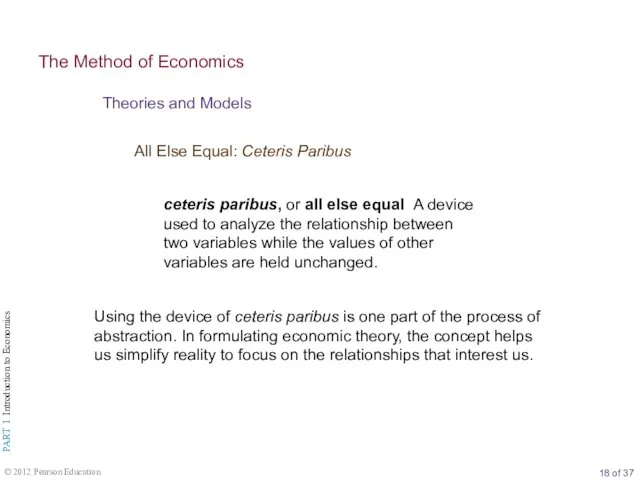
All Else Equal: Ceteris Paribus
ceteris paribus, or all else equal A
All Else Equal: Ceteris Paribus
ceteris paribus, or all else equal A
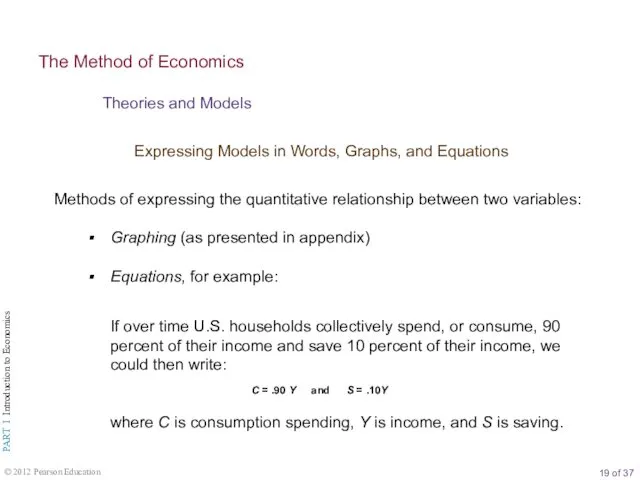
Expressing Models in Words, Graphs, and Equations
Theories and Models
The Method of
Expressing Models in Words, Graphs, and Equations
Theories and Models
The Method of
Cautions and Pitfalls
Theories and Models
The Method of Economics
The Post Hoc Fallacy
post
Cautions and Pitfalls
Theories and Models
The Method of Economics
The Post Hoc Fallacy
post
Testing Theories and Models: Empirical Economics
Theories and Models
The Method of Economics
empirical
Testing Theories and Models: Empirical Economics
Theories and Models
The Method of Economics
empirical
Economic Policy
The Method of Economics
Criteria for judging economic outcomes:
1. Efficiency
2. Equity
3.
Economic Policy
The Method of Economics
Criteria for judging economic outcomes:
1. Efficiency
2. Equity
3.
Efficiency
Economic Policy
The Method of Economics
Equity
efficiency In economics, allocative efficiency. An efficient
Efficiency
Economic Policy
The Method of Economics
Equity
efficiency In economics, allocative efficiency. An efficient
Growth
Economic Policy
The Method of Economics
Stability
economic growth An increase in the total
Growth
Economic Policy
The Method of Economics
Stability
economic growth An increase in the total
R E V I E W T E R M S
R E V I E W T E R M S
A graph is a two-dimensional representation of a set of numbers,
A graph is a two-dimensional representation of a set of numbers,
How to Read and Understand Graphs
Time Series Graphs
▲ FIGURE 1A.1 Total
How to Read and Understand Graphs
Time Series Graphs
▲ FIGURE 1A.1 Total
Graphing Two Variables on a Cartesian Coordinate System
Appendix
◀ FIGURE 1A.2 A
Graphing Two Variables on a Cartesian Coordinate System
Appendix
◀ FIGURE 1A.2 A
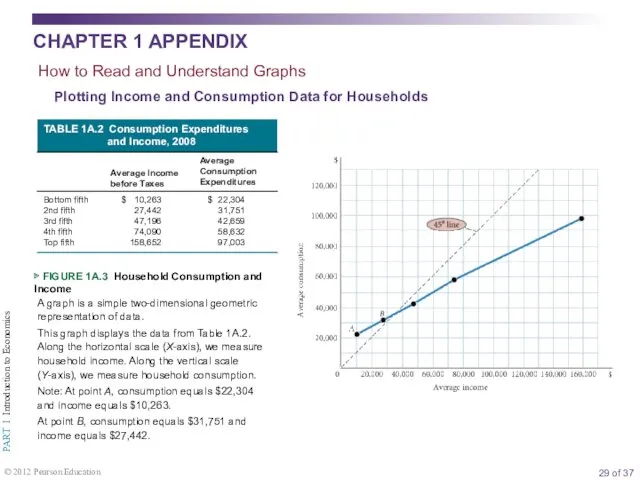
A graph is a simple two-dimensional geometric representation of data.
This
A graph is a simple two-dimensional geometric representation of data.
This
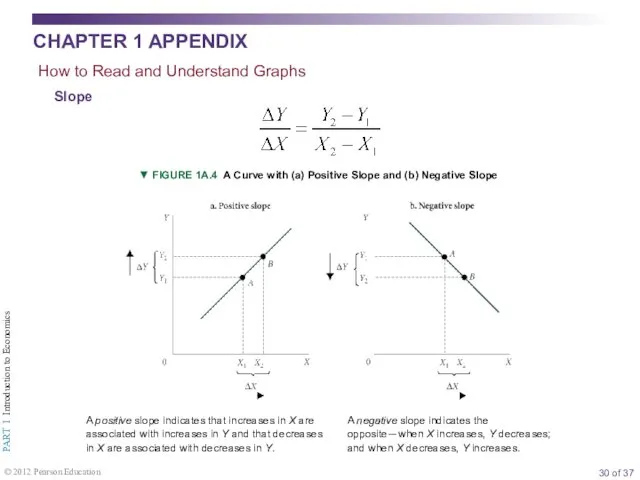
Slope
▼ FIGURE 1A.4 A Curve with (a) Positive Slope and (b)
Slope
▼ FIGURE 1A.4 A Curve with (a) Positive Slope and (b)
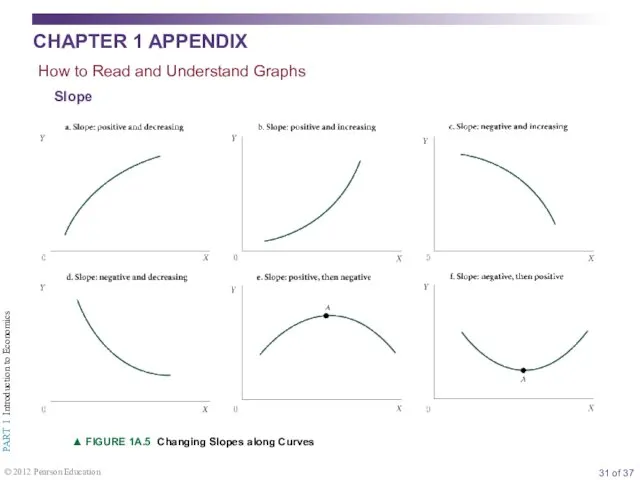
▲ FIGURE 1A.5 Changing Slopes along Curves
How to Read and Understand
▲ FIGURE 1A.5 Changing Slopes along Curves
How to Read and Understand
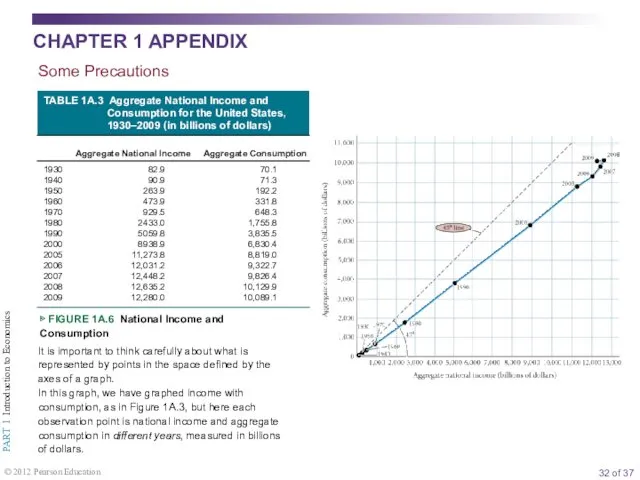
▶ FIGURE 1A.6 National Income and
Consumption
Some Precautions
It is important to think
▶ FIGURE 1A.6 National Income and
Consumption
Some Precautions
It is important to think
 Триггер от trigger – курок (спусковой крючок)
 Материал из опыта работы -презентация Предупреждение детского травматизма
 Возникновение ислама. Арабский халифат и его распад
 Сборочное производство в структуре завода. Основные направления в совершенствование сборочного производства
 Личность ребенка, как субъект воспитания
 Манул
Манул Презентация по Православным Праздникам
 Презентация. Организация ситуации успеха в учебно - воспитательном процессе.
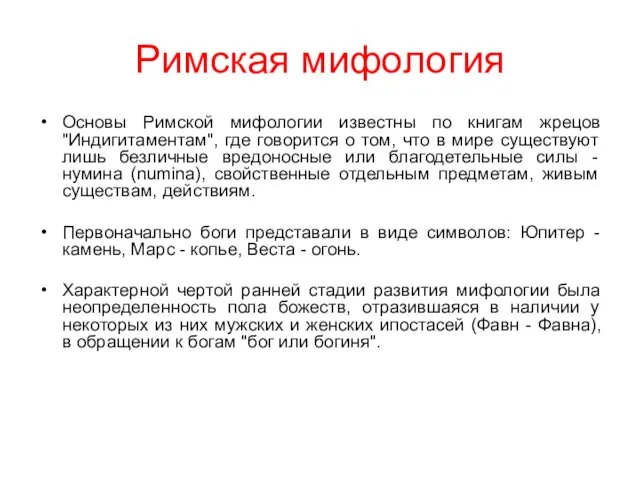 Римская мифология
 Задачи для самостоятельного решения
 О пенсионной системе РФ: долгий путь на пенсию
 Под шепот фонтанных струй
 Программирование на Python: графика. Простые программы
 Игра-презентация Четвёртый лишний
 uzniki_kontslagerey_slayd_1-12
 Сочинение-рассуждение. 10 класс
 Види мережевих атак
 Analysis of the current state of organic agriculture
 Электронагревательные приборы. Электрический чайник
 Животный мир Амурской области
 ПРЕЗЕНТАЦИЯ Этикет дошкольника
 Машины для мелиоративных работ
 Веселая математика. Веселая разминка
 Персонализация отношений в коллективе
 Керування проектами
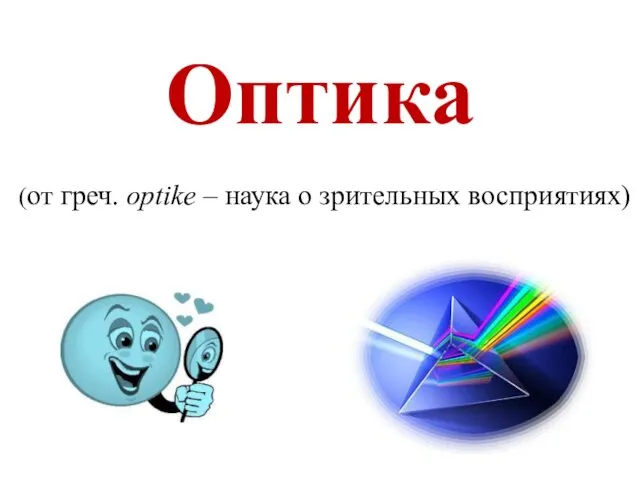 Геометрическая оптика
 Федеральная государственная информационная система Росаккредитации
 Биоэтика в современном здравоохранении