- Excel. Formulas, functions, and other useful features

Содержание
- 2. OVERVIEW Excel is a spreadsheet, a grid made from columns and rows. It is a software
- 3. BASICS OF A SPREADSHEET Spreadsheets are made up of Columns Rows and their intersections are called
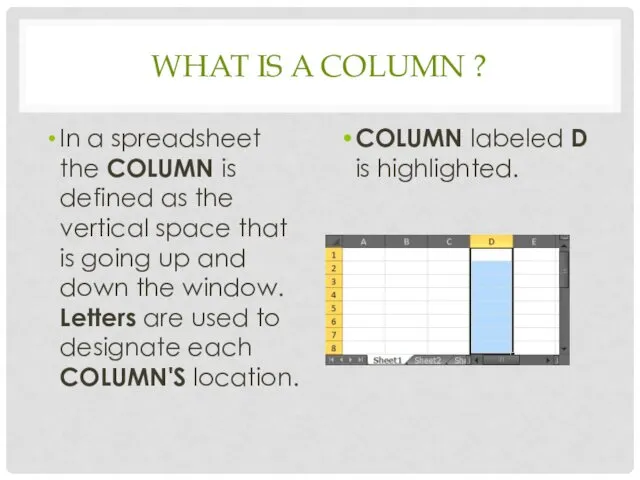
- 4. WHAT IS A COLUMN ? In a spreadsheet the COLUMN is defined as the vertical space
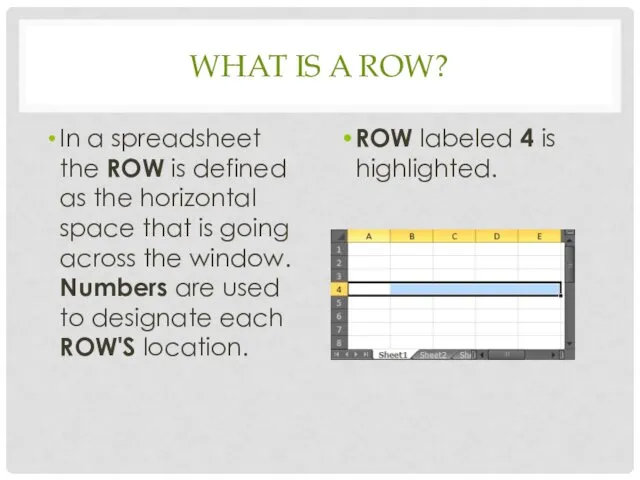
- 5. WHAT IS A ROW? In a spreadsheet the ROW is defined as the horizontal space that
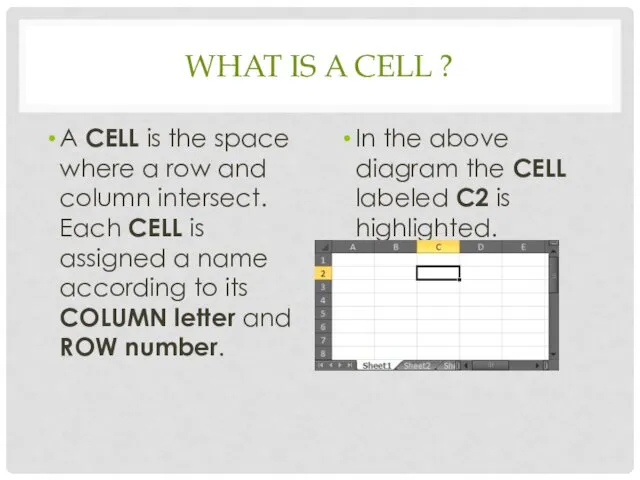
- 6. WHAT IS A CELL ? A CELL is the space where a row and column intersect.
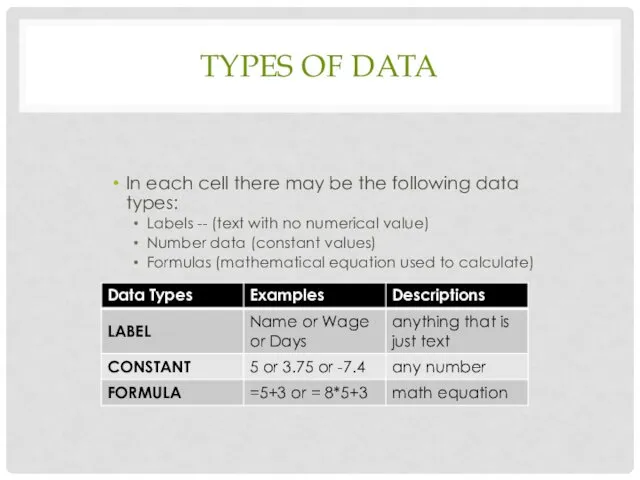
- 7. TYPES OF DATA In each cell there may be the following data types: Labels -- (text
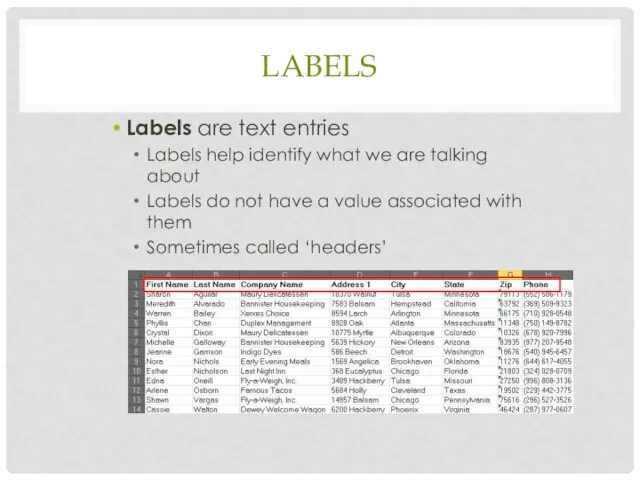
- 8. LABELS Labels are text entries Labels help identify what we are talking about Labels do not
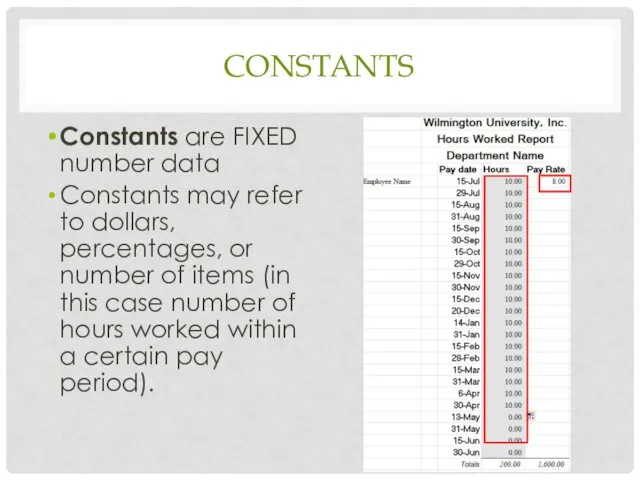
- 9. CONSTANTS Constants are FIXED number data Constants may refer to dollars, percentages, or number of items
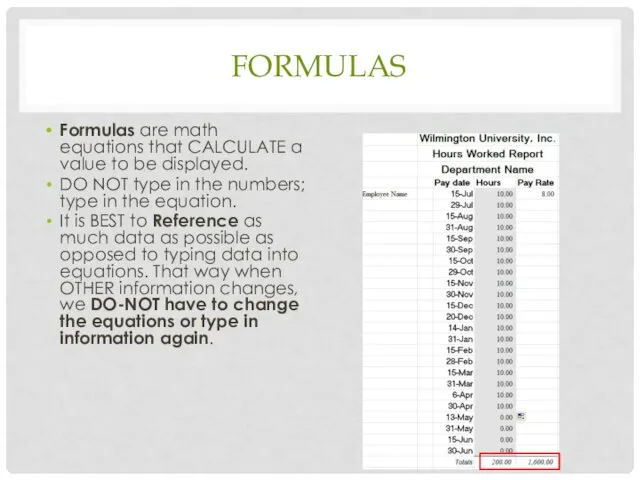
- 10. FORMULAS Formulas are math equations that CALCULATE a value to be displayed. DO NOT type in
- 11. BASIC FORMULAS & FUNCTIONS EXCEL 2010
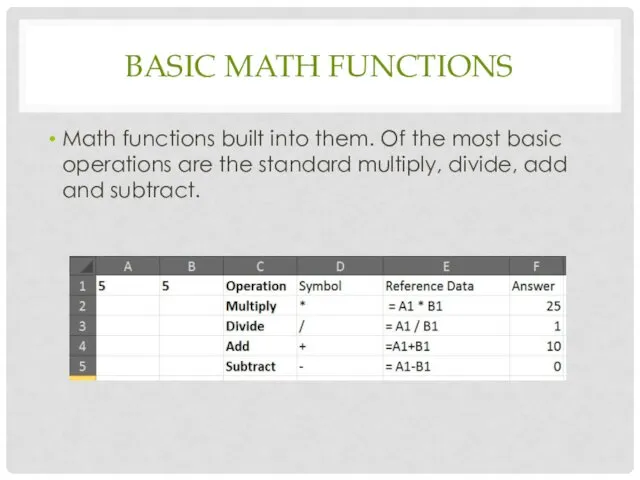
- 12. BASIC MATH FUNCTIONS Math functions built into them. Of the most basic operations are the standard
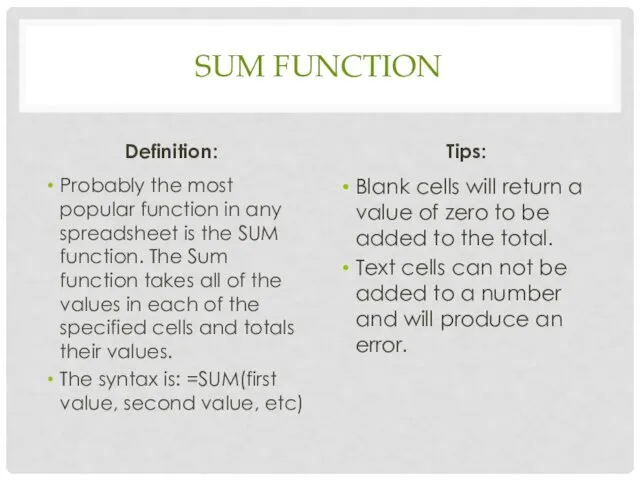
- 13. SUM FUNCTION Definition: Probably the most popular function in any spreadsheet is the SUM function. The
- 14. SUM FUNCTION
- 15. AVERAGE FUNCTION The average function finds the average of the specified data. (Simplifies adding all of
- 16. MAX & MIN FUNCTIONS The Max function will return the largest (max) value in the selected
- 17. COUNT FUNCTION The Count function will return the number of entries (actually counts each cell that
- 18. IF FUNCTION Definition: The IF function will check the logical condition of a statement and return
- 19. IF FUNCTION IF Functions are like programing - they provide multiple answers based on certain conditions.
- 20. DATA TOOLS EXCEL 2010
- 21. CONCATENATE FUNCTION Concatenate function - join several strings into one text string Note: The concatenate function
- 22. TEXT TO COLUMNS Text to Columns – delineate via special characters or fixed width
- 23. REMOVING DUPLICATE VALUES Removing duplicate values – check for and delete specific cells with duplicate values
- 24. USEFUL FEATURES EXCEL 2010
- 25. Show all formulas and the general number format of cells Saves you time because you don’t
- 26. KEYBOARD SHORT CUT TO INSTANTLY REVEAL FORMULAS To do this, just press the Ctrl key and
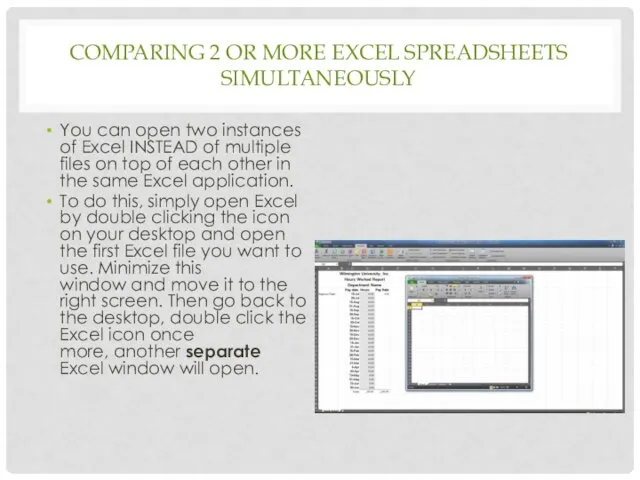
- 27. COMPARING 2 OR MORE EXCEL SPREADSHEETS SIMULTANEOUSLY You can open two instances of Excel INSTEAD of
- 28. SORTING Arranging data so it’s easy to analyze You can sort the data alphabetically, from highest
- 29. FILTERS The Filter is a quick and easy way to find and work with a subset
- 30. TABLES To make managing and analyzing a group of related data easier, you can turn a
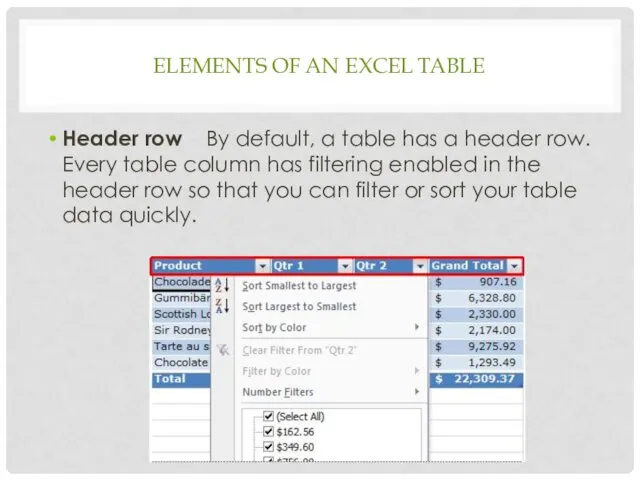
- 31. ELEMENTS OF AN EXCEL TABLE Header row By default, a table has a header row. Every
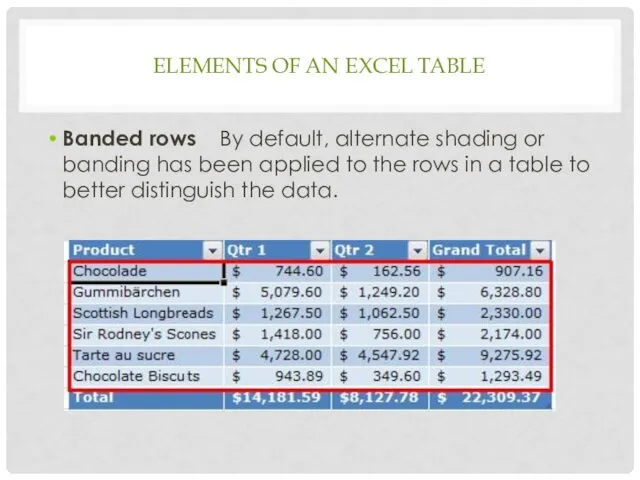
- 32. ELEMENTS OF AN EXCEL TABLE Banded rows By default, alternate shading or banding has been applied
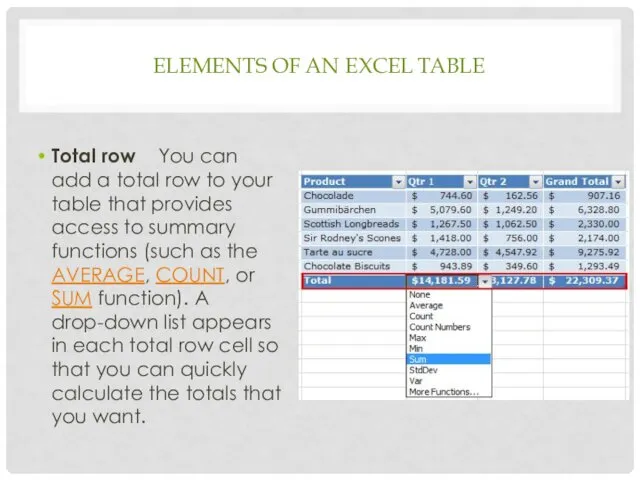
- 33. ELEMENTS OF AN EXCEL TABLE Total row You can add a total row to your table
- 34. CREATING A TABLE
- 35. FREEZE HEADERS To freeze a row in your worksheet, highlight the row where you wish all
- 36. SET PRINT AREA
- 37. NARROW MARGINS
- 38. SHRINK TO FIT
- 39. PIVOT TABLE A Pivot table lets your arrange, sort, and filter a set of data on
- 41. Скачать презентацию
OVERVIEW
Excel is a spreadsheet, a grid made from columns and
OVERVIEW
Excel is a spreadsheet, a grid made from columns and
BASICS OF A SPREADSHEET
Spreadsheets are made up of
Columns
Rows
and their
BASICS OF A SPREADSHEET
Spreadsheets are made up of
Columns
Rows
and their
WHAT IS A COLUMN ?
In a spreadsheet the COLUMN is
WHAT IS A COLUMN ?
In a spreadsheet the COLUMN is
WHAT IS A ROW?
In a spreadsheet the ROW is defined
WHAT IS A ROW?
In a spreadsheet the ROW is defined
WHAT IS A CELL ?
A CELL is the space where
WHAT IS A CELL ?
A CELL is the space where
TYPES OF DATA
In each cell there may be the following data
TYPES OF DATA
In each cell there may be the following data
LABELS
Labels are text entries
Labels help identify what we are talking
LABELS
Labels are text entries
Labels help identify what we are talking
CONSTANTS
Constants are FIXED number data
Constants may refer to dollars, percentages,
CONSTANTS
Constants are FIXED number data
Constants may refer to dollars, percentages,
FORMULAS
Formulas are math equations that CALCULATE a value to be
FORMULAS
Formulas are math equations that CALCULATE a value to be
BASIC FORMULAS & FUNCTIONS
EXCEL 2010
BASIC FORMULAS & FUNCTIONS
EXCEL 2010
BASIC MATH FUNCTIONS
Math functions built into them. Of the most
BASIC MATH FUNCTIONS
Math functions built into them. Of the most
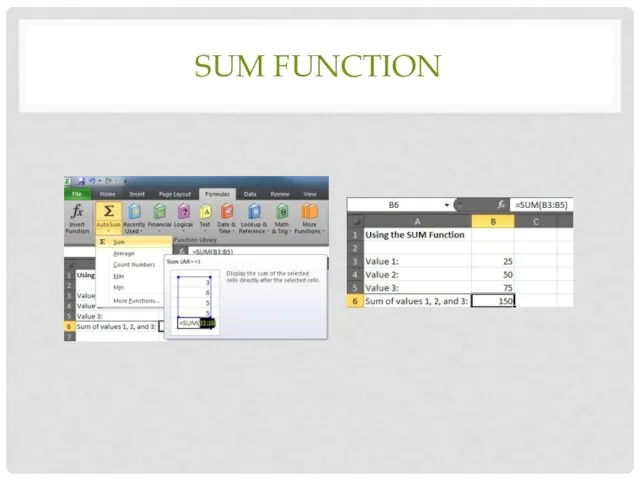
SUM FUNCTION
Definition:
Probably the most popular function in any spreadsheet is
SUM FUNCTION
Definition:
Probably the most popular function in any spreadsheet is
SUM FUNCTION
SUM FUNCTION
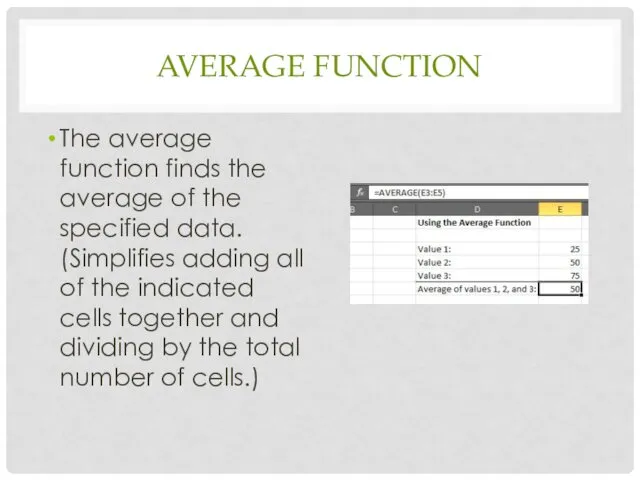
AVERAGE FUNCTION
The average function finds the average of the specified data.
AVERAGE FUNCTION
The average function finds the average of the specified data.
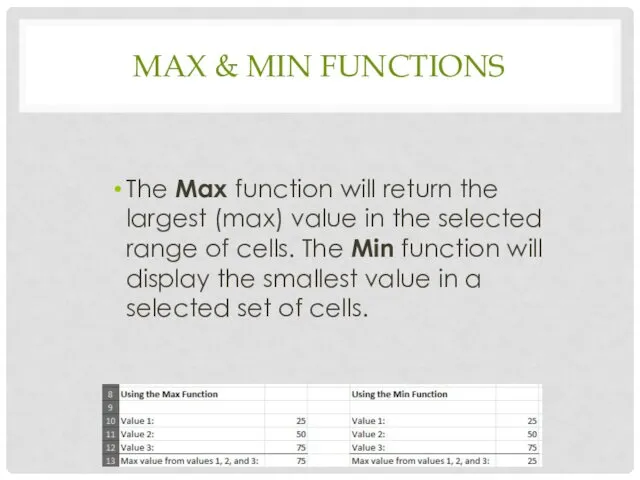
MAX & MIN FUNCTIONS
The Max function will return the largest (max)
MAX & MIN FUNCTIONS
The Max function will return the largest (max)
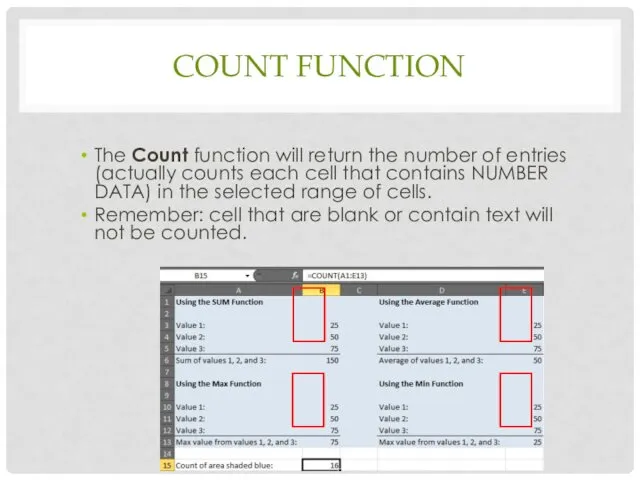
COUNT FUNCTION
The Count function will return the number of entries
COUNT FUNCTION
The Count function will return the number of entries
IF FUNCTION
Definition:
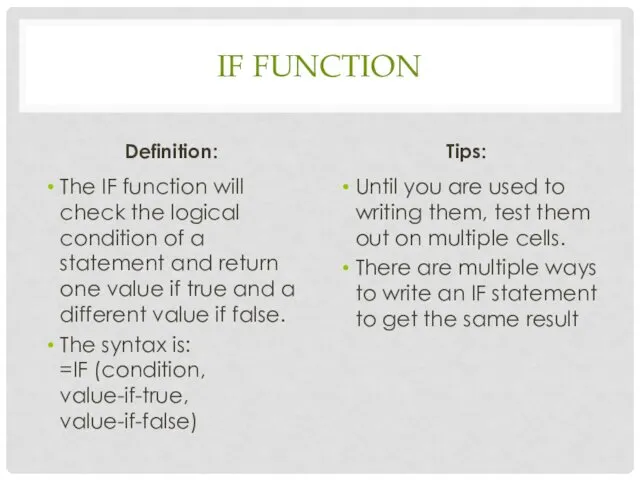
The IF function will check the logical condition of
IF FUNCTION
Definition:
The IF function will check the logical condition of
IF FUNCTION
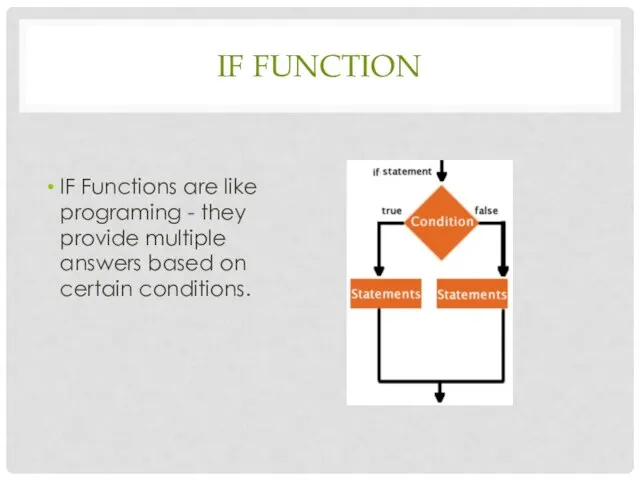
IF Functions are like programing - they provide multiple
IF FUNCTION
IF Functions are like programing - they provide multiple
DATA TOOLS
EXCEL 2010
DATA TOOLS
EXCEL 2010
CONCATENATE FUNCTION
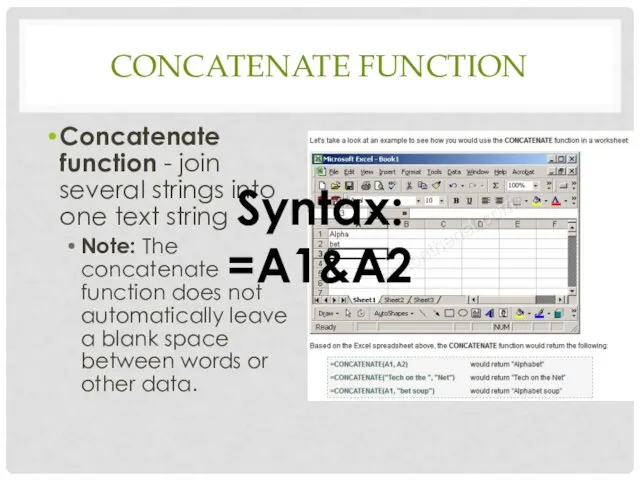
Concatenate function - join several strings into one text string
CONCATENATE FUNCTION
Concatenate function - join several strings into one text string
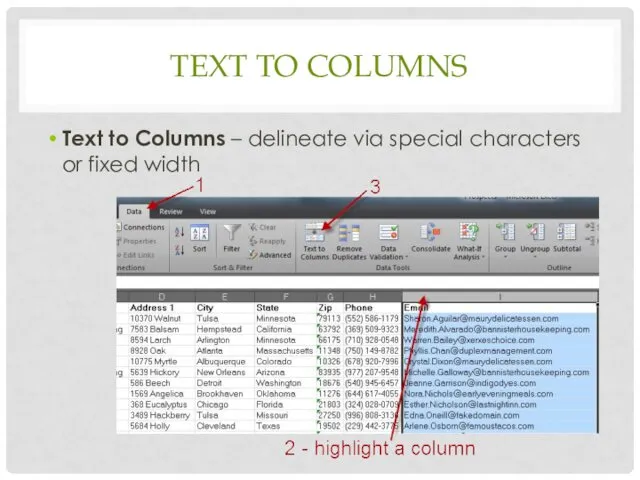
TEXT TO COLUMNS
Text to Columns – delineate via special characters or
TEXT TO COLUMNS
Text to Columns – delineate via special characters or
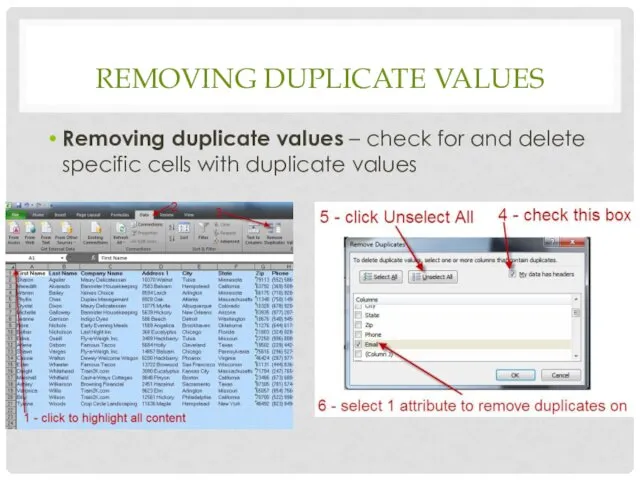
REMOVING DUPLICATE VALUES
Removing duplicate values – check for and delete specific
REMOVING DUPLICATE VALUES
Removing duplicate values – check for and delete specific

USEFUL FEATURES
EXCEL 2010
USEFUL FEATURES
EXCEL 2010
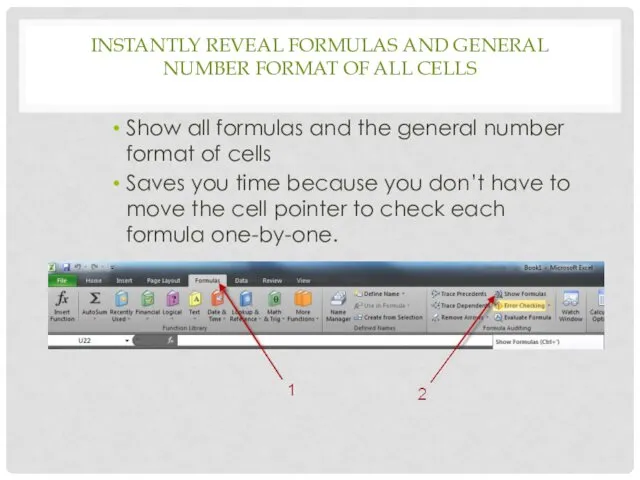
Show all formulas and the general number format of cells
Saves you
Show all formulas and the general number format of cells
Saves you
KEYBOARD SHORT CUT TO
INSTANTLY REVEAL FORMULAS
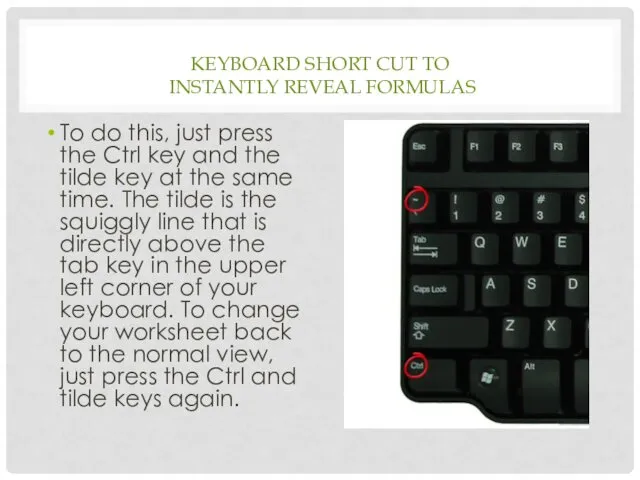
To do this, just press
KEYBOARD SHORT CUT TO
INSTANTLY REVEAL FORMULAS
To do this, just press
COMPARING 2 OR MORE EXCEL SPREADSHEETS SIMULTANEOUSLY
You can open two
COMPARING 2 OR MORE EXCEL SPREADSHEETS SIMULTANEOUSLY
You can open two
SORTING
Arranging data so it’s easy to analyze
You can sort the
SORTING
Arranging data so it’s easy to analyze
You can sort the
FILTERS
The Filter is a quick and easy way to find
FILTERS
The Filter is a quick and easy way to find
TABLES
To make managing and analyzing a group of related data
TABLES
To make managing and analyzing a group of related data
ELEMENTS OF AN EXCEL TABLE
Header row By default, a table has a
ELEMENTS OF AN EXCEL TABLE
Header row By default, a table has a
ELEMENTS OF AN EXCEL TABLE
Banded rows By default, alternate shading or banding
ELEMENTS OF AN EXCEL TABLE
Banded rows By default, alternate shading or banding
ELEMENTS OF AN EXCEL TABLE
Total row You can add a total row
ELEMENTS OF AN EXCEL TABLE
Total row You can add a total row
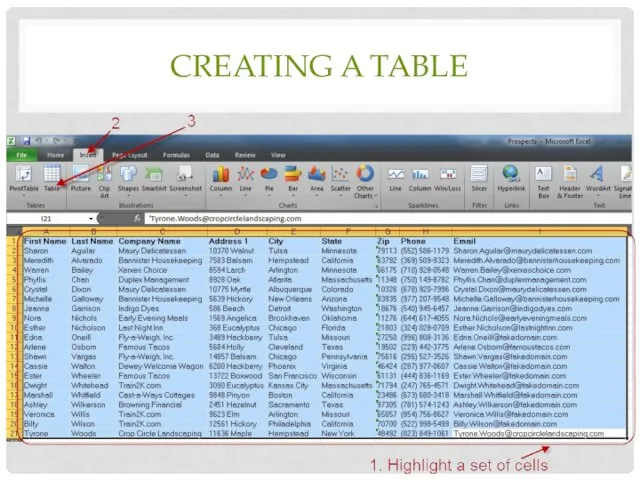
CREATING A TABLE
CREATING A TABLE
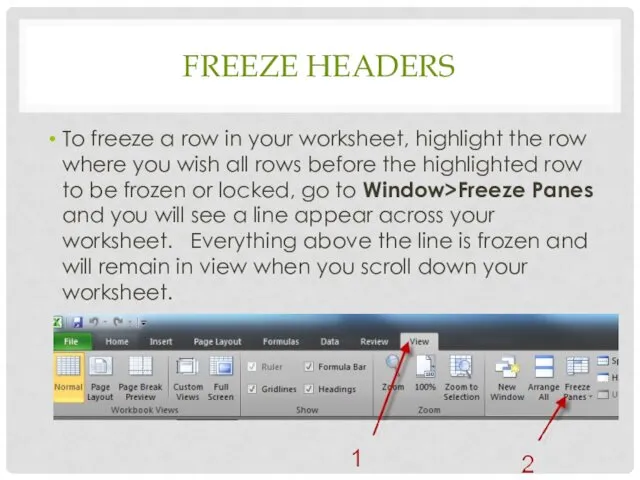
FREEZE HEADERS
To freeze a row in your worksheet, highlight the row
FREEZE HEADERS
To freeze a row in your worksheet, highlight the row
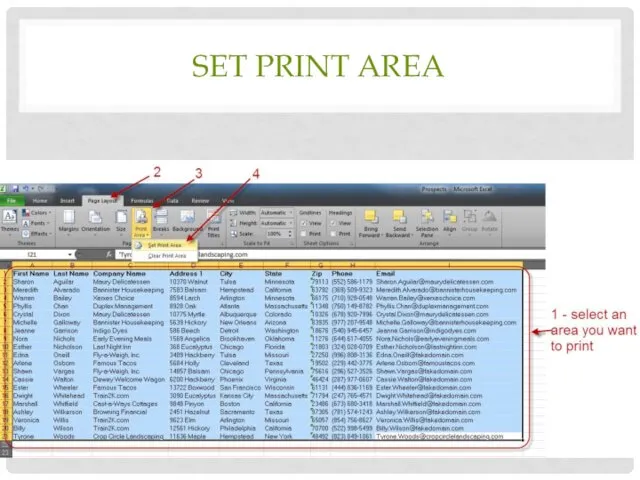
SET PRINT AREA
SET PRINT AREA
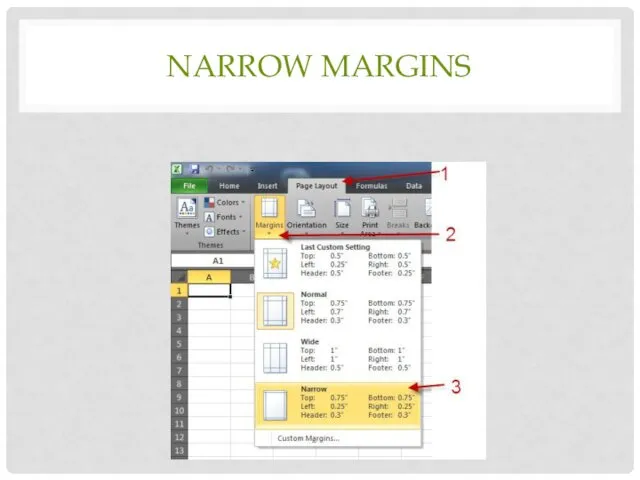
NARROW MARGINS
NARROW MARGINS
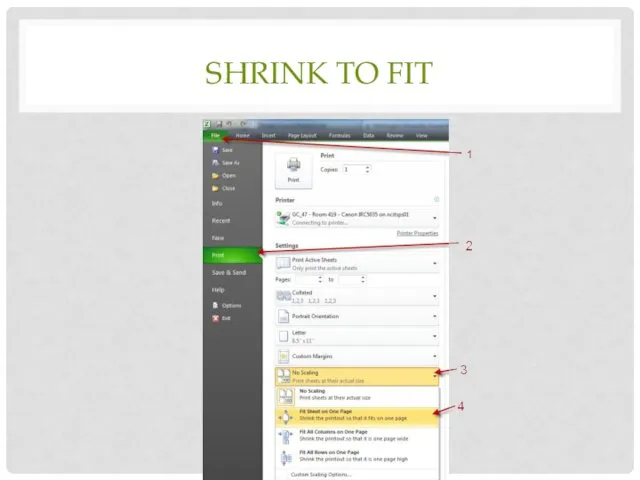
SHRINK TO FIT
SHRINK TO FIT
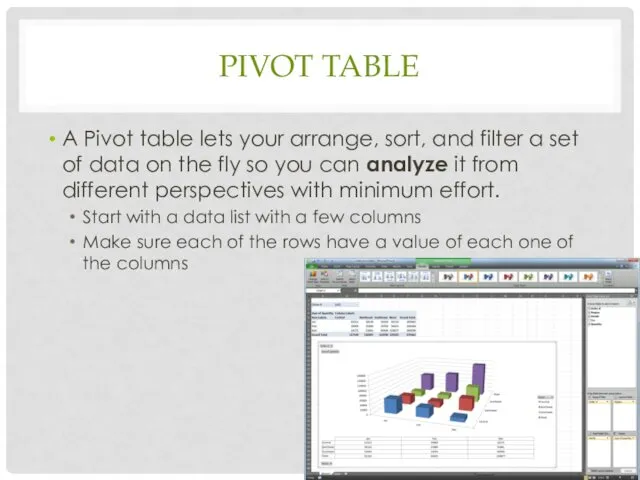
PIVOT TABLE
A Pivot table lets your arrange, sort, and filter a
PIVOT TABLE
A Pivot table lets your arrange, sort, and filter a
 Автоматизация Р в слогах и словах
 Знаменитые жители СПб
 A Case Bronchitis
 Идентификация и фальсификация молочных товаров
 Испытания в процессе проектирования РЭА
 Шахматные фигуры. Начальная позиция.
 Німецька класична філософія 70-ті рр XVIIІ ст. (“коперніканський переворот”)
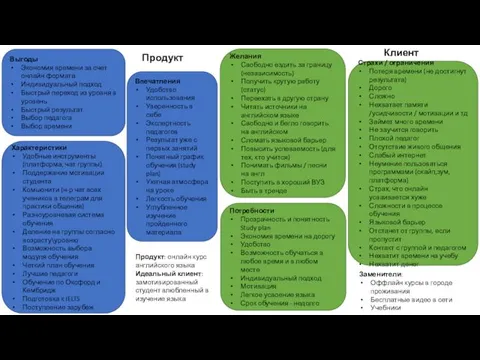 Онлайн курс английского языка. Ценностное предложение и УТП
 Классный час: Государственные символы РОССИИ. Электронная презентация.
 Проект: Мир сказок К. И. Чуковского. (средняя группа)
 Группа компаний Комитет.Орг. Hr-мероприятия. Деловые события и форумы
 Музыкальная драматургия
 Выселковский район. Вчера, сегодня, завтра.
 Иудаизм
 Презентация Зимние олимпийские игры в Сочи
 Знание научное и знание художественное
 Возбуждение и рассмотрение дела об административном правонарушении
 Силачи и слабаки в мире кислот и оснований.
 Интеллектуально-развлекательная игра Морской бой по ПДД
 Συνδρομο υπνικης απνοιας
 ТЕАТРАЛИЗОВАННАЯ ДЕЯТЕЛЬНОСТЬ – ОДНО ИЗ ПЕРСПЕКТИВНЫХ НАПРАВЛЕНИЙ РАЗВИТИЯ СОВРЕМЕННОГО ДОШКОЛЬНОГО ОБРАЗОВАНИЯ
 Peek-a-Boo
 День России
 Цифро-аналоговый преобразователь: структурная схема и принцип действия
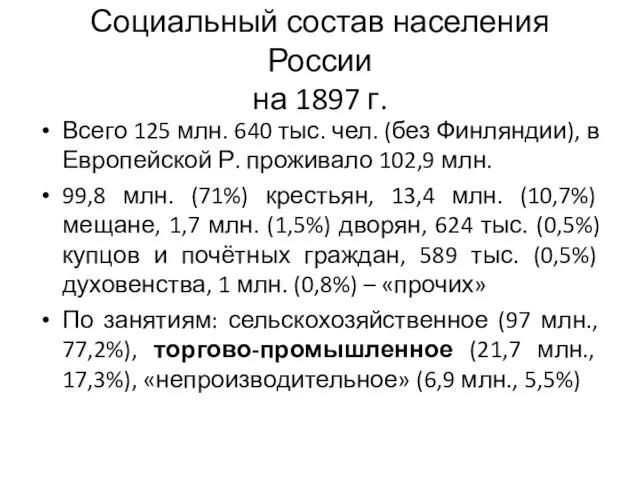 Социальный состав населения России на 1897 год
 Германия (11 класс)
 Сестринский процесс при эпидемическом паротите, ветряной оспе
 Экономическая политика Петра I