- Impulse response

Содержание
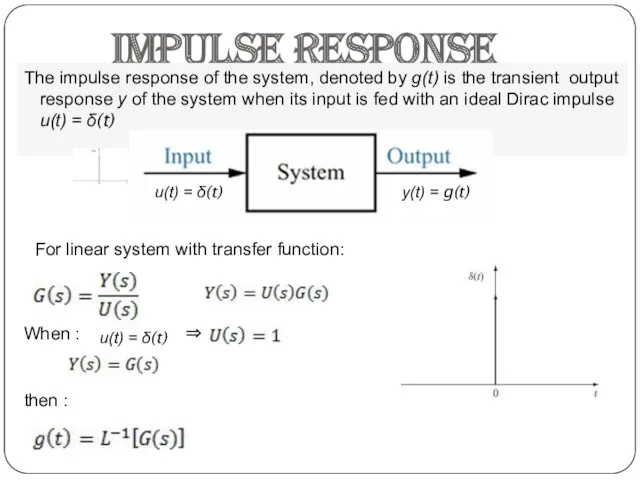
- 2. Impulse response The impulse response of the system, denoted by g(t) is the transient output response
- 3. Example: RC circuit: Impulse response
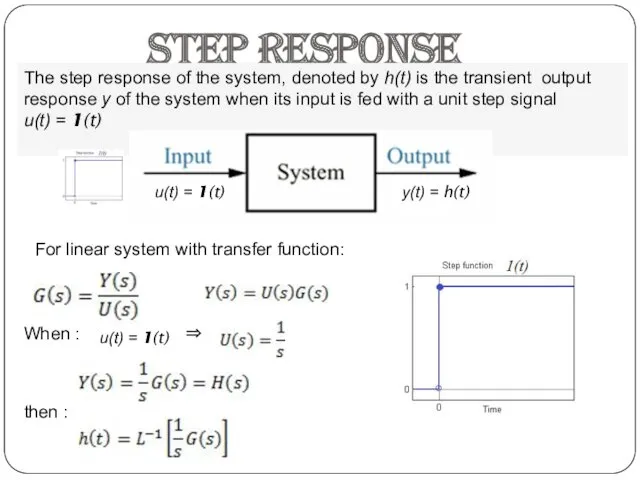
- 4. Step response The step response of the system, denoted by h(t) is the transient output response
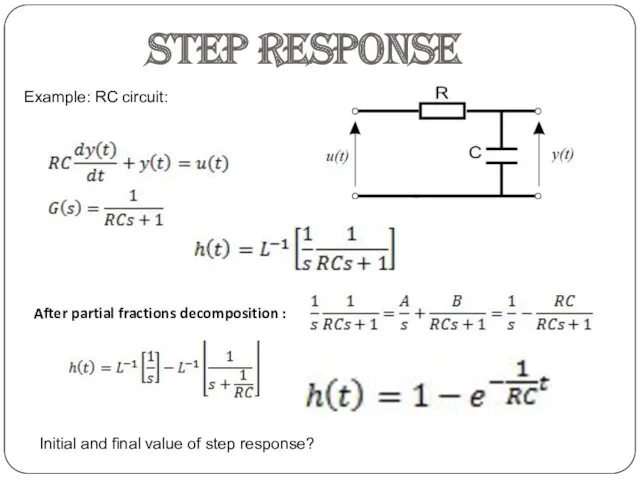
- 5. Example: RC circuit: Step response After partial fractions decomposition : Initial and final value of step
- 6. Step response versus impulse response ⇒ ⇒
- 7. Device for an experimental obtaining the step response: Step response
- 8. Frequency response is the quantitative measure of the output spectrum of a system or device in
- 9. Frequency responses ⇒ where:
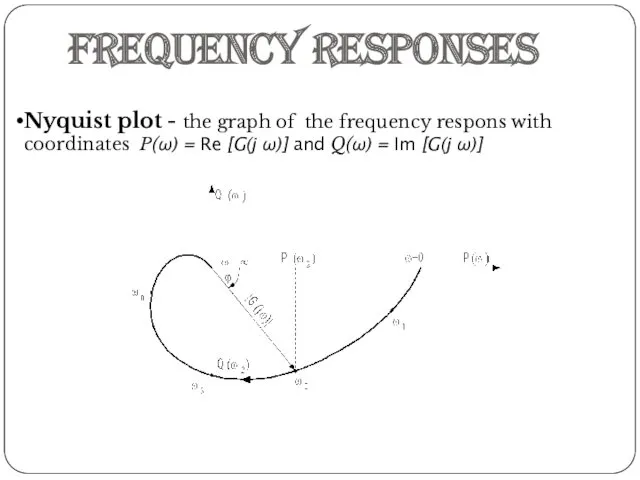
- 10. Frequency responses Nyquist plot - the graph of the frequency respons with coordinates P(ω) = Re
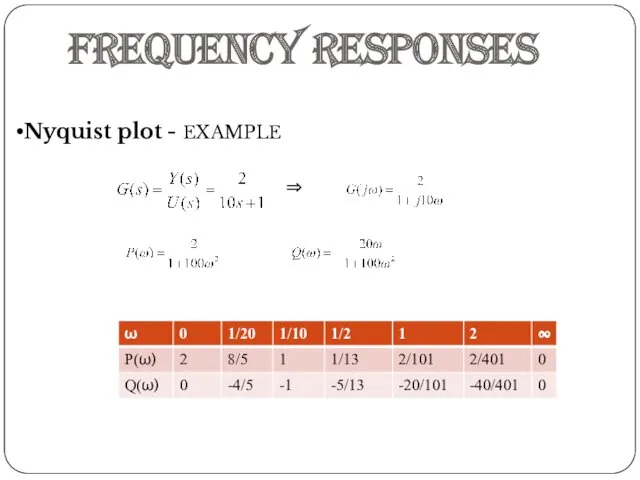
- 11. Frequency responses Nyquist plot - EXAMPLE ⇒
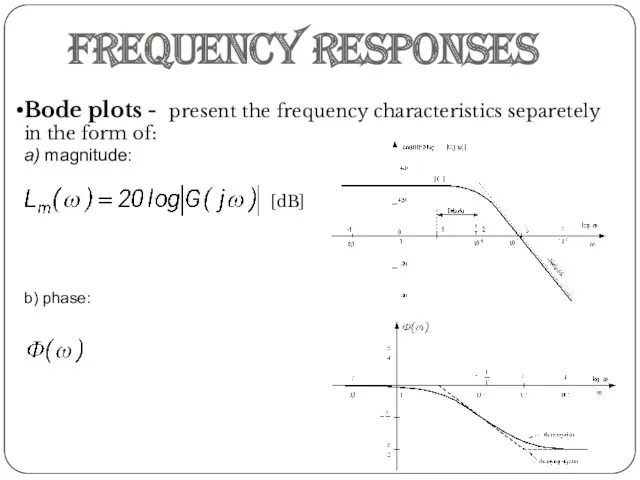
- 12. Frequency responses Bode plots - present the frequency characteristics separetely in the form of: a) magnitude:
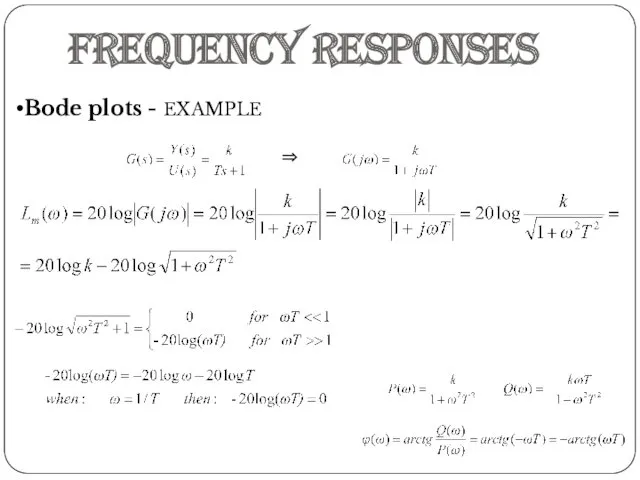
- 13. Frequency responses Bode plots - EXAMPLE ⇒
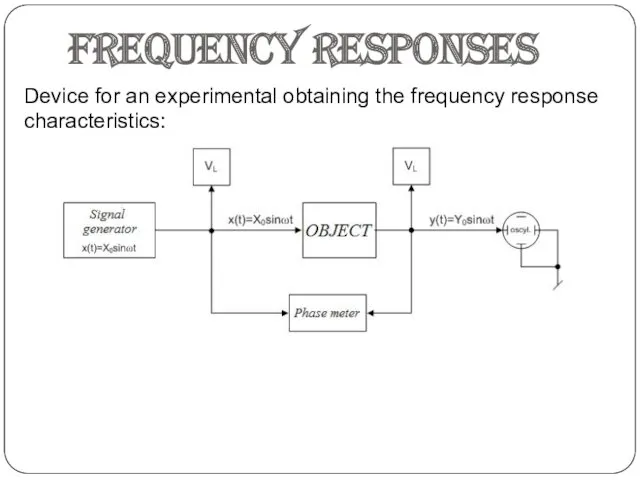
- 14. Frequency responses Device for an experimental obtaining the frequency response characteristics:
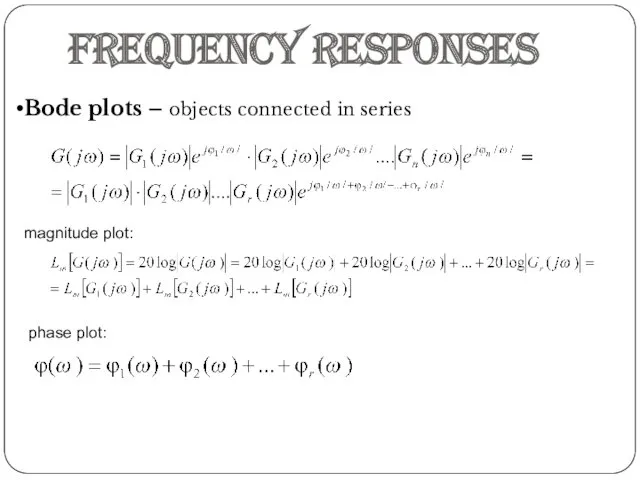
- 15. Frequency responses Bode plots – objects connected in series magnitude plot: phase plot:
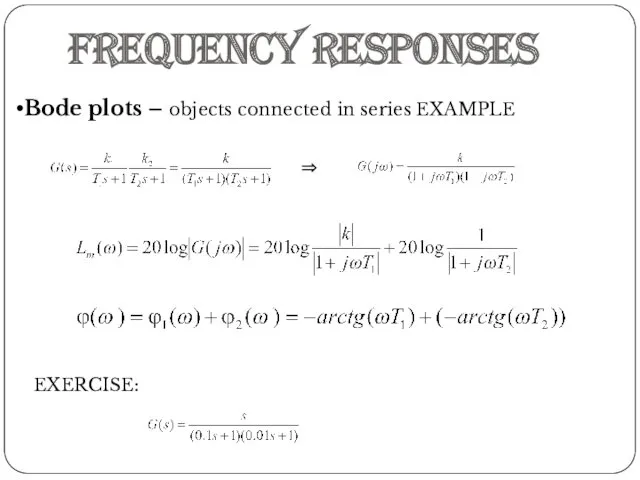
- 16. Frequency responses Bode plots – objects connected in series EXAMPLE ⇒ EXERCISE:
- 17. THANK YOU
- 19. Скачать презентацию
Impulse response
The impulse response of the system, denoted by g(t) is
Impulse response
The impulse response of the system, denoted by g(t) is
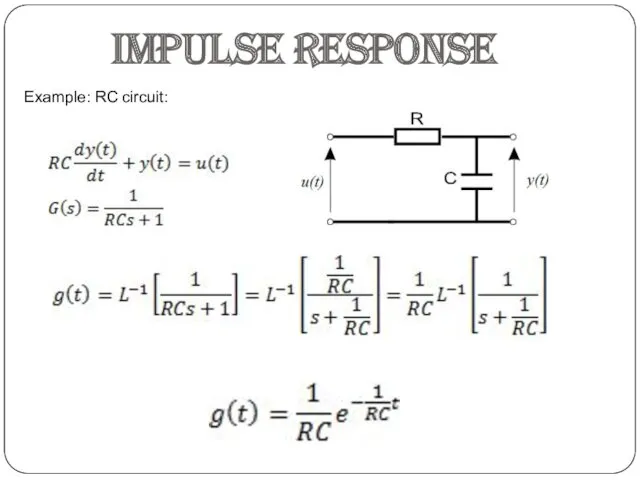
Example: RC circuit:
Impulse response
Example: RC circuit:
Impulse response
Step response
The step response of the system, denoted by h(t) is
Step response
The step response of the system, denoted by h(t) is
Example: RC circuit:
Step response
After partial fractions decomposition :
Initial and final value
Example: RC circuit:
Step response
After partial fractions decomposition :
Initial and final value
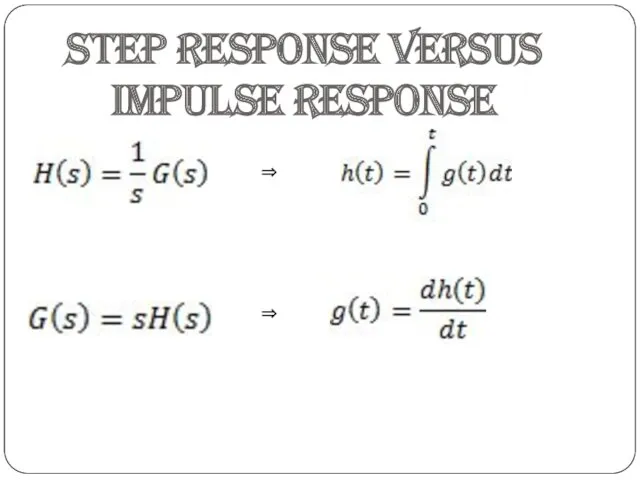
Step response versus impulse response
⇒
⇒
Step response versus impulse response
⇒
⇒
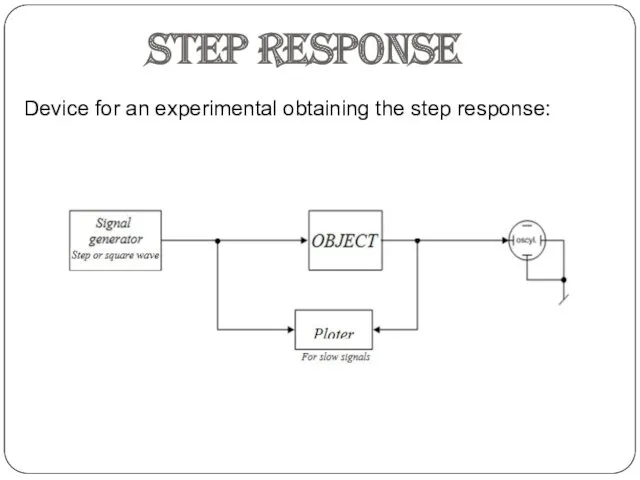
Device for an experimental obtaining the step response:
Step response
Device for an experimental obtaining the step response:
Step response
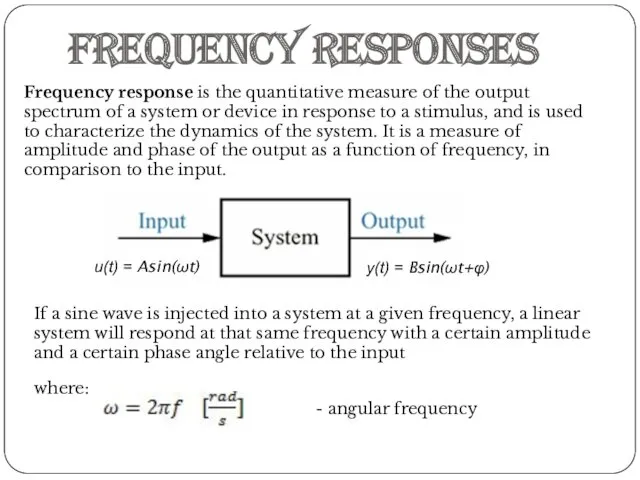
Frequency response is the quantitative measure of the output spectrum of
Frequency response is the quantitative measure of the output spectrum of
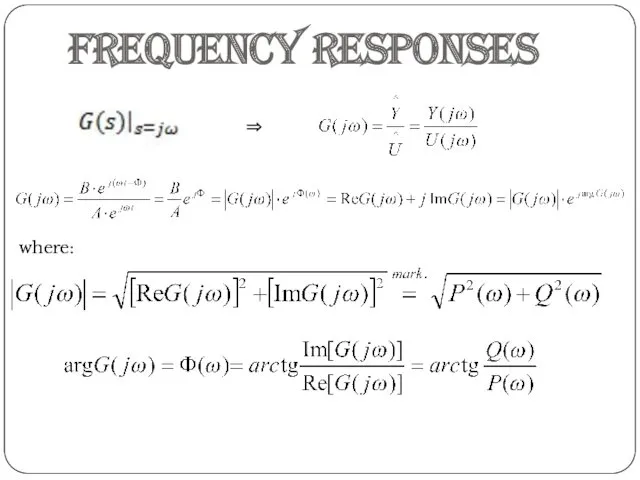
Frequency responses
⇒
where:
Frequency responses
⇒
where:
Frequency responses
Nyquist plot - the graph of the frequency respons with
Frequency responses
Nyquist plot - the graph of the frequency respons with
Frequency responses
Nyquist plot - EXAMPLE
⇒
Frequency responses
Nyquist plot - EXAMPLE
⇒
Frequency responses
Bode plots - present the frequency characteristics separetely in the
Frequency responses
Bode plots - present the frequency characteristics separetely in the
Frequency responses
Bode plots - EXAMPLE
⇒
Frequency responses
Bode plots - EXAMPLE
⇒
Frequency responses
Device for an experimental obtaining the frequency response characteristics:
Frequency responses
Device for an experimental obtaining the frequency response characteristics:
Frequency responses
Bode plots – objects connected in series
magnitude plot:
phase plot:
Frequency responses
Bode plots – objects connected in series
magnitude plot:
phase plot:
Frequency responses
Bode plots – objects connected in series EXAMPLE
⇒
EXERCISE:
Frequency responses
Bode plots – objects connected in series EXAMPLE
⇒
EXERCISE:

THANK YOU
THANK YOU
 Криминальные субкультуры
 Образование и развитие Московского государства в XV – XVII вв. Занятие 2
 Мой профсоюз
 Моя малая родина
 Пилотный проект Прямые выплаты
 Самоуплотняющийся бетон
 Известные и малоизвестные имена в краеведении Витебского края: от истоков до современности
 Управление персоналом в социальной сфере
 Групповые формы работы как средство реализации системно – деятельностного подхода на уроках биологии
 Модель организации методической работы в муниципальном общеобразовательном учреждении Барашевская средняя общеобразовательная школа
 Анализ объема продаж и выявление влияния факторов на его изменение
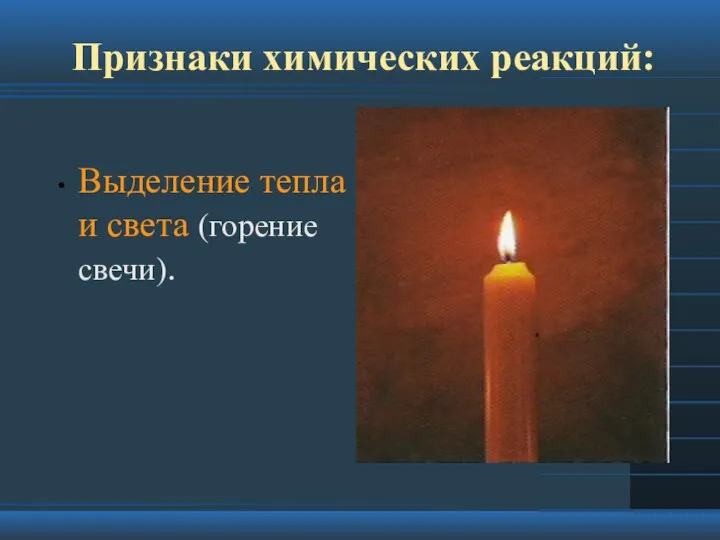 Признаки химических реакций. Реакции обмена.
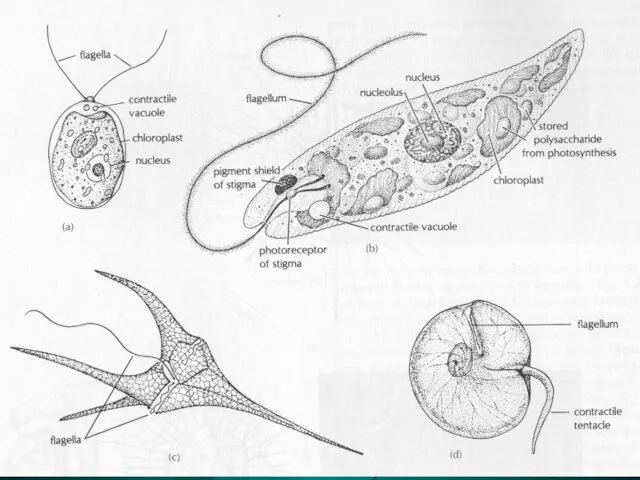 Ряд dinoflagellida. Панцирні прісноводні і морські планктонні джгутикові
 Жилой комплекс Алатау
 Международные экологические и природоохранные конференции и организации
 Открытое занятие Берём интервью
 Гормоны
 Воспитательная компонента на уроках ИЗО и Технологии.
 Наука, философия и методология науки 19 века
 Гломерулонефрит у детей
 Сестринский процесс при хроническом энтероколите
 Небесное и земное в звуках и красках
 Однофазный асинхронный двигатель. Пуск и реверс однофазного асинхронного двилателя
 Заглавная буква в словах
 Металлургия редких металлов. Вольфрам. Технология производства вольфрама
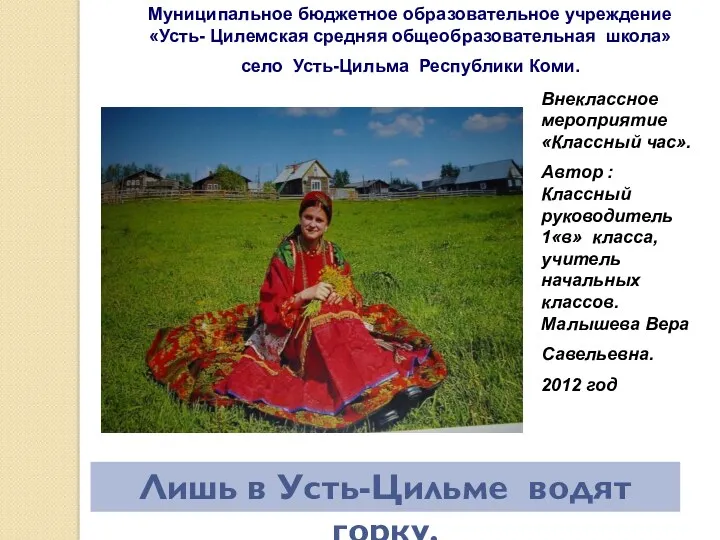 Мой край . ПрезентацияЛишь в Усть-Цильме водят горку.
 25
25 Культура 17-18 веков