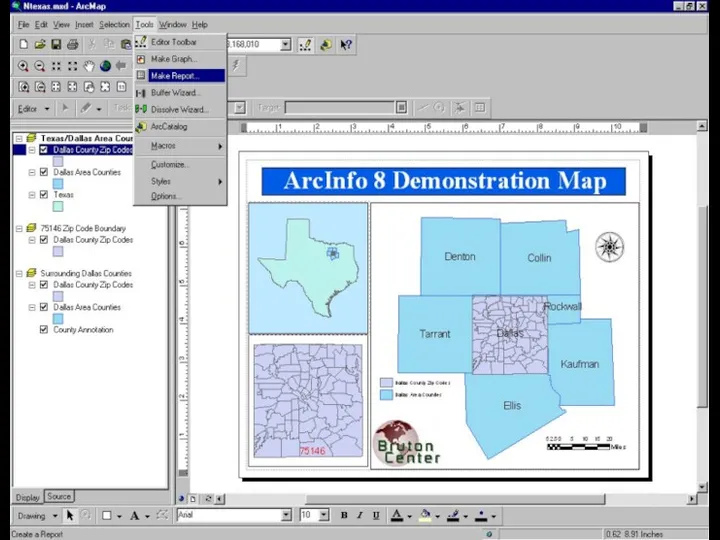
- Introduction To ArcMap

Содержание
- 2. ArcMap is a Map-centric GUI tool used to perform map-based tasks Mapping Create maps by working
- 3. Analyze Visualize information See patterns Reveal hidden trends Show relationships between features Solve problems Where is
- 4. ArcMap Is both a data editor as well as map generator Provides two different ways to
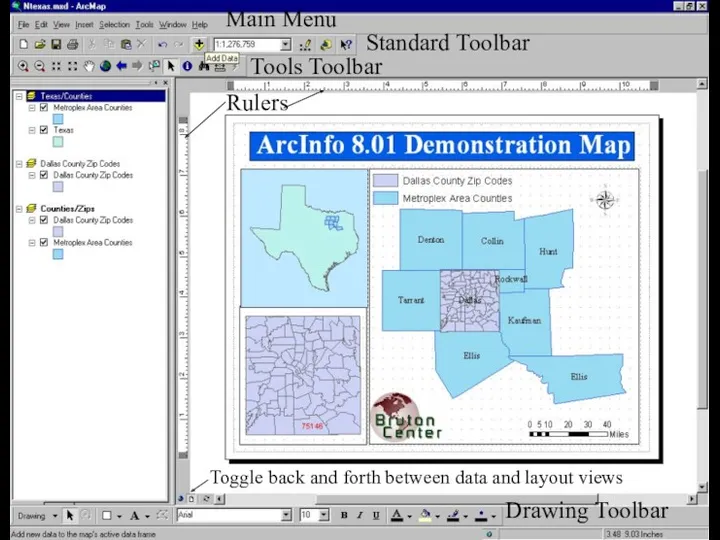
- 5. Navigating Around the Map Main Menu Toolbars Standard Tools Drawing Utility Network Analysis Editor Layout Effects
- 6. Main Menu Standard Toolbar Tools Toolbar Drawing Toolbar Toggle back and forth between data and layout
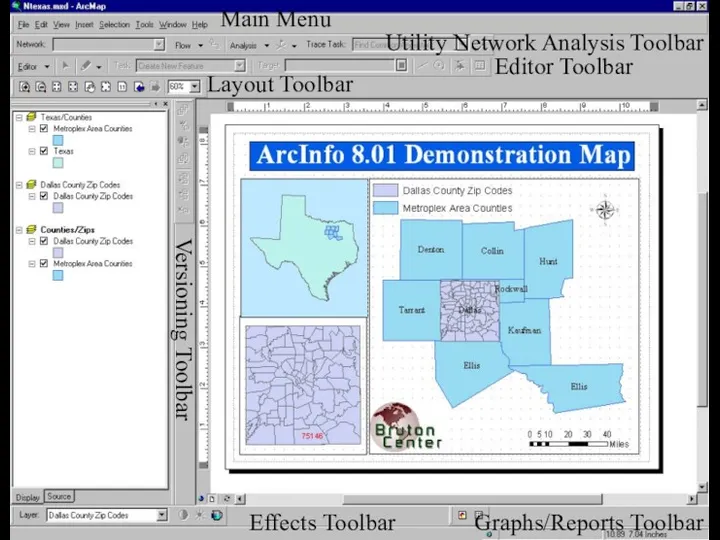
- 7. Main Menu Layout Toolbar Editor Toolbar Effects Toolbar Graphs/Reports Toolbar Utility Network Analysis Toolbar Versioning Toolbar
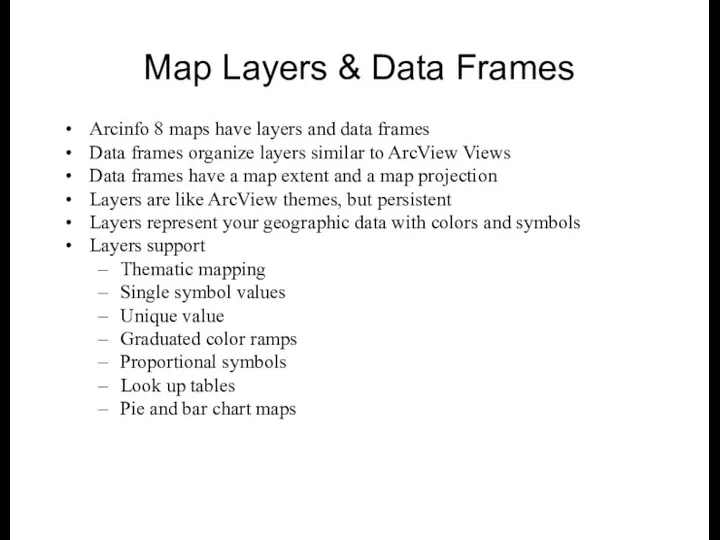
- 8. Map Layers & Data Frames Arcinfo 8 maps have layers and data frames Data frames organize
- 9. Layers A layer defines how to display the geographic data it references. When you add a
- 10. Managing Layers in ArcMap In ArcMap you can… Change a layers’s text description Change a layer’s
- 11. Active Data Frame Data Frames Layers
- 12. Map Data Sources
- 13. Inserting Map Elements ArcMap makes it easy to add………… Titles Legends North arrows Scale bars Scale
- 14. Picture Scale Bar North Arrow Legend Title Text
- 15. Labeling Map Features Labels are text on a map that provides additional information about a feature
- 17. Managing Annotation Annotation refers to the process of automating text placement OR to the text itself
- 18. Geodatabase Annotation Annotation can be created for feature classes in the geodatabase Stored in annotation classes
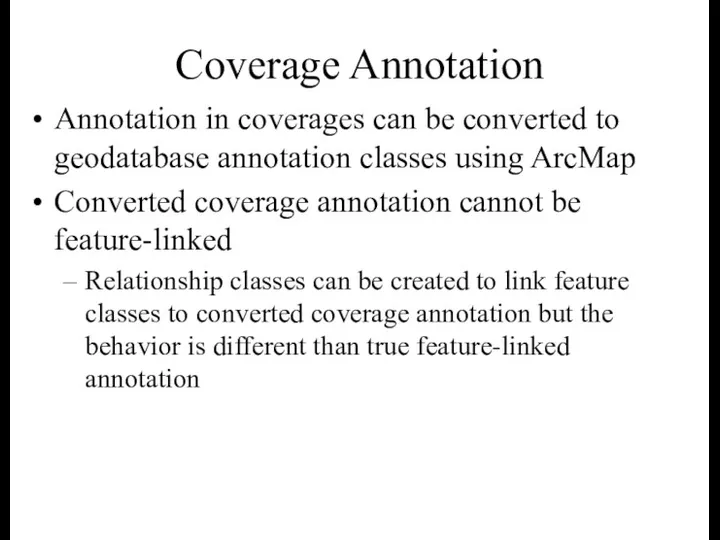
- 19. Coverage Annotation Annotation in coverages can be converted to geodatabase annotation classes using ArcMap Converted coverage
- 20. Relationship Class Annotation Class
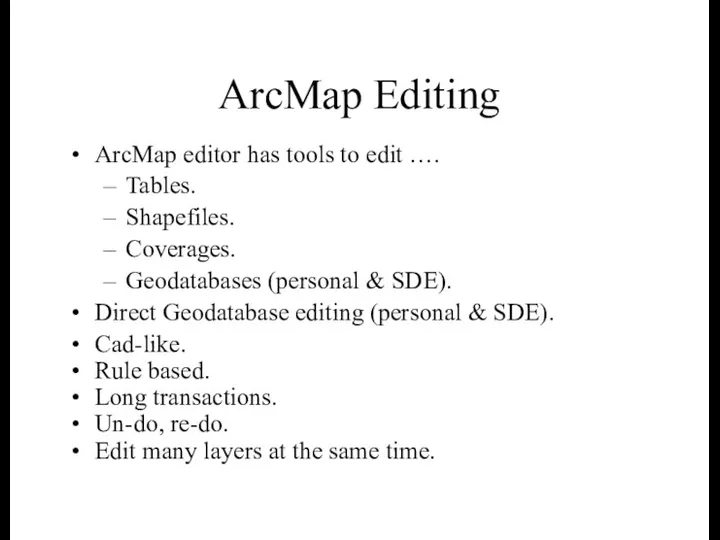
- 21. ArcMap Editing ArcMap editor has tools to edit …. Tables. Shapefiles. Coverages. Geodatabases (personal & SDE).
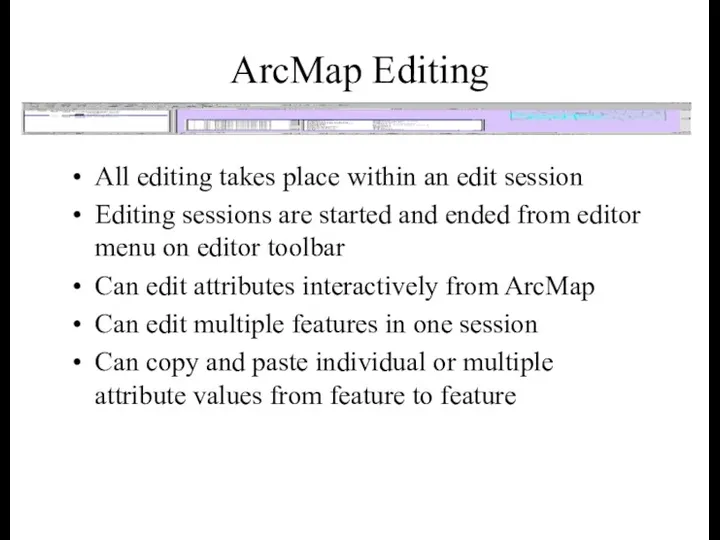
- 22. ArcMap Editing All editing takes place within an edit session Editing sessions are started and ended
- 23. Edit Session Commands Tool Palette for creating a sketch Current Task Target Layer Attributes Button
- 24. Open Attribute Table
- 25. Right-Click & Zoom
- 26. Selecting Multiple Features to Edit
- 27. Select Multiple Features Open Attribute Table for Selected Features
- 28. Spatial Bookmarks Pan or Zoom to area within Data Frame From View Menu Goto Bookmarks Type
- 29. Spatial Bookmarks using View Menu
- 30. Spatial Bookmarks using “Find” Tool
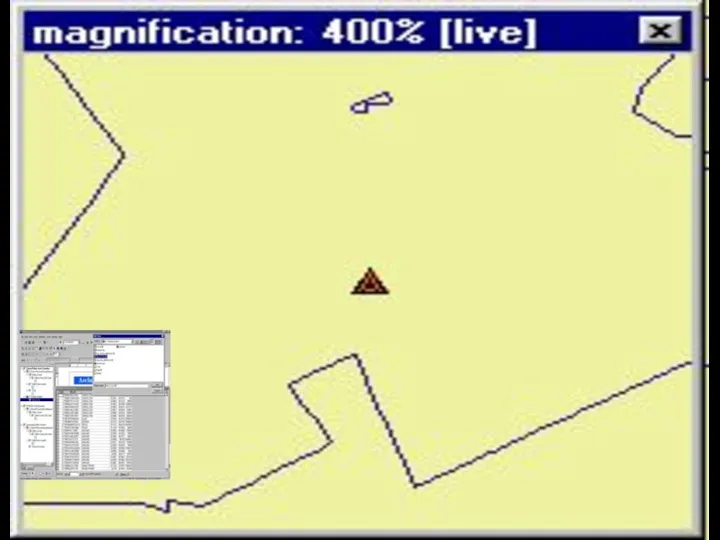
- 31. Overview & Magnification Windows In data view only, instead of repositioning you can open……… Magnifier window.
- 33. Working with Tables in ArcMap Tables – used in ArcMap to inspect attributes of geographic features
- 34. Working with Tables in ArcMap Add tables to maps Organize Freeze/unfreeze columns Rearrange & resize columns
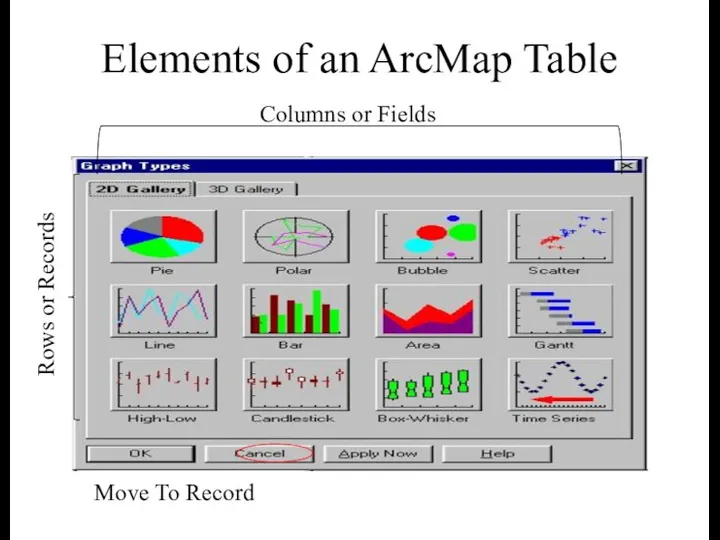
- 35. Elements of an ArcMap Table Rows or Records Columns or Fields Move To Record
- 36. Opening Tables
- 37. Select by Attribute
- 39. Adding Tables to Maps
- 40. Graphs & Reports Graphs & Reports Present information about map features and their relationships Graphs Present
- 41. Graphs Area Bar Box-whisker Bubble Candlestick Gantt High-Low-Close Line Pie Polar Scatter Surface Time Series
- 42. Reports A report presents tabular information about features on the map formatted in an attractive manner.
- 46. Скачать презентацию
ArcMap is a Map-centric GUI tool used to perform map-based tasks
Mapping
Create
ArcMap is a Map-centric GUI tool used to perform map-based tasks
Mapping
Create
Analyze
Visualize information
See patterns
Reveal hidden trends
Show relationships between features
Solve problems
Where is
How
Analyze
Visualize information
See patterns
Reveal hidden trends
Show relationships between features
Solve problems
Where is
How
ArcMap
Is both a data editor as well as map generator
Provides two
ArcMap
Is both a data editor as well as map generator
Provides two
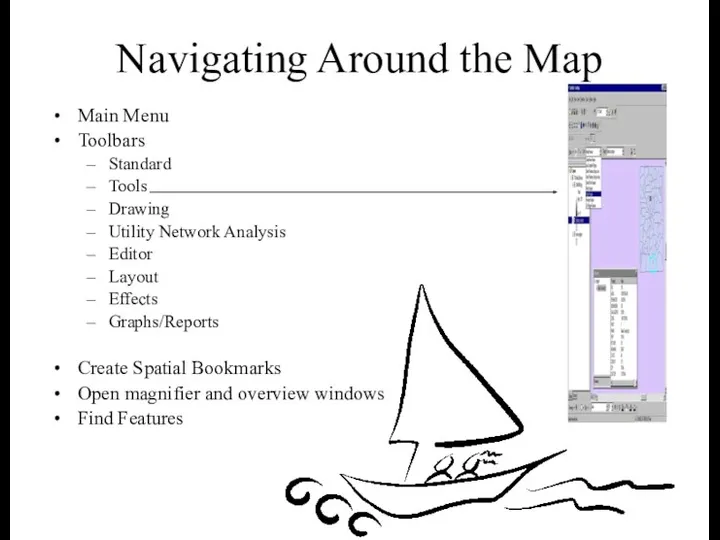
Navigating Around the Map
Main Menu
Toolbars
Standard
Tools
Drawing
Utility Network Analysis
Editor
Layout
Effects
Graphs/Reports
Create Spatial Bookmarks
Open magnifier and
Navigating Around the Map
Main Menu
Toolbars
Standard
Tools
Drawing
Utility Network Analysis
Editor
Layout
Effects
Graphs/Reports
Create Spatial Bookmarks
Open magnifier and
Main Menu
Standard Toolbar
Tools Toolbar
Drawing Toolbar
Toggle back and forth between data and
Main Menu
Standard Toolbar
Tools Toolbar
Drawing Toolbar
Toggle back and forth between data and
Main Menu
Layout Toolbar
Editor Toolbar
Effects Toolbar
Graphs/Reports Toolbar
Utility Network Analysis Toolbar
Versioning Toolbar
Main Menu
Layout Toolbar
Editor Toolbar
Effects Toolbar
Graphs/Reports Toolbar
Utility Network Analysis Toolbar
Versioning Toolbar
Map Layers & Data Frames
Arcinfo 8 maps have layers and data
Map Layers & Data Frames
Arcinfo 8 maps have layers and data
Layers
A layer defines how to display the geographic data it references.
When
Layers
A layer defines how to display the geographic data it references.
When
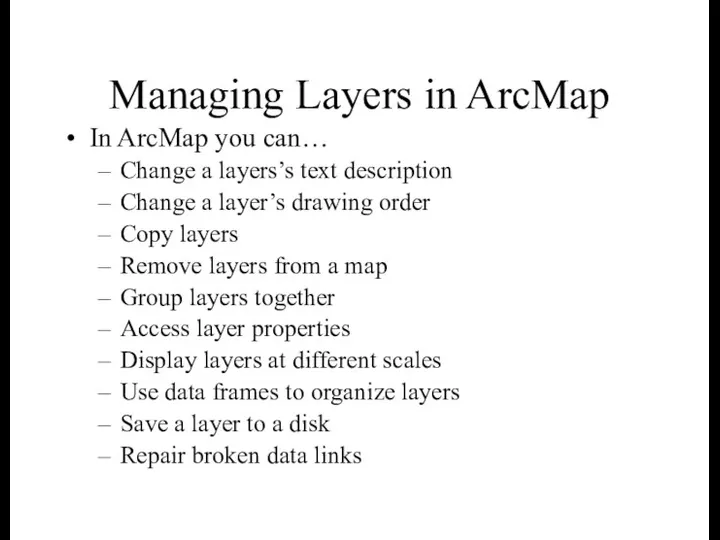
Managing Layers in ArcMap
In ArcMap you can…
Change a layers’s text description
Change
Managing Layers in ArcMap
In ArcMap you can…
Change a layers’s text description
Change
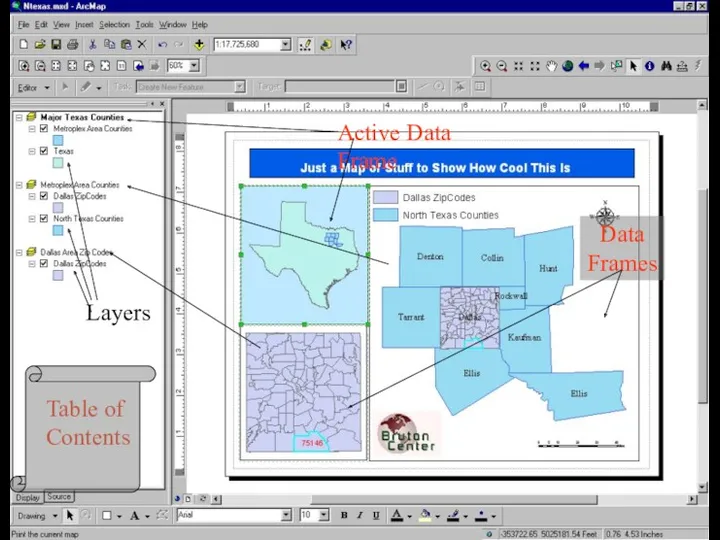
Active Data Frame
Data
Frames
Layers
Active Data Frame
Data
Frames
Layers
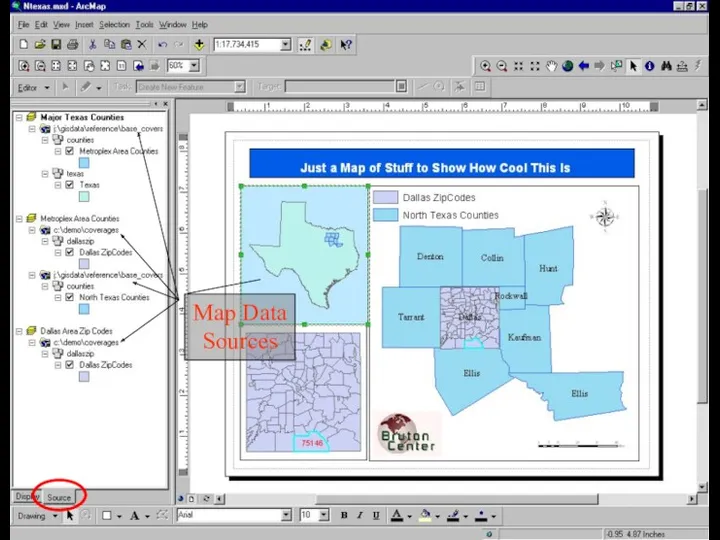
Map Data Sources
Map Data Sources
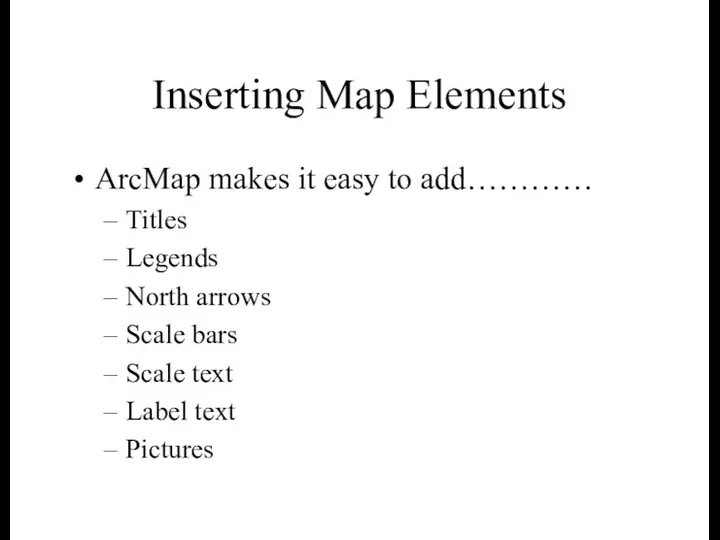
Inserting Map Elements
ArcMap makes it easy to add…………
Titles
Legends
North arrows
Scale bars
Scale text
Label
Inserting Map Elements
ArcMap makes it easy to add…………
Titles
Legends
North arrows
Scale bars
Scale text
Label
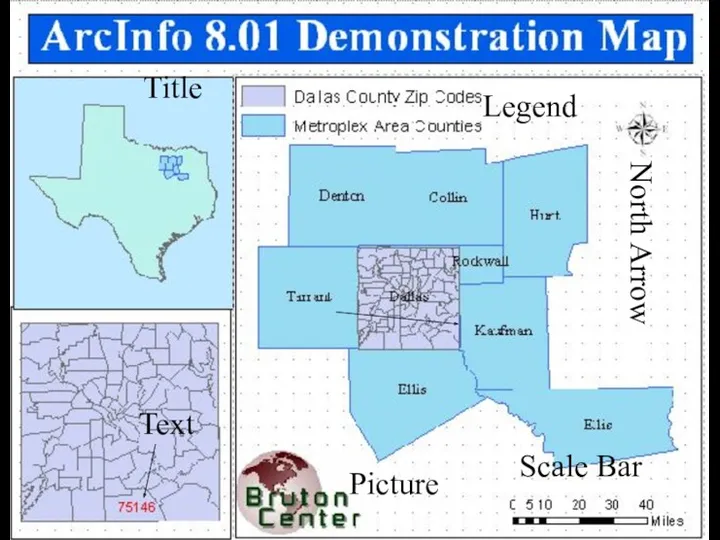
Picture
Scale Bar
North Arrow
Legend
Title
Text
Picture
Scale Bar
North Arrow
Legend
Title
Text
Labeling Map Features
Labels are text on a map that provides additional
Labeling Map Features
Labels are text on a map that provides additional

Managing Annotation
Annotation refers to the process of automating text placement OR
Managing Annotation
Annotation refers to the process of automating text placement OR
Geodatabase Annotation
Annotation can be created for feature classes in the geodatabase
Stored
Geodatabase Annotation
Annotation can be created for feature classes in the geodatabase
Stored
Coverage Annotation
Annotation in coverages can be converted to geodatabase annotation classes
Coverage Annotation
Annotation in coverages can be converted to geodatabase annotation classes
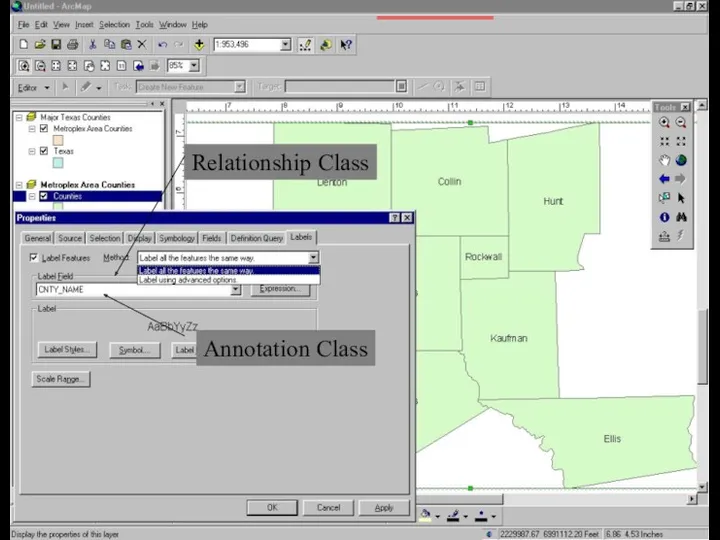
Relationship Class
Annotation Class
Relationship Class
Annotation Class
ArcMap Editing
ArcMap editor has tools to edit ….
Tables.
Shapefiles.
Coverages.
Geodatabases (personal & SDE).
Direct
ArcMap Editing
ArcMap editor has tools to edit ….
Tables.
Shapefiles.
Coverages.
Geodatabases (personal & SDE).
Direct
ArcMap Editing
All editing takes place within an edit session
Editing sessions
ArcMap Editing
All editing takes place within an edit session
Editing sessions
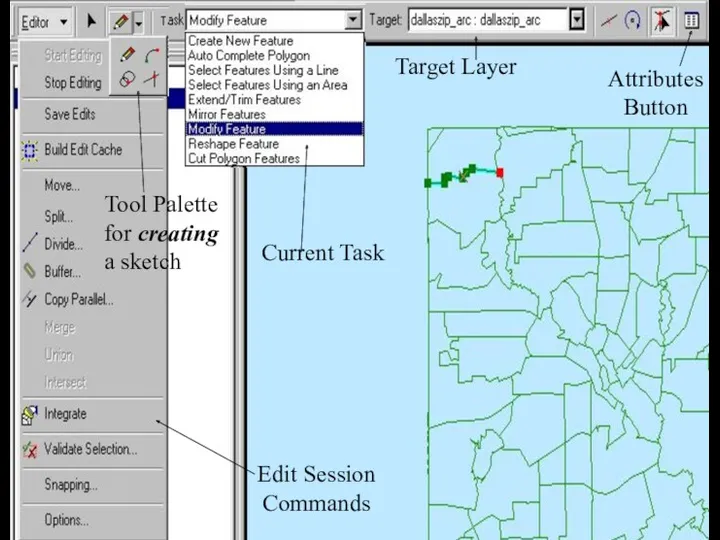
Edit Session
Commands
Tool Palette
for creating
a sketch
Current Task
Target Layer
Attributes
Button
Edit Session
Commands
Tool Palette
for creating
a sketch
Current Task
Target Layer
Attributes
Button
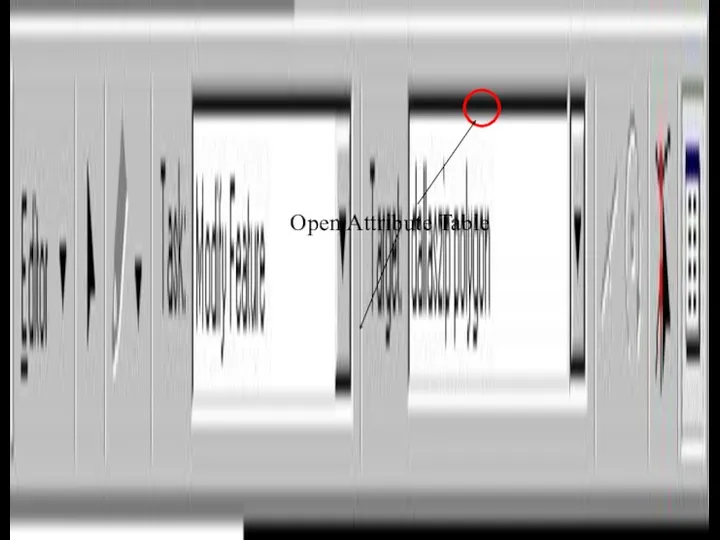
Open Attribute Table
Open Attribute Table
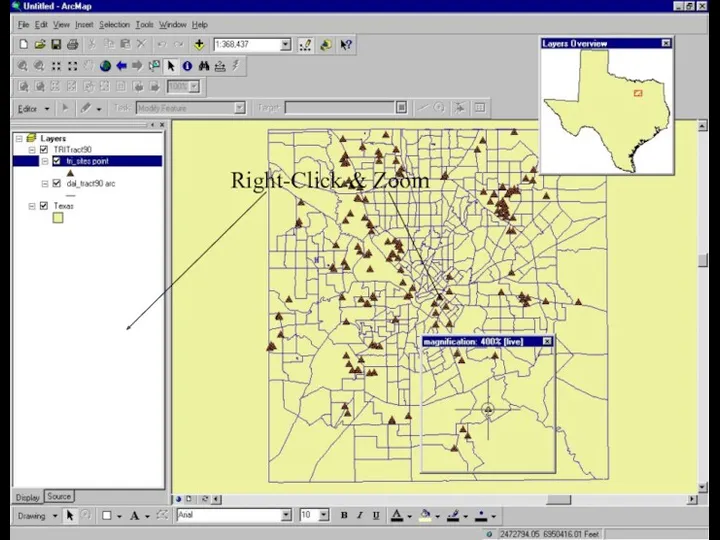
Right-Click & Zoom
Right-Click & Zoom
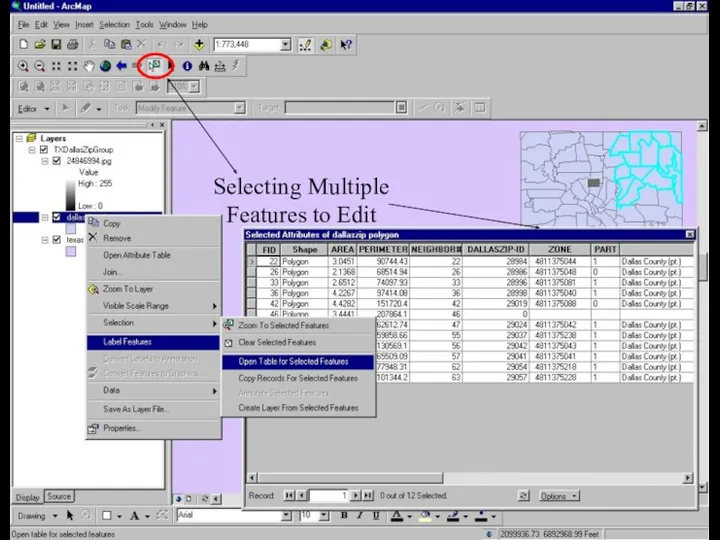
Selecting Multiple
Features to Edit
Selecting Multiple
Features to Edit
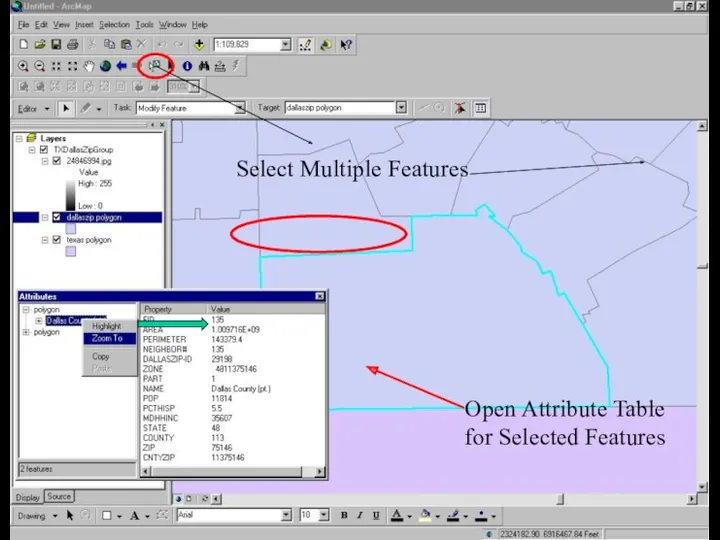
Select Multiple Features
Open Attribute Table
for Selected Features
Select Multiple Features
Open Attribute Table
for Selected Features
Spatial Bookmarks
Pan or Zoom to area within Data Frame
From View Menu
Goto
Spatial Bookmarks
Pan or Zoom to area within Data Frame
From View Menu
Goto
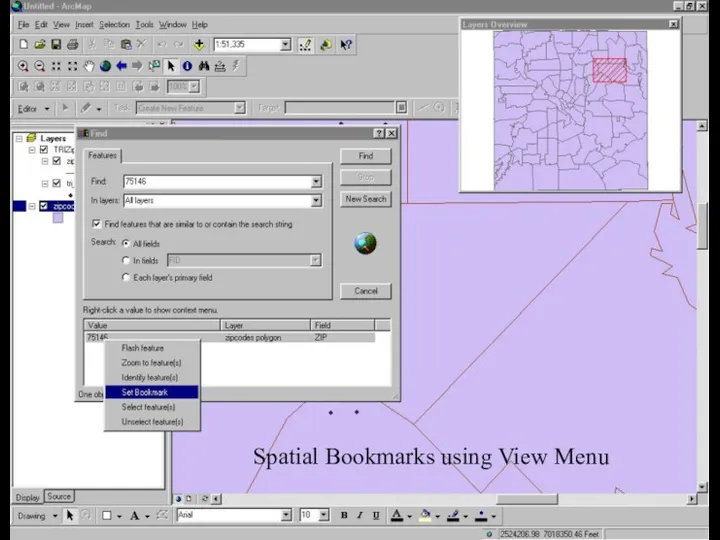
Spatial Bookmarks using View Menu
Spatial Bookmarks using View Menu
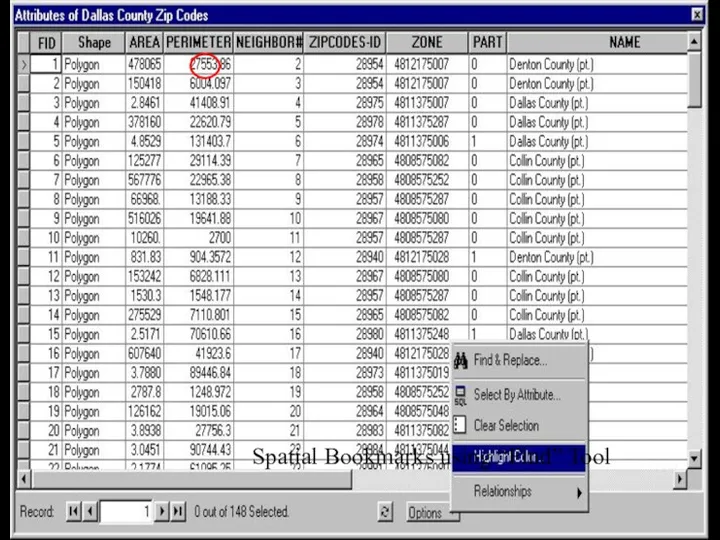
Spatial Bookmarks using “Find” Tool
Spatial Bookmarks using “Find” Tool
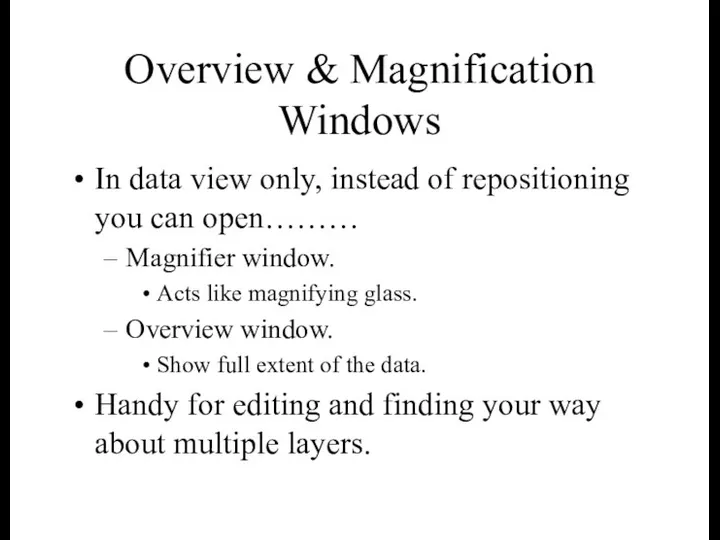
Overview & Magnification Windows
In data view only, instead of repositioning you
Overview & Magnification Windows
In data view only, instead of repositioning you
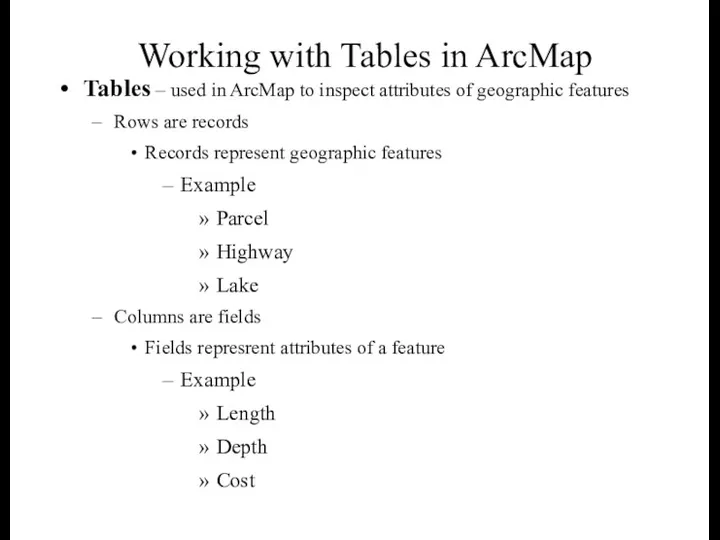
Working with Tables in ArcMap
Tables – used in ArcMap to inspect
Working with Tables in ArcMap
Tables – used in ArcMap to inspect
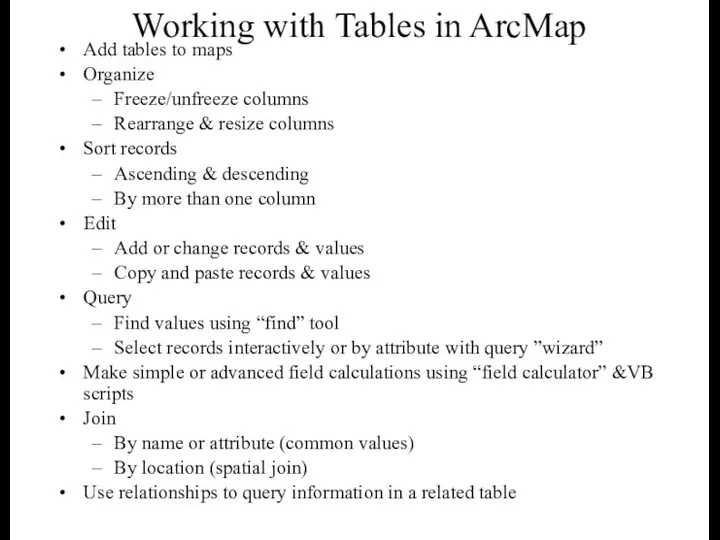
Working with Tables in ArcMap
Add tables to maps
Organize
Freeze/unfreeze columns
Rearrange & resize
Working with Tables in ArcMap
Add tables to maps
Organize
Freeze/unfreeze columns
Rearrange & resize
Elements of an ArcMap Table
Rows or Records
Columns or Fields
Move To Record
Elements of an ArcMap Table
Rows or Records
Columns or Fields
Move To Record
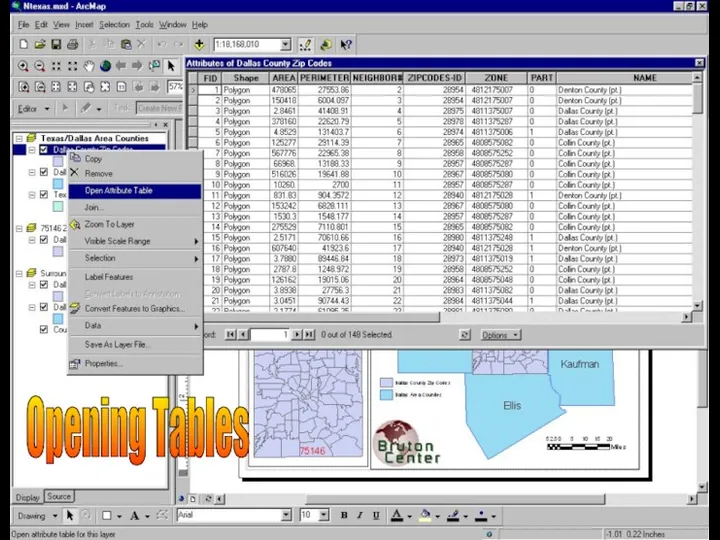
Opening Tables
Opening Tables
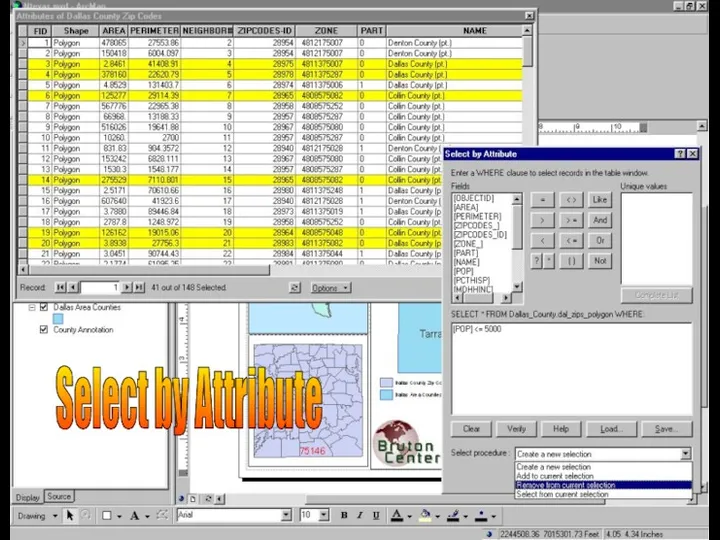
Select by Attribute
Select by Attribute
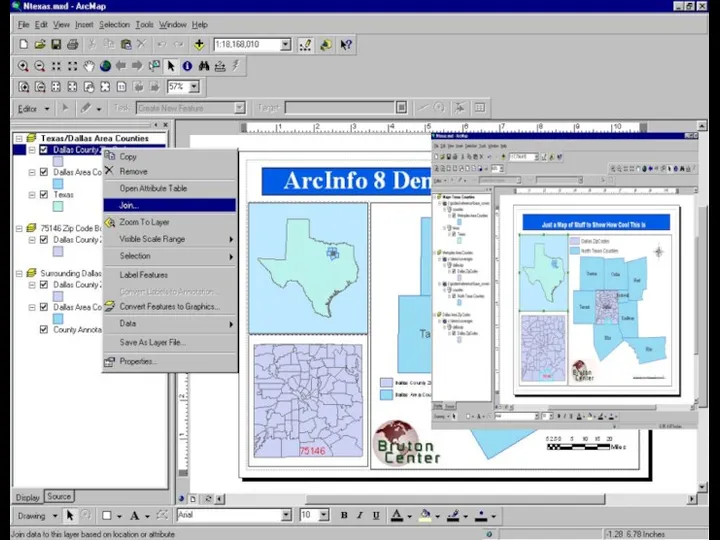
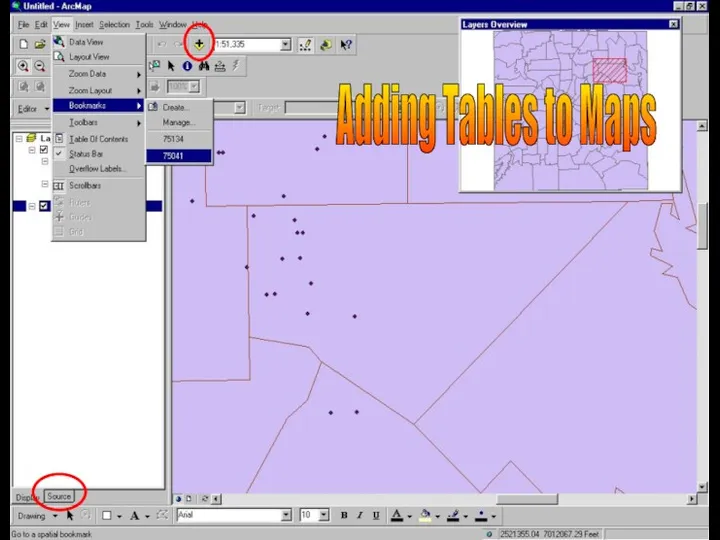
Adding Tables to Maps
Adding Tables to Maps
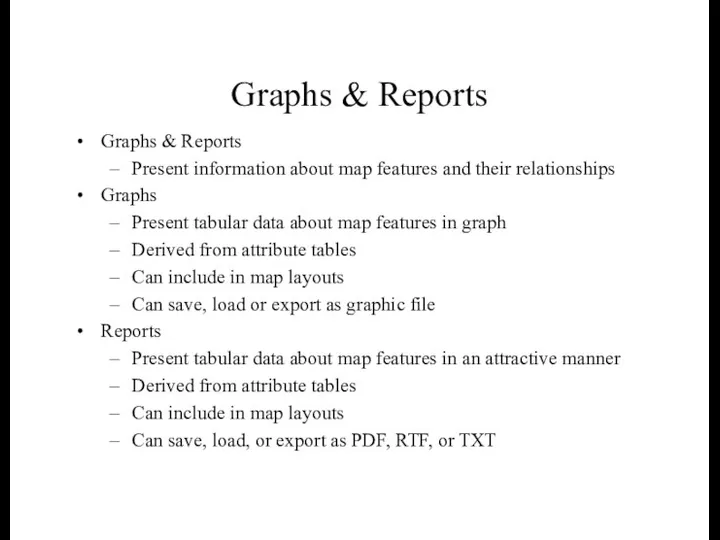
Graphs & Reports
Graphs & Reports
Present information about map features and
Graphs & Reports
Graphs & Reports
Present information about map features and
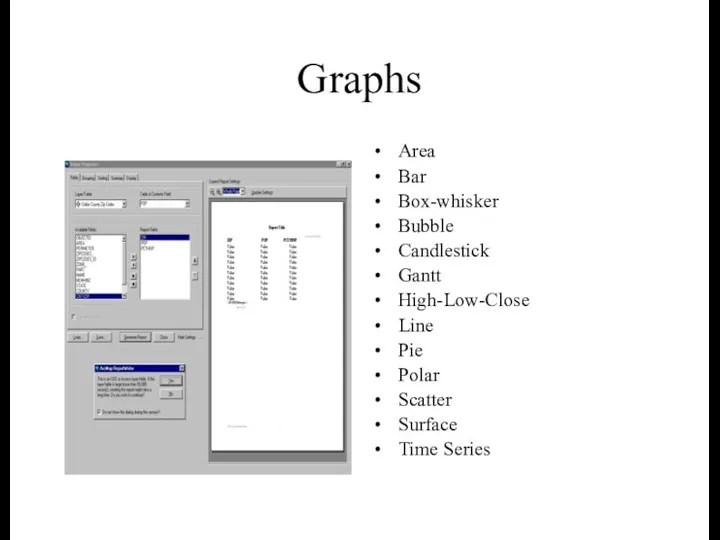
Graphs
Area
Bar
Box-whisker
Bubble
Candlestick
Gantt
High-Low-Close
Line
Pie
Polar
Scatter
Surface
Time Series
Graphs
Area
Bar
Box-whisker
Bubble
Candlestick
Gantt
High-Low-Close
Line
Pie
Polar
Scatter
Surface
Time Series
Reports
A report presents tabular information about features on the map formatted
Reports
A report presents tabular information about features on the map formatted

 Интегральные микросхемы
 Минеральные ресурсы России. 8 класс
 Последовательность предложений в тексте
 Положение металлов в Периодической системе Д.И. Менделеева. Особенности строения атомов, свойства. Цель и задачи урока: Форма урока: Методы и приёмы: Оборудование: ХОД УРОКА
 Готовимся к ЕГЭ. Раздел Лексика и грамматика
 Вероятность равновозможных событий
 Социальная философия. Общество, культура, цивилизация
 Семья под защитой закона
 f6bdee1fb40f0a6420bffc7982925e92
 Союзные и бессоюзные сложные предложения
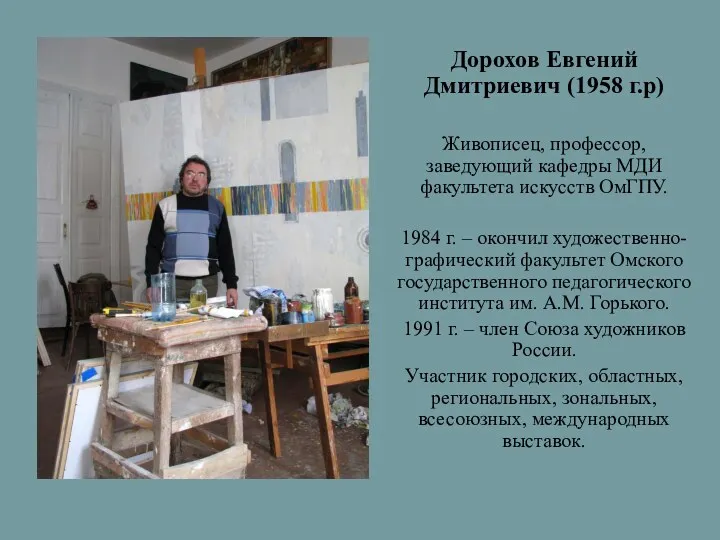 Дорохов Евгений Дмитриевич
 Капитальный ремонт подъездов. Колористические решения применяемых материалов
 Участие прокурора в суде первой инстанции по поддержанию обвинения по уголовному делу
 Спорт, здоровье, радость, смех – принесет во всем успех. Семейный проект
 Фосфор алмасу бұзылысының морфогенезі мен патологиялық анатомиясы: рахит, нефрогенді остеопатия, ренальді нанизм
 Фундаменти. Зовнішні і внутрішні стіни
 Техника безопасности при занятии физической культурой и спортом
 Радуга, федеральная аптечная сеть
 Геморрагический синдром у новорожденных детей
 Страны Латинской Америки
 Цветные металлы и сплавы
 Презентация по теме: Предмет химии. Вещества.
 Путешественники древности
 Презентация Рождество
 Евангелие от Марка 10:46-52
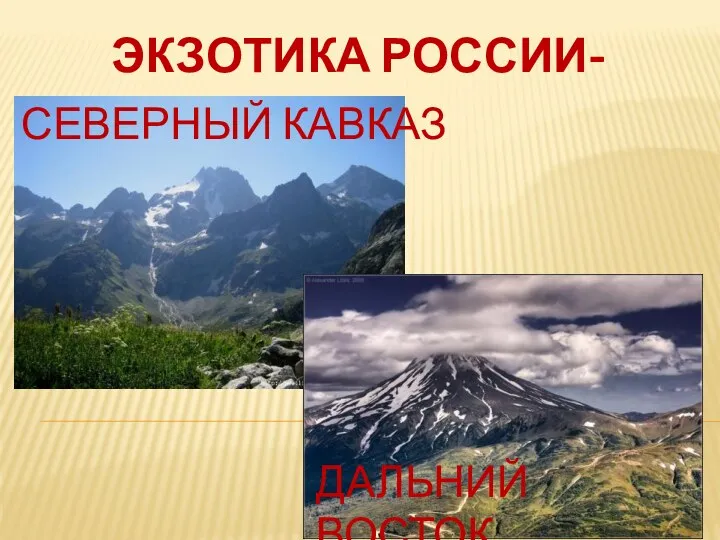 Экзотика России-Кавказ и Дальний Восток
 Классификация химических реакций
 Модель внеурочной деятельности в МБОУ ООШ пос.Прибрежный