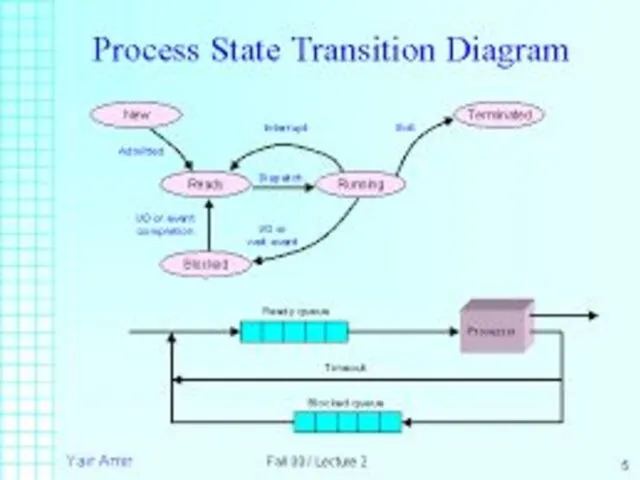
- State diagram of single component system

Содержание
- 2. Component - chemically recognizable species (Fe and C in carbon steel, H2O and NaCl in salted
- 3. A phase diagram - graphical representation of the combinations of temperature, pressure, composition, or other variables
- 4. Interpretation of Phase Diagrams For a given temperature and composition we can use phase diagram to
- 18. Скачать презентацию
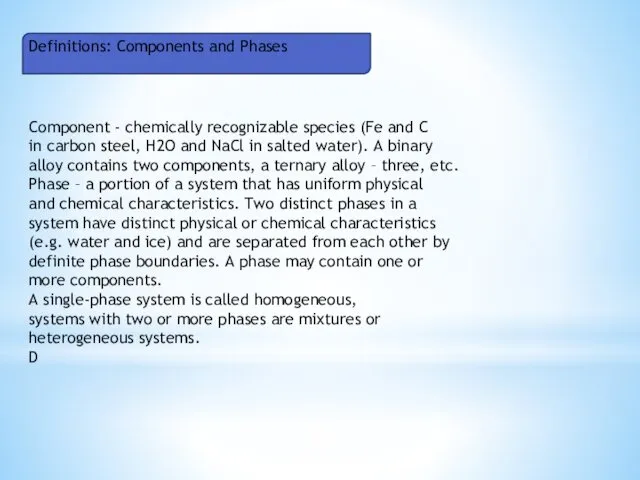
Component - chemically recognizable species (Fe and C
in carbon steel, H2O
Component - chemically recognizable species (Fe and C
in carbon steel, H2O
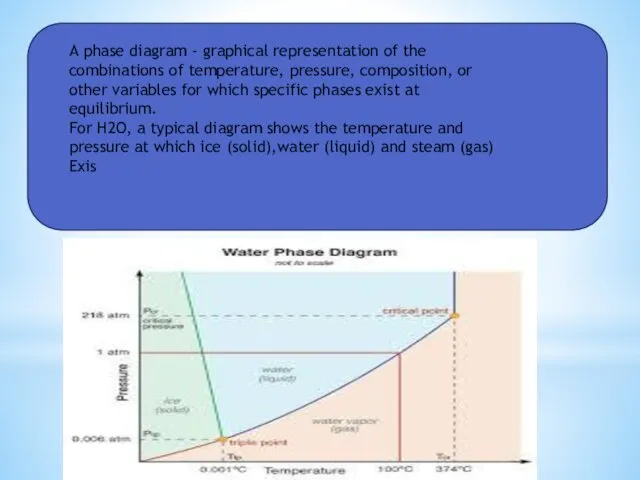
A phase diagram - graphical representation of the
combinations of temperature, pressure,
A phase diagram - graphical representation of the
combinations of temperature, pressure,
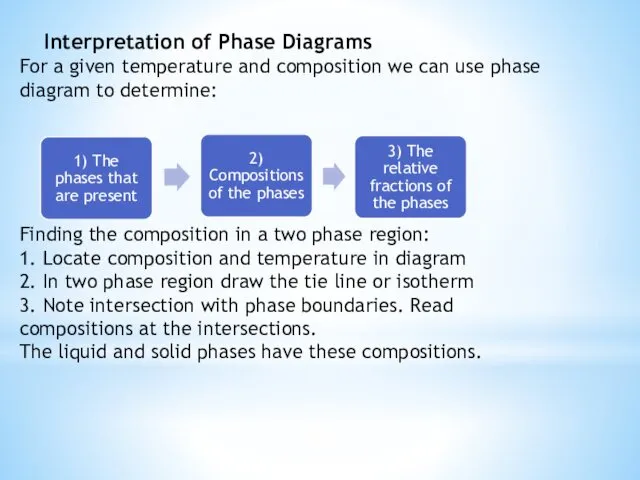
Interpretation of Phase Diagrams
For a given temperature and composition we can
Interpretation of Phase Diagrams
For a given temperature and composition we can

 Антисоциальные и криминальные молодежные группы
 Флористика. Изготовление плоскостных композиций из засушенных цветов, листьев, лепестков
 20230808_urok-sorevnovanie_8_fizika
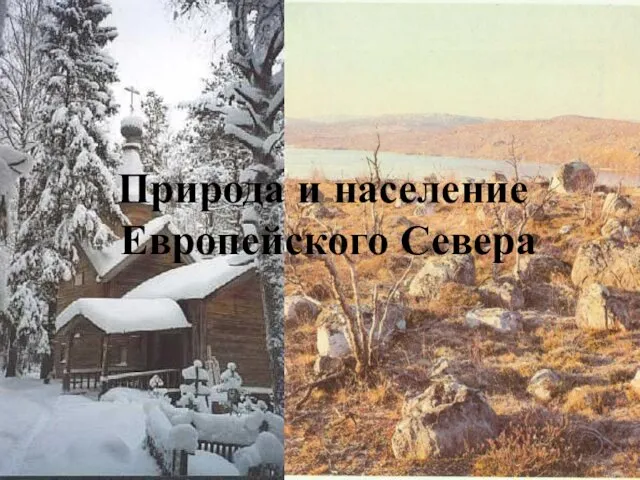 Природа и население Европейского Севера
 Робототехника. Fischertechnik - инструментарий для развития инженерных знаний и навыков учащихся, через игру
 Русская народная сказка Петух и собака. Урок чтения, 1 класс
 Лабораторные работы и методические рекомендации
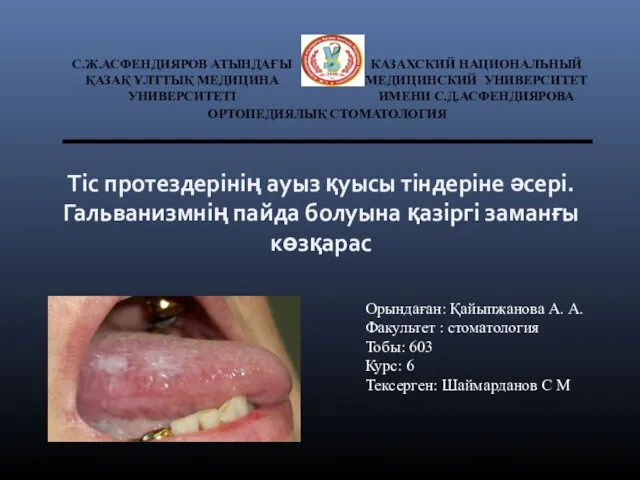 Тіс протездерін көтере алмау себептері
 Қазақстан республикасының мұнай – газ саласының қазіргі жағдайы
 Презентация Правовое воспитание
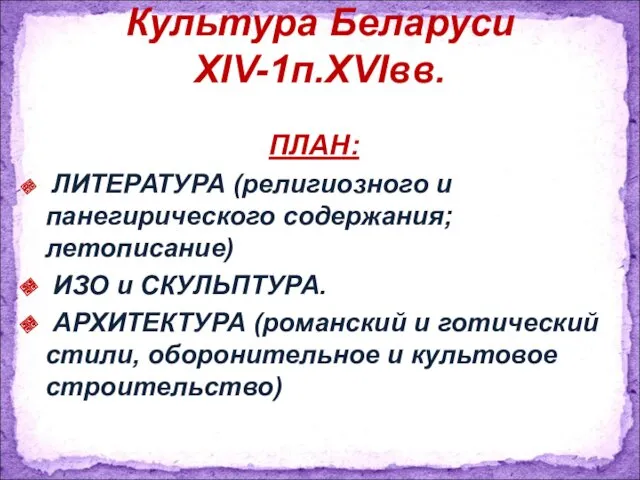 Культура Беларуси XIV-1п.XVI вв
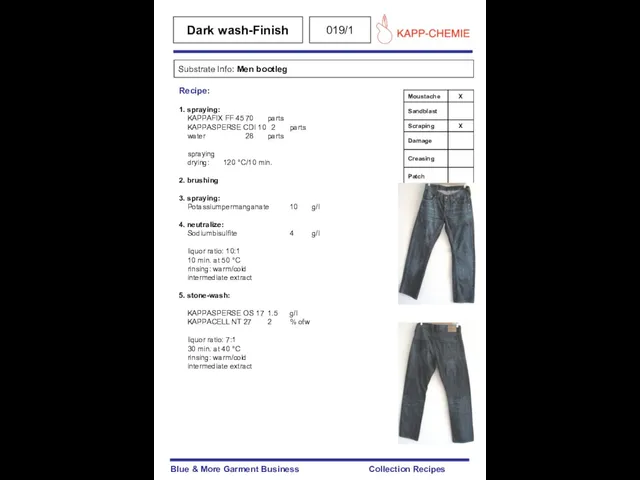 Dark wash-Finish
 Запуск стартапов и новые форматы школ для предпринимателей
 Производство колбас и колбасных изделий
 Пояснительная записка. Южная специализированная производственная база БЕ 2901
 Опыт работы по теме Деятельность классного руководителя по формированию нравственного поведения младших школьников
 Портфолио преподавателя информатики
 Термическая обработка сварных изделий
 Грозова енергетика
 Тромболитическая терапия
 Праздник Пасха.
 If I had a million dollars
 День 23 февраля
 Довольствование или довольство. Библейское основание управления финансами
 Стратегическая сессия ГК Гео-проект
 Аппликация, виды аппликации
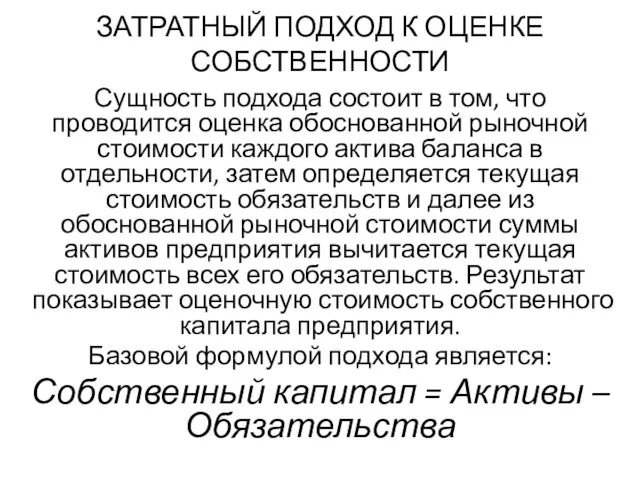 Затратный подход к оценке собственности
 Сім чудес України