- Total Sales Pipeline Overview for 2017

Содержание
- 2. SVC new acquisitions – zoom in Please complete up to top 5 hot customers and financial
- 3. SVC new acquisitions – zoom in Please complete top 5 hot customers
- 4. Existing customers (Account planning and up-sell opportunities) This slide seeks to focus on Existing customer account
- 5. Strengthening of the BD organization – Country X In order to be able to attract and
- 6. Ability to Win Customers “Health Scorecard” Area of focus for development: 7) Market study (s.w.o.t. analysis)
- 7. Ability to Win Customers “Health Scorecard” (continued) For red areas highlighted on previous slide, please highlight
- 9. Скачать презентацию
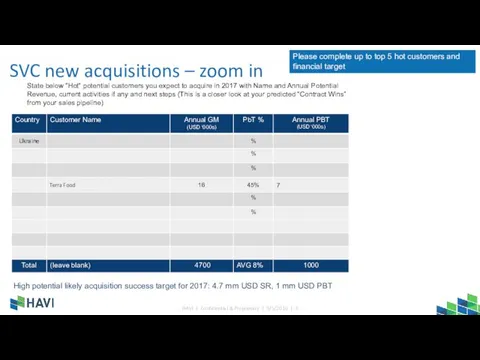
SVC new acquisitions – zoom in
Please complete up to top 5
SVC new acquisitions – zoom in
Please complete up to top 5
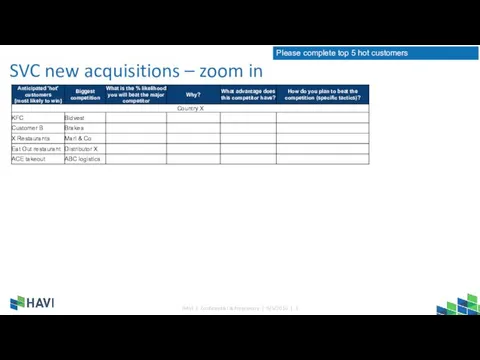
SVC new acquisitions – zoom in
Please complete top 5 hot customers
SVC new acquisitions – zoom in
Please complete top 5 hot customers

Existing customers
(Account planning and up-sell opportunities)
This slide seeks to focus
Existing customers
(Account planning and up-sell opportunities)
This slide seeks to focus
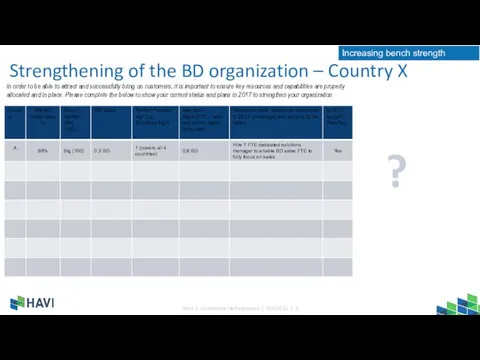
Strengthening of the BD organization – Country X
In order to be
Strengthening of the BD organization – Country X
In order to be

Ability to Win Customers “Health Scorecard”
Area of focus for development:
7) Market
Ability to Win Customers “Health Scorecard”
Area of focus for development:
7) Market

Ability to Win Customers “Health Scorecard” (continued)
For red areas highlighted on
Ability to Win Customers “Health Scorecard” (continued)
For red areas highlighted on
 2_Точечные операции
 Лёгочная гипертензия. Лёгочное сердце
 Международный опыт социального предпринимательства
 Environmental problems
 Концепция проекта: Серийное производство задвижек для нефтегазового сектора
 Тағамдық өнiмдердi сараптау мен оларды өңдеудiң технологиялық және гигиеналық негiздерi
 Конспект группового занятия Дифференциация А-Я Дифференциация букв А и Я в словах, словосочетаниях и предложениях.
 компетентность учителя
 Предметно-игровая развивающая среда как средство реализации образовательных областей в соответствии с ФГТ
 Презентация к уроку химии в 9 классе Металлы в организме человека
 Кружковая работа. Нравственно -патриотическое воспитание на тему Хлеб всему голова
 День космонавтики
 Линейная функция и её график. Урок 23
 Skanners & printers
 Финансовая система и финансовая политика
 Искусство любить детей
 Типология радиоканалов. Выразительные средства радио
 Презентация:Прогулка в лес
 Основные понятия. Принципы электрических измерений
 пословицы
 Хорошие поступки
 20231227_apk
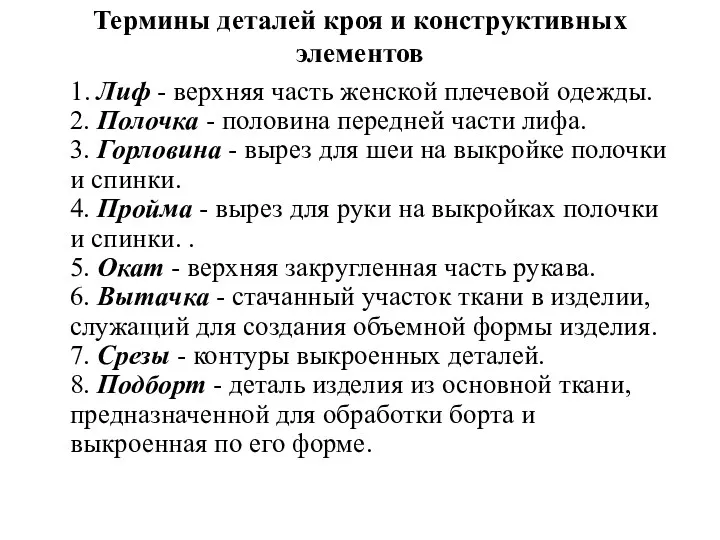 Термины деталей кроя и конструктивных элементов
 Внутренние воды России
 Коммерческое предложение от Укртелеком для ООО МЕД-СЕРВИС
 презентация к исследовательской работе по теме: Война глазами детей
 Призентация Амонашвили Шалва Александрович
 Сооружения и устройства железнодорожных станций