- Wide Area Monitoring System (WAMS) Application in Smart Grids

Содержание
- 2. Introduction This work contains developed methods for accelerated calculations of electrical modes in relation to the
- 3. 3rd REEPE 2021 International Youth Conference on Radio Electronics, Electrical and Power Engineering March 12, 2021
- 4. 3rd REEPE 2021 International Youth Conference on Radio Electronics, Electrical and Power Engineering March 12, 2021
- 6. Скачать презентацию
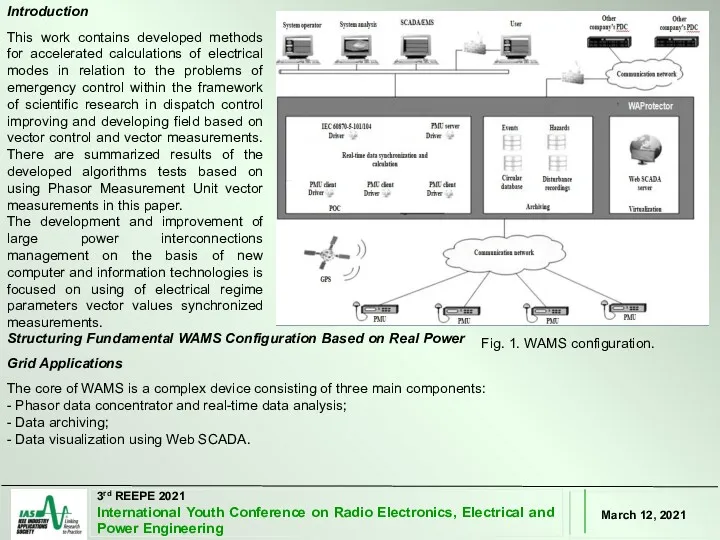
Introduction
This work contains developed methods for accelerated calculations of electrical modes
Introduction
This work contains developed methods for accelerated calculations of electrical modes
3rd REEPE 2021
International Youth Conference on Radio Electronics, Electrical and Power
3rd REEPE 2021
International Youth Conference on Radio Electronics, Electrical and Power
3rd REEPE 2021
International Youth Conference on Radio Electronics, Electrical and Power
3rd REEPE 2021
International Youth Conference on Radio Electronics, Electrical and Power
 Древесина – конструкционный материал
 Презентация История кружева
 Виды, способы и техника лепки в детском саду
 Методичская разработка открытого урока для специальности 230115 по дисциплине Основы программирования
 Использование перфокарт в работе с дошкольниками
 Ассоциация военно-патриотических клубов. ВПК Гвардия Иланский район
 ВКР: Техническое обслуживание электроприводов участка формовки трубы ТЭСЦ – 3
 О проведении Всероссийской олимпиады школьников по вопросам избирательного права и избирательного процесса
 Необычные растения и животные в природе.
 Вышивание крестиком Диск
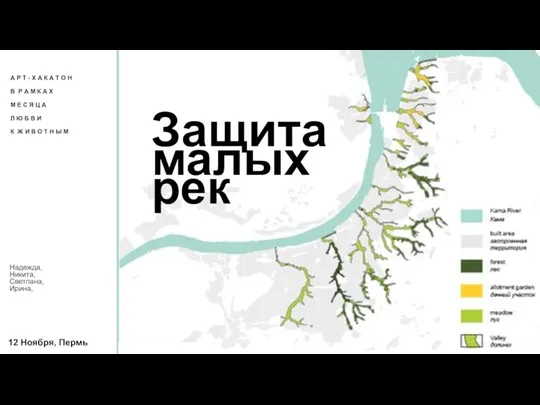 Защита малых рек
 Совершенствование логистических процессов на складах транспортного предприятия
 Презентации для урочной и внеурочной деятельности
 Презентация к уроку природоведения ПРИЗНАКИ ЖИВОТНЫХ 5 класс
 Humour toujours
 презентация 2 февраля-Сталинградская битва
 Трудовое право. Понятие, предмет и метод
 Игра 4 лишний
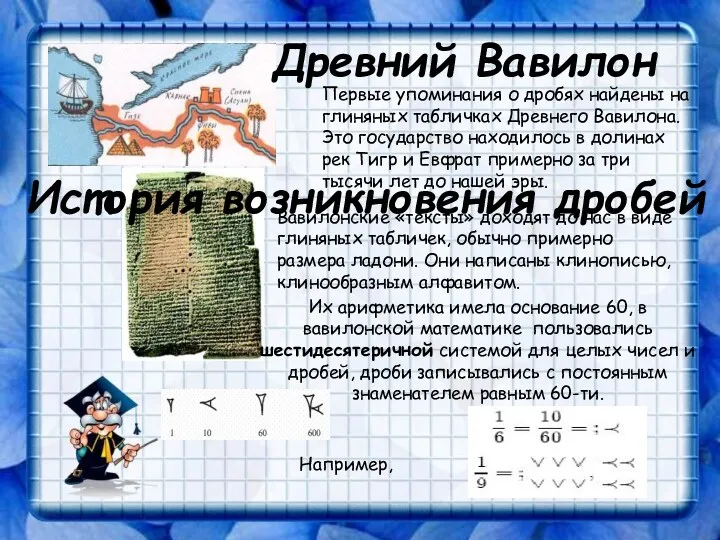 Конспект занятия математического кружка Старинные задачи на дроби
 Энергия от ветра
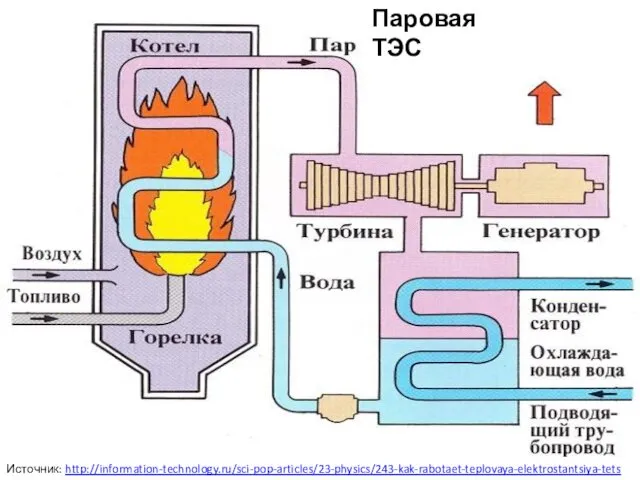 Паровая ТЭС
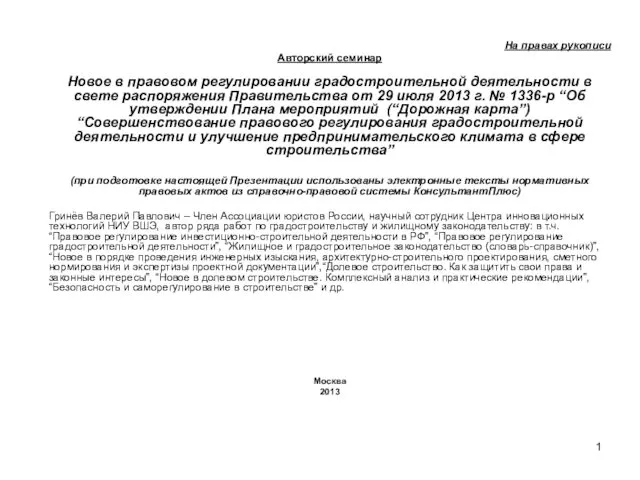 Новое в правовом регулировании градостроительной деятельности
 Суицид как форма девиантного поведения подростков
 Компьютерные вирусы
 Северная война (1700-1721)
 Микеланджело Буонарроти - краткая биография и картины
 Новая мотивация
 Моніторинг і коментарі до нормативно-правових актів у сфері оподаткування, грудень 2016 ч1