- Describing graphs

Содержание
- 2. Types Bar chart Line graph Pie chart Flow chart / process diagram / life cycle /
- 3. Structure Introduction: no numbers 1 sentence – give a general idea. What? Where? When? Paraphrase the
- 4. Structure - example Introduction: The bar chart shows average weekly spending by households in different areas
- 5. Some advice Don’t give any opinions (I think, I feel, as you can see, etc.) Separate
- 6. Tenses Present Simple Past Simple (in, between): It is clear that Italy had the older population
- 7. Language Use simple language and structures The graph shows = illustrates = compares Describe numbers Compare
- 8. Nouns of increase an upsurge in a surge of/in a boom in a jump in a
- 9. Verbs of increase boom rocket double/triple soar take off shoot up surge jump reach an all
- 10. Nouns of decrease a fall in a decrease in a decline in a drop in a
- 11. Verbs of decrease fall back go down decrease drop back decline slip stay the same/at the
- 12. Scale and Speed of Change static sluggish slack stagnant
- 13. Exercise The market is showing some signs of growth The market is extremely volatile The pound
- 15. Скачать презентацию
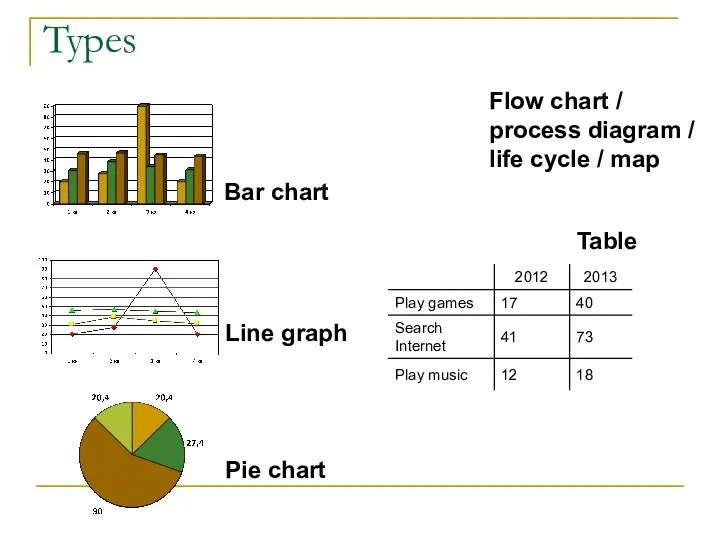
Types
Bar chart
Line graph
Pie chart
Flow chart /
process diagram /
life cycle / map
Table
Types
Bar chart
Line graph
Pie chart
Flow chart /
process diagram /
life cycle / map
Table
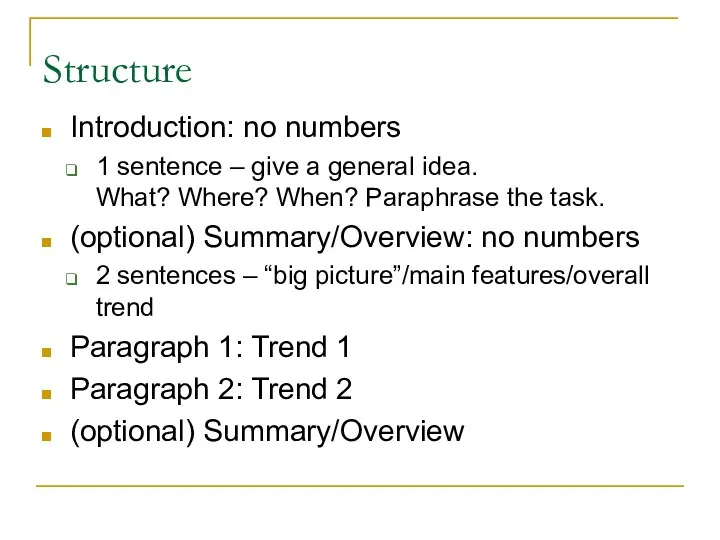
Structure
Introduction: no numbers
1 sentence – give a general idea.
What? Where? When?
Structure
Introduction: no numbers
1 sentence – give a general idea.
What? Where? When?
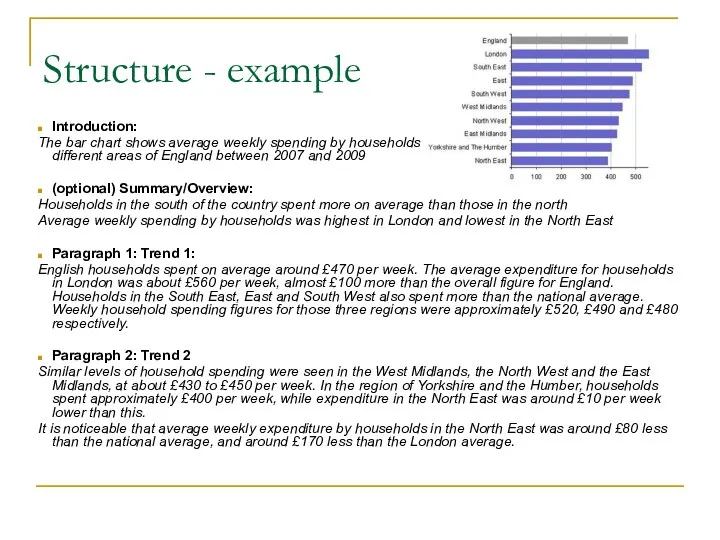
Structure - example
Introduction:
The bar chart shows average weekly spending by households
Structure - example
Introduction:
The bar chart shows average weekly spending by households
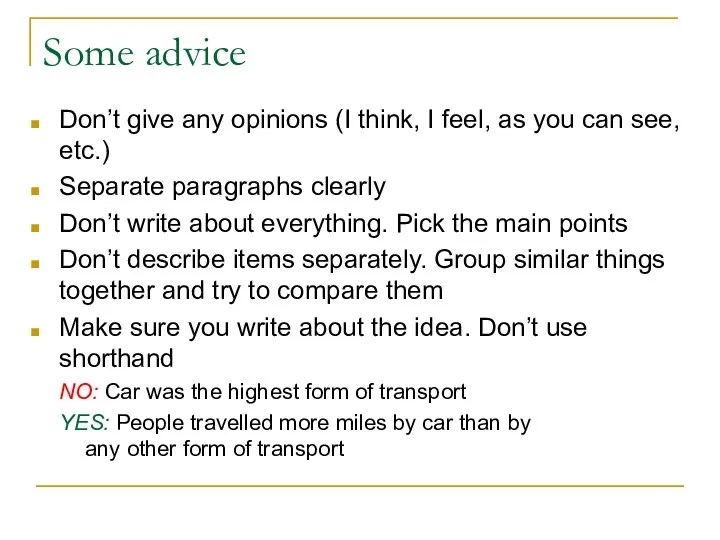
Some advice
Don’t give any opinions (I think, I feel, as you
Some advice
Don’t give any opinions (I think, I feel, as you
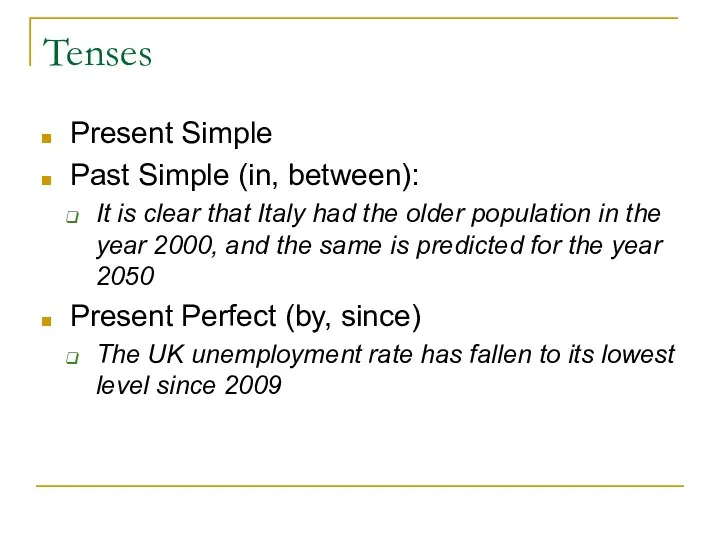
Tenses
Present Simple
Past Simple (in, between):
It is clear that Italy had the
Tenses
Present Simple
Past Simple (in, between):
It is clear that Italy had the
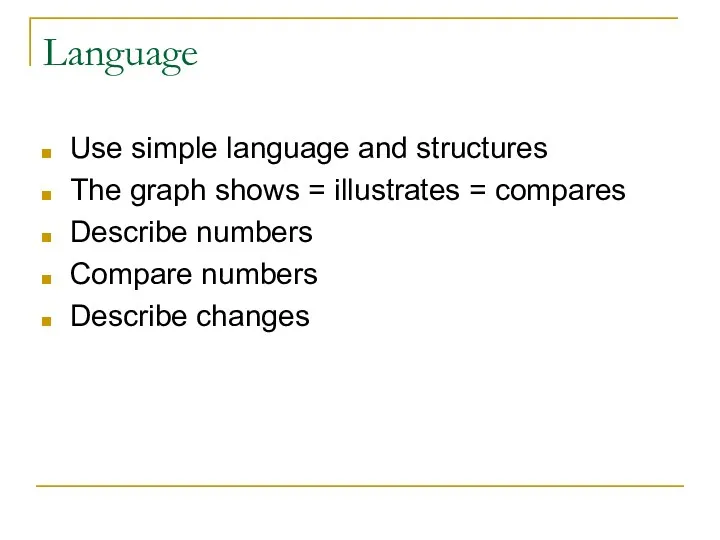
Language
Use simple language and structures
The graph shows = illustrates = compares
Describe
Language
Use simple language and structures
The graph shows = illustrates = compares
Describe
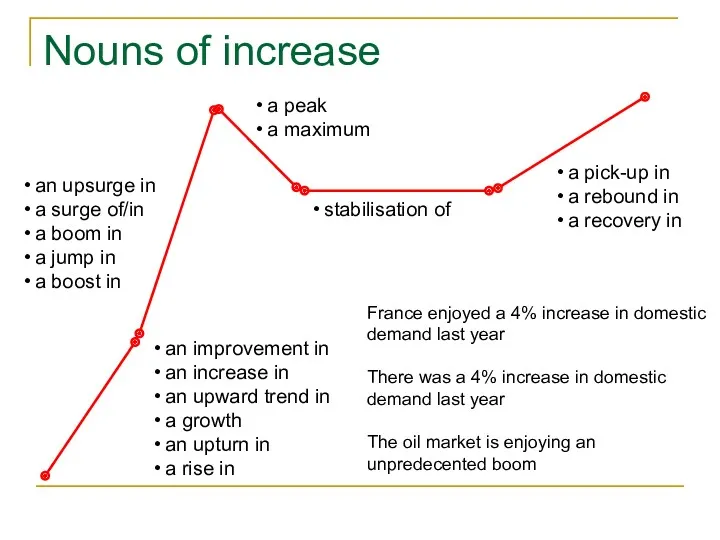
Nouns of increase
an upsurge in
a surge of/in
a boom in
a jump in
a
Nouns of increase
an upsurge in
a surge of/in
a boom in
a jump in
a
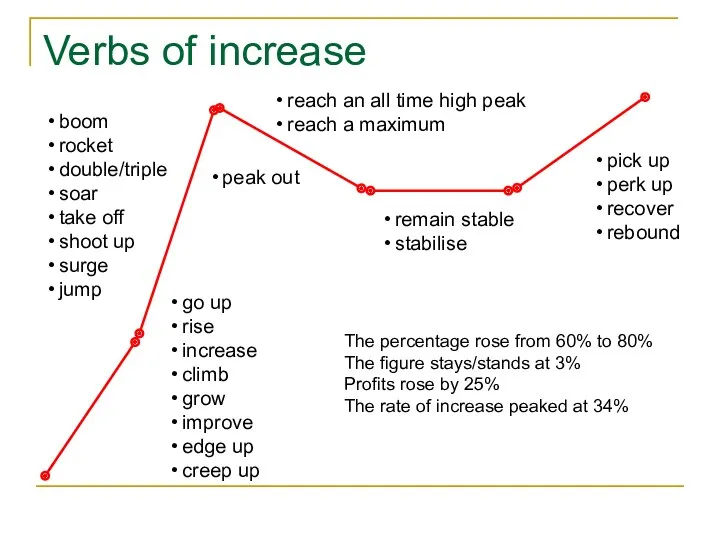
Verbs of increase
boom
rocket
double/triple
soar
take off
shoot up
surge
jump
reach an all time high peak
reach a
Verbs of increase
boom
rocket
double/triple
soar
take off
shoot up
surge
jump
reach an all time high peak
reach a
Nouns of decrease
a fall in
a decrease in
a decline in
a drop in
a
Nouns of decrease
a fall in
a decrease in
a decline in
a drop in
a
Verbs of decrease
fall back
go down
decrease
drop back
decline
slip
stay the same/at the same level
remain
Verbs of decrease
fall back
go down
decrease
drop back
decline
slip
stay the same/at the same level
remain
Scale and Speed of Change
static
sluggish
slack
stagnant
Scale and Speed of Change
static
sluggish
slack
stagnant
Exercise
The market is showing some signs of growth
The market is extremely
Exercise
The market is showing some signs of growth
The market is extremely
 Shopping
 Present perfect vs. past simple
 Adjectives in English
 Mone ishchet papu
 Mother's Day
 Обзор пособий по методике Jolly Phonics. Работа с каталогом
 Basic english grammar. Using be: yes/no questions with be
 Present Continuous (Progressive)
 English lessons. Phonetics
 High Lift Devices
 Prepositions of place on; in front of; in; on the left; on the right; between; under; behind
 Lesson 2. Greetings
 Super Minds
 What are they wearing?
 Pronoun
 Differences between accents. Phonetic and Phonological
 Present Perfect Passive
 Правильные слова. 2 класс
 Final control work. Form 10
 Regular and irregular verbs
 I'm a teacher
 General review of Great Britain
 Heroes. Grammar game (Past Simple)
 Prepositions of place: in, on, next to, under
 Coins in the Classroom. Geograpgy
 Задания по английскому языку
 Describing events
 Town. Traffic rules