- First Simple world economy indicators

Содержание
- 4. Todays lecture:
- 5. Тимофеева А.А. 2020 © How? And what for? About description
- 6. Тимофеева А.А. 2020 © World economy main preliminary indicators
- 7. Тимофеева А.А. 2020 © 1.Population Connected indicators (and tools)
- 8. 195 states, 72 dependent areas 1 billion in 1820 2 billion in 1930 3 billion in
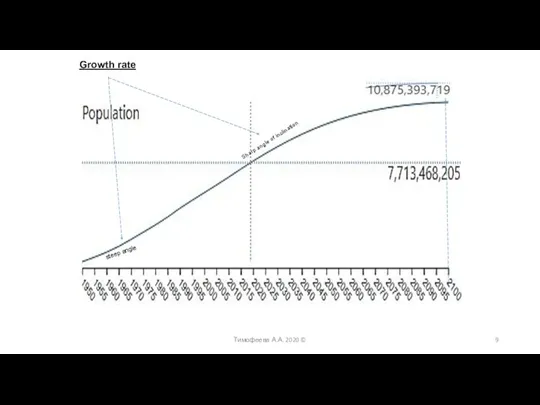
- 9. Тимофеева А.А. 2020 © Sharp angle of inclination steep angle Growth rate
- 10. Age structure 2016 : 0-14 years: 25% 15-24 years: 16.8% 25-54 years: 40.6% 55-64 years: 8.4%
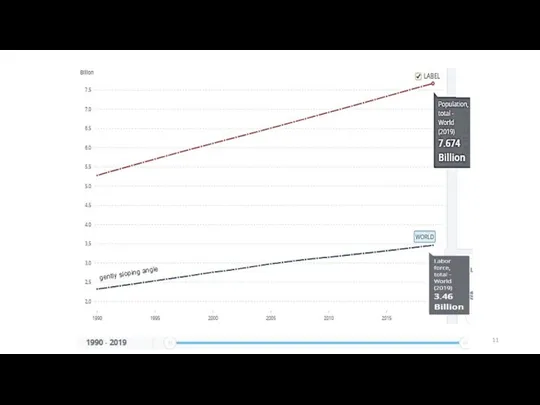
- 11. Тимофеева А.А. 2020 © gently sloping angle
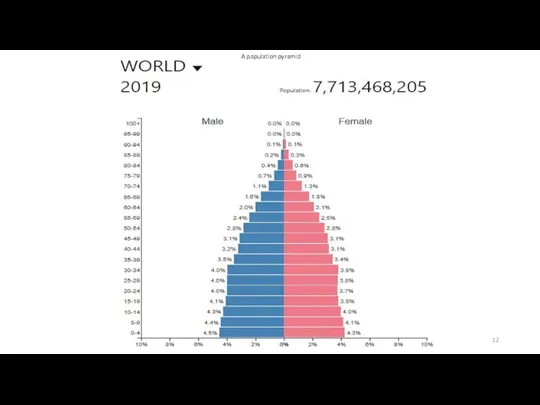
- 12. Тимофеева А.А. 2020 © A population pyramid
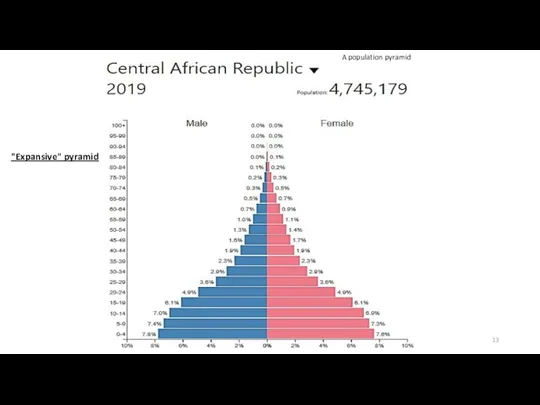
- 13. Тимофеева А.А. 2020 © A population pyramid "Expansive" pyramid
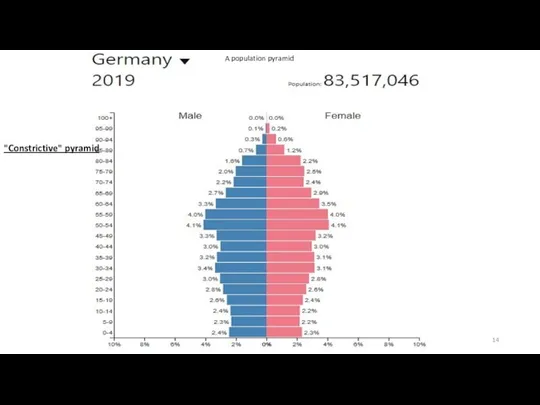
- 14. Тимофеева А.А. 2020 © A population pyramid "Constrictive" pyramid
- 15. Тимофеева А.А. 2020 © Megacity [indexes] Top fastest developing cities in the world Urbanization: Urban population:
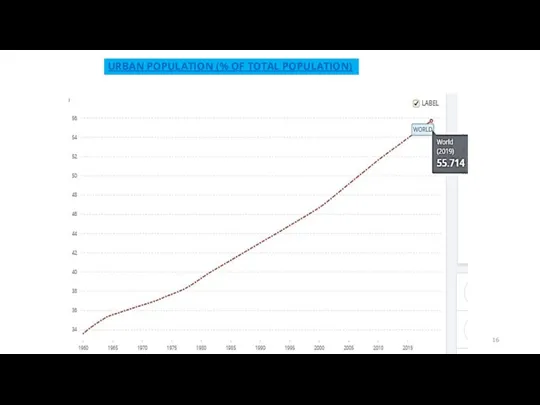
- 16. Тимофеева А.А. 2020 © URBAN POPULATION (% OF TOTAL POPULATION)
- 17. Тимофеева А.А. 2020 © MAJOR AGGLOMERATIONS OF THE WORLD
- 18. Тимофеева А.А. 2020 © 2.Production Connected indicators
- 19. Тимофеева А.А. 2020 © RICHEST CITIES
- 21. GDP, PPP (constant 2017 international $): $130.25 trillion (2019 est.) $127.25 trillion (2017 est.) $119.25 trillion
- 22. Тимофеева А.А. 2020 © GDP growth (annual %)
- 23. GDP - composition by sector: Agriculture: 6% Industry: 31% Services: 63% (2017 est.) Тимофеева А.А. 2020
- 24. Тимофеева А.А. 2020 © 3.International economic relations ind.
- 25. International economic relations Resident a legal or natural person, registered or residing in this state Тимофеева
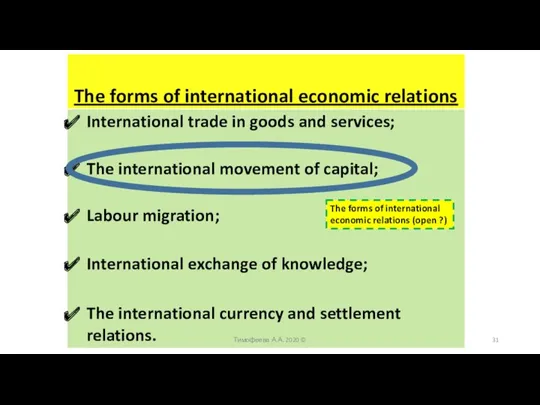
- 26. The forms of international economic relations International trade in goods and services; The international movement of
- 27. International trade in goods and services Exports - commodities: top ten - share of world trade:
- 28. Тимофеева А.А. 2020 © Exports of goods and services (constant 2010 US$)
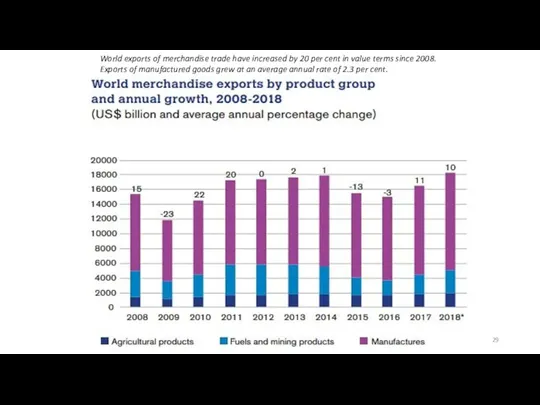
- 29. Тимофеева А.А. 2020 © World exports of merchandise trade have increased by 20 per cent in
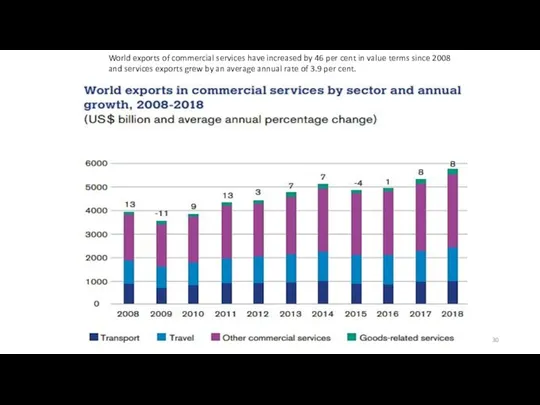
- 30. Тимофеева А.А. 2020 © World exports of commercial services have increased by 46 per cent in
- 31. The forms of international economic relations International trade in goods and services; The international movement of
- 33. Скачать презентацию

Todays lecture:
Todays lecture:

Тимофеева А.А. 2020 ©
How?
And what for?
About description
Тимофеева А.А. 2020 ©
How?
And what for?
About description
Тимофеева А.А. 2020 ©
World economy main preliminary indicators
Тимофеева А.А. 2020 ©
World economy main preliminary indicators
Тимофеева А.А. 2020 ©
1.Population
Connected indicators (and tools)
Тимофеева А.А. 2020 ©
1.Population
Connected indicators (and tools)
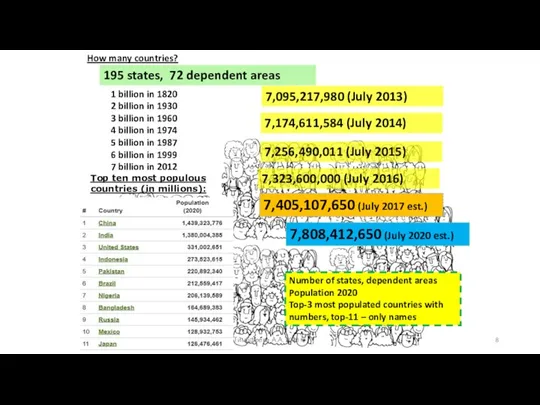
195 states, 72 dependent areas
1 billion in 1820
2 billion
195 states, 72 dependent areas
1 billion in 1820
2 billion
Тимофеева А.А. 2020 ©
Sharp angle of inclination
steep angle
Growth rate
Тимофеева А.А. 2020 ©
Sharp angle of inclination
steep angle
Growth rate
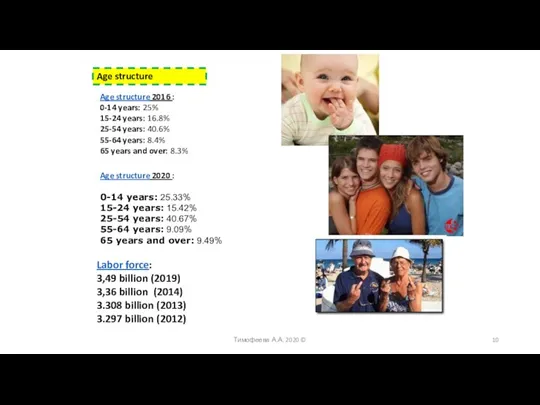
Age structure 2016 :
0-14 years: 25%
15-24 years: 16.8%
25-54 years: 40.6%
55-64 years: 8.4%
65
Age structure 2016 :
0-14 years: 25%
15-24 years: 16.8%
25-54 years: 40.6%
55-64 years: 8.4%
65
Тимофеева А.А. 2020 ©
gently sloping angle
Тимофеева А.А. 2020 ©
gently sloping angle
Тимофеева А.А. 2020 ©
A population pyramid
Тимофеева А.А. 2020 ©
A population pyramid
Тимофеева А.А. 2020 ©
A population pyramid
"Expansive" pyramid
Тимофеева А.А. 2020 ©
A population pyramid
"Expansive" pyramid
Тимофеева А.А. 2020 ©
A population pyramid
"Constrictive" pyramid
Тимофеева А.А. 2020 ©
A population pyramid
"Constrictive" pyramid
![Тимофеева А.А. 2020 © Megacity [indexes] Top fastest developing cities](/_ipx/f_webp&q_80&fit_contain&s_1440x1080/imagesDir/jpg/316261/slide-14.jpg)
Тимофеева А.А. 2020 ©
Megacity [indexes]
Top fastest developing cities in the world
Urbanization:
Urban
Тимофеева А.А. 2020 ©
Megacity [indexes]
Top fastest developing cities in the world
Urbanization:
Urban
Тимофеева А.А. 2020 ©
URBAN POPULATION (% OF TOTAL POPULATION)
Тимофеева А.А. 2020 ©
URBAN POPULATION (% OF TOTAL POPULATION)
Тимофеева А.А. 2020 ©
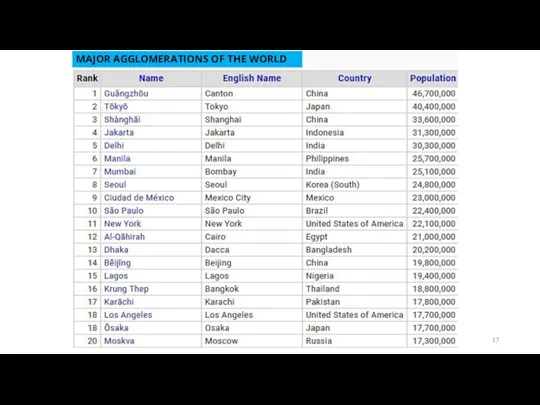
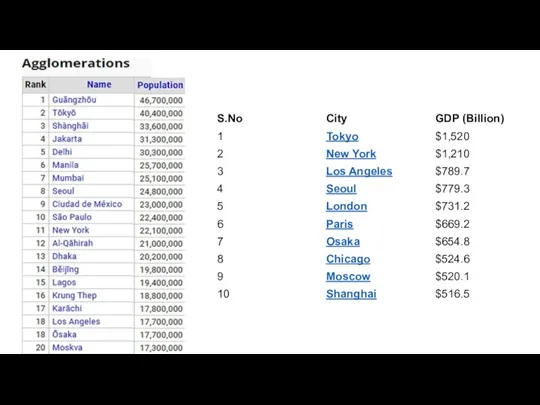
MAJOR AGGLOMERATIONS OF THE WORLD
Тимофеева А.А. 2020 ©
MAJOR AGGLOMERATIONS OF THE WORLD
Тимофеева А.А. 2020 ©
2.Production
Connected indicators
Тимофеева А.А. 2020 ©
2.Production
Connected indicators
Тимофеева А.А. 2020 ©
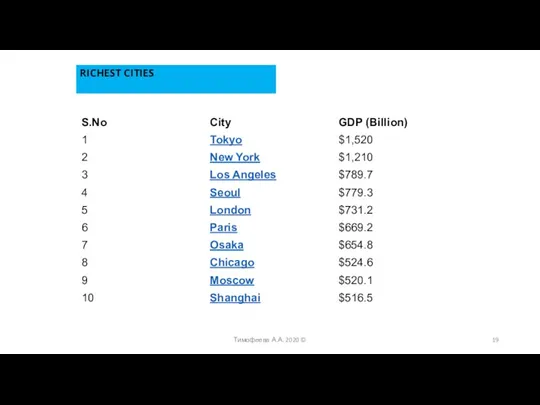
RICHEST CITIES
Тимофеева А.А. 2020 ©
RICHEST CITIES
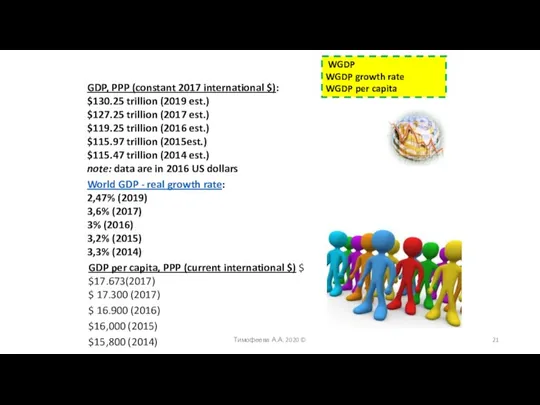
GDP, PPP (constant 2017 international $):
$130.25 trillion (2019 est.)
$127.25 trillion (2017
GDP, PPP (constant 2017 international $):
$130.25 trillion (2019 est.)
$127.25 trillion (2017
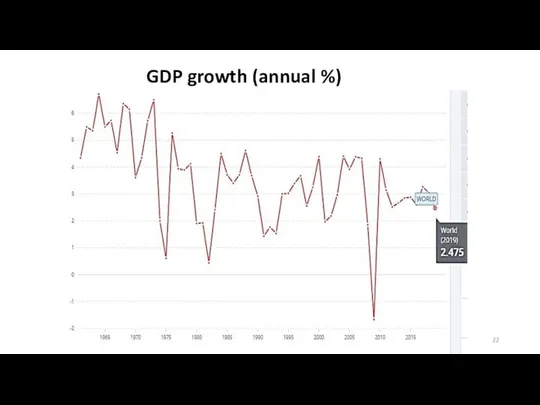
Тимофеева А.А. 2020 ©
GDP growth (annual %)
Тимофеева А.А. 2020 ©
GDP growth (annual %)
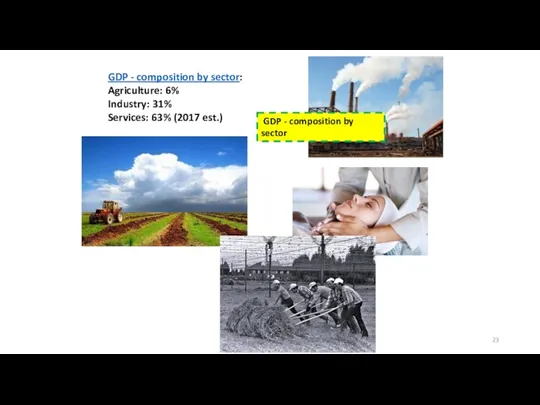
GDP - composition by sector:
Agriculture: 6%
Industry: 31%
Services: 63% (2017 est.)
Тимофеева А.А. 2020 ©
GDP
GDP - composition by sector:
Agriculture: 6%
Industry: 31%
Services: 63% (2017 est.)
Тимофеева А.А. 2020 ©
GDP
Тимофеева А.А. 2020 ©
3.International economic relations ind.
Тимофеева А.А. 2020 ©
3.International economic relations ind.
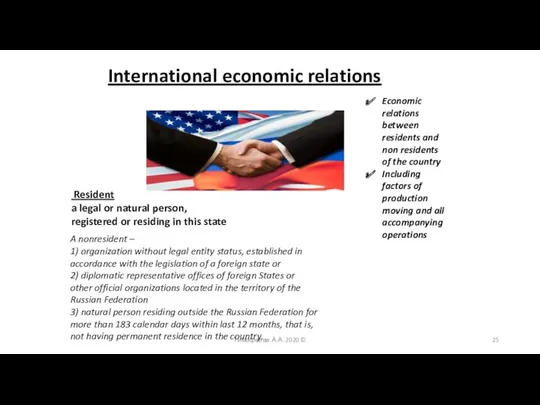
International economic relations
Resident
a legal or natural person, registered or residing
International economic relations
Resident a legal or natural person, registered or residing
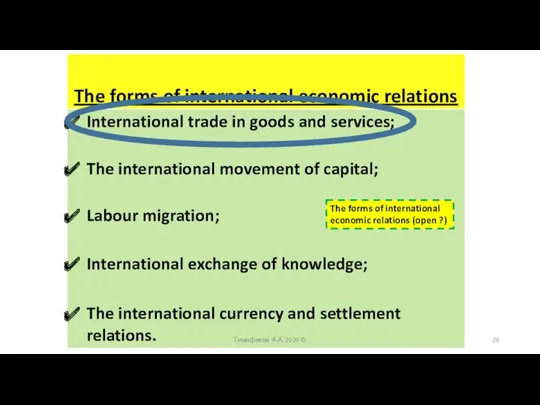
The forms of international economic relations
International trade in goods and services;
The
The forms of international economic relations
International trade in goods and services;
The
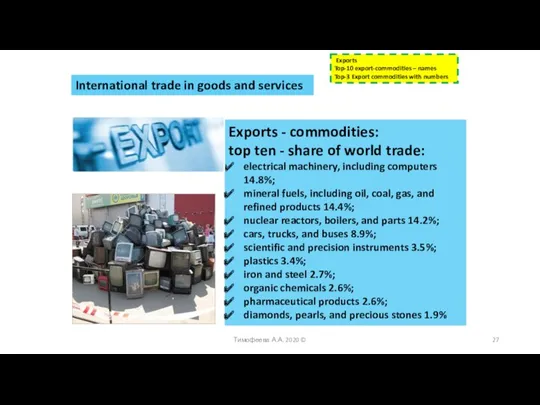
International trade in goods and services
Exports - commodities:
top ten - share
International trade in goods and services
Exports - commodities:
top ten - share
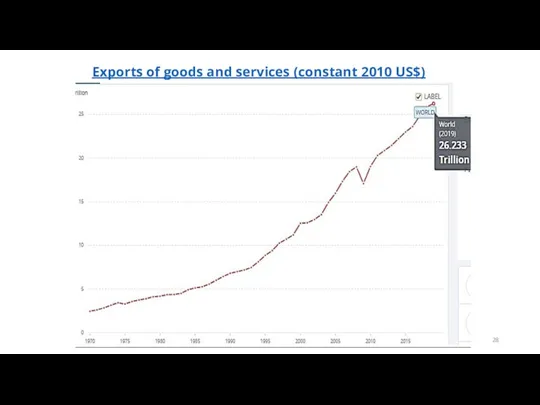
Тимофеева А.А. 2020 ©
Exports of goods and services (constant 2010 US$)
Тимофеева А.А. 2020 ©
Exports of goods and services (constant 2010 US$)
Тимофеева А.А. 2020 ©
World exports of merchandise trade have increased by
Тимофеева А.А. 2020 ©
World exports of merchandise trade have increased by
Тимофеева А.А. 2020 ©
World exports of commercial services have increased by
Тимофеева А.А. 2020 ©
World exports of commercial services have increased by
The forms of international economic relations
International trade in goods and services;
The
The forms of international economic relations
International trade in goods and services;
The
 Профессия экономист
 Цикличность развития рыночной экономики
 Школа физиократов
 Изменения и задания ЕГЭ по обществознанию 2018 года
 Введение в экономику
 По продуктам банка жилстройсбербанк казахстана
 Железногорск-Илимский. Развитие шаг за шагом
 Цифровая экономика
 Теория производства фирмы. Тема 4
 Функции малого бизнеса в Российской экономике
 Российское предприятие на мировом рынке. Сравнительный анализ преимуществ и недостатков его конкурентоспособности
 Природные ресурсы и их роль в экономике Росии
 Основы налогообложения. Налоги и налоговая система
 Теория и практика поиска работы на рынке труда
 Экономика, как наука и хозяйство
 Кадры организации и производительность труда. Трудовые ресурсы
 Государственно – правовое регулирование экономики
 Государственное и международное регулирование мировой торговли
 Сущность экономического конфликта. Лекция 2
 Новости. ByteDаnce не продаст США алгоритм приложения TikTok
 Государственное регулирование цен
 Роль государства в экономике
 Направления транспортной политики ЕС
 Предмет и методы экономической теории
 Анализ Группы компаний ПРОТЕК
 Методология экономической науки. Альтернативы: историческая школа, институционализм
 Система 5С
 Анализ динамики внешней торговли Воронежской области