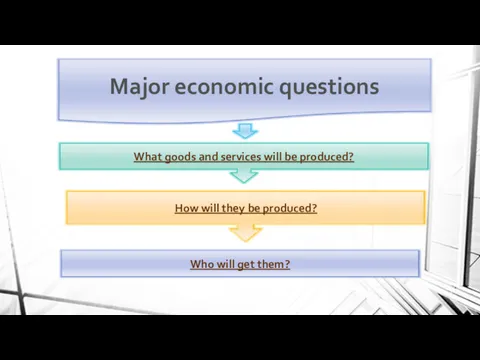
- Major economic questions

Содержание
- 2. Agenda What is economics? The main types of resources in the economy. Major economics questions
- 3. What is economic? science economy the relationship between people
- 4. Economics Is the social science that seeks to describe the factors which determine the production, distribution
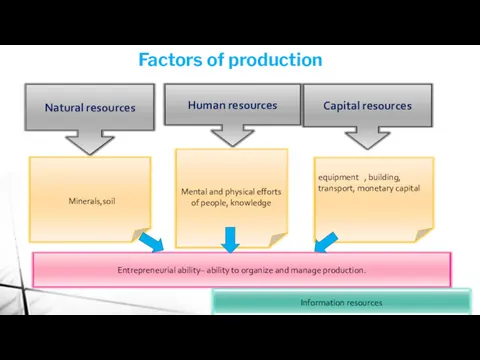
- 5. The main types of resources in the economy Resources - sources, which produce material goods and
- 6. Factors of production
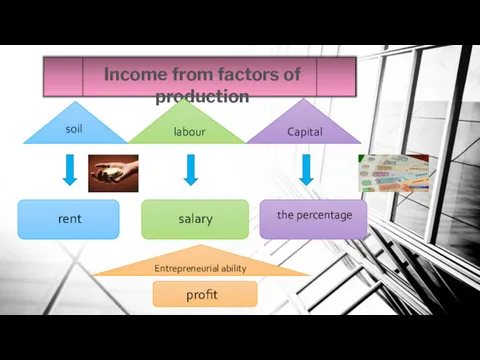
- 7. Income from factors of production rent salary the percentage Capital labour soil Entrepreneurial ability profit
- 9. The PPF is a table or graph showing the different quantity combinations of the two goods
- 10. The Lorenz curve is a graphical representation of the cumulative distribution function of the empirical probably
- 11. The production function is a graphical or mathematical expression showing the relationship between the inputs used
- 12. References 1. https://en.wikipedia.org/wiki/Production_function 2.http://economicsonline.co.uk/Competitive_markets/The_economic_problem.html 3.http://www.globalguideline.com/interview_questions/Questions.php?sc=Economics_Interview_Questions_and_Answers_
- 14. Скачать презентацию
Agenda
What is economics?
The main types of resources in the economy.
Major economics
Agenda
What is economics?
The main types of resources in the economy.
Major economics
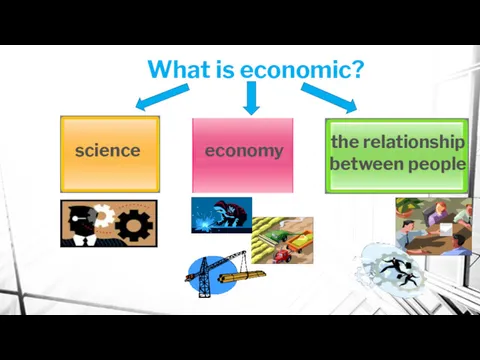
What is economic?
science
economy
the relationship between people
What is economic?
science
economy
the relationship between people
Economics
Is the social science that seeks to describe the factors which
Economics
Is the social science that seeks to describe the factors which
The main types of resources in the economy
Resources - sources, which
The main types of resources in the economy
Resources - sources, which
Factors of production
Factors of production
Income from factors of production
rent
salary
the percentage
Capital
labour
soil
Entrepreneurial ability
profit
Income from factors of production
rent
salary
the percentage
Capital
labour
soil
Entrepreneurial ability
profit
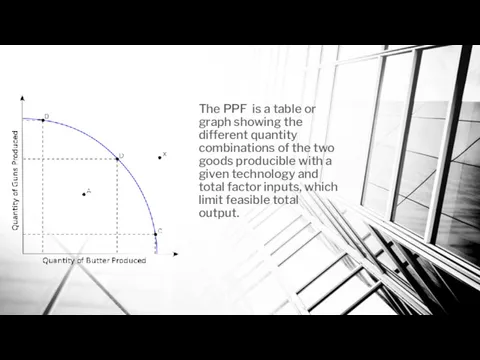
The PPF is a table or graph showing the different quantity
The PPF is a table or graph showing the different quantity
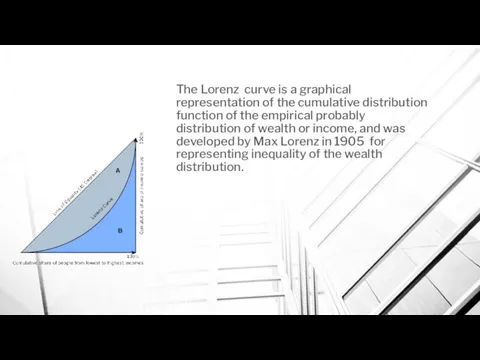
The Lorenz curve is a graphical representation of the cumulative distribution
The Lorenz curve is a graphical representation of the cumulative distribution
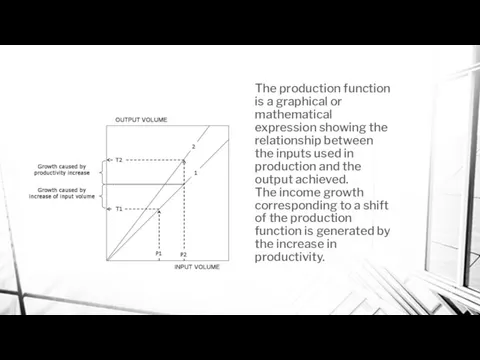
The production function is a graphical or mathematical expression showing the
The production function is a graphical or mathematical expression showing the
References
1. https://en.wikipedia.org/wiki/Production_function
2.http://economicsonline.co.uk/Competitive_markets/The_economic_problem.html
3.http://www.globalguideline.com/interview_questions/Questions.php?sc=Economics_Interview_Questions_and_Answers_
References
1. https://en.wikipedia.org/wiki/Production_function
2.http://economicsonline.co.uk/Competitive_markets/The_economic_problem.html
3.http://www.globalguideline.com/interview_questions/Questions.php?sc=Economics_Interview_Questions_and_Answers_
 Безработица, её причины и последствия
 Причины и следствия мирового финансового кризиса 2008 года
 Учет внеоборотных активов. (Тема 2.1)
 Общее макроэкономическое равновесие. Модель AD-AS
 Трудовые ресурсы и их использование
 Теоретико-методологические основы экономики
 Анализ основных показателей НТП
 Экономика: просто о сложном. Экономический дизайн
 Социально-экономическое развитие России 1860-е - 1890-е гг
 Ценообразование
 Теоретические принципы корпоративной социальной политики. Экономическая и социальная ответственность бизнеса
 Фармакоэкономический анализ: общие положения. Методы фармакоэкономического анализа
 Экономика. Предмет и метод
 Анализ задания на проектирование и подготовка исходных данных
 Россия на путях к инновационному развитию
 Экономическая история Испании
 Исследование направлений повышения конкурентоспособности компании и их экономическая оценка
 Доклад по экономике на тему: Античная экономика. Учения Платона
 The economics of the public sector. (Lecture 4)
 Розрахунок економічної ефективності автоматизації процесу екстракції у виробництві олії
 Анализ использования основных средств предприятия
 Міжнародна конкурентоспроможність національних економік
 Консорциум
 Предприятие – основное звено экономики
 Виды и формы предпринимательства
 Нобелевские премии по экономике
 Основы поведения субъектов современной рыночной экономики. Тема 7
 Изучение динамики социально-экономических явлений