- Measuring a nation’s income. Micro vs. Macro

Содержание
- 2. In this chapter, look for the answers to these questions: What is Gross Domestic Product (GDP)?
- 3. MEASURING A NATION’S INCOME Micro vs. Macro Microeconomics: The study of how individual households and firms
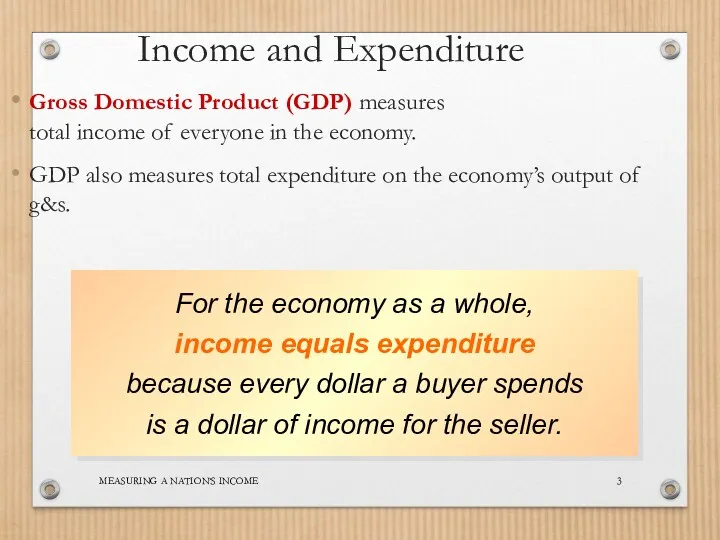
- 4. MEASURING A NATION’S INCOME Income and Expenditure Gross Domestic Product (GDP) measures total income of everyone
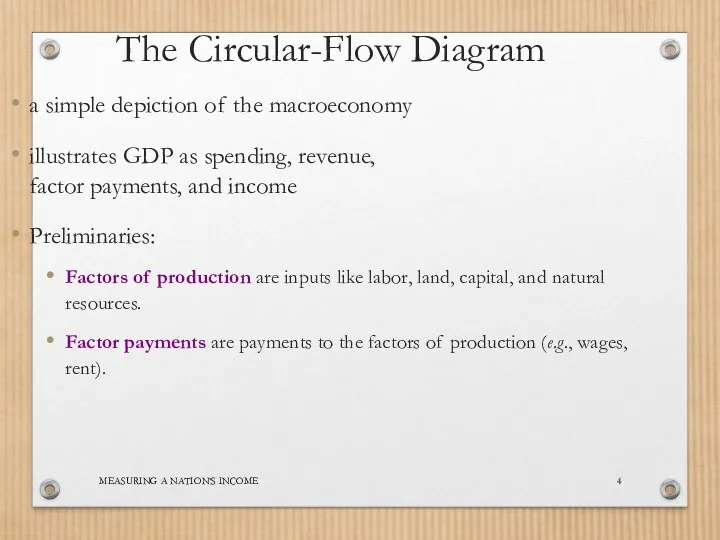
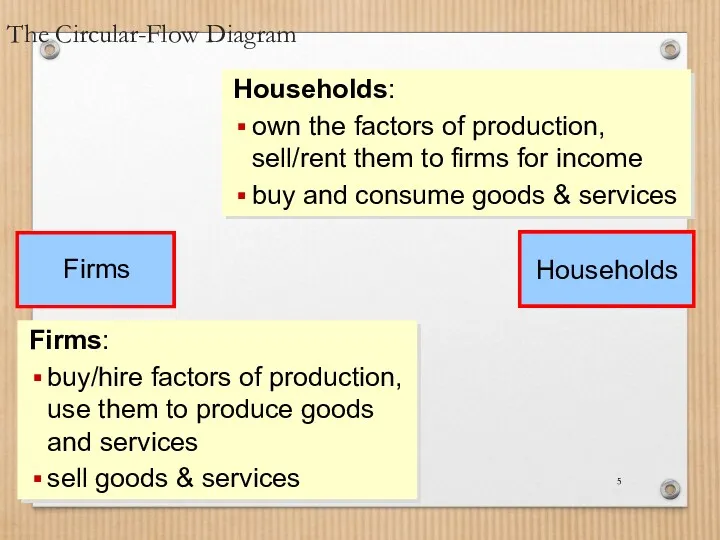
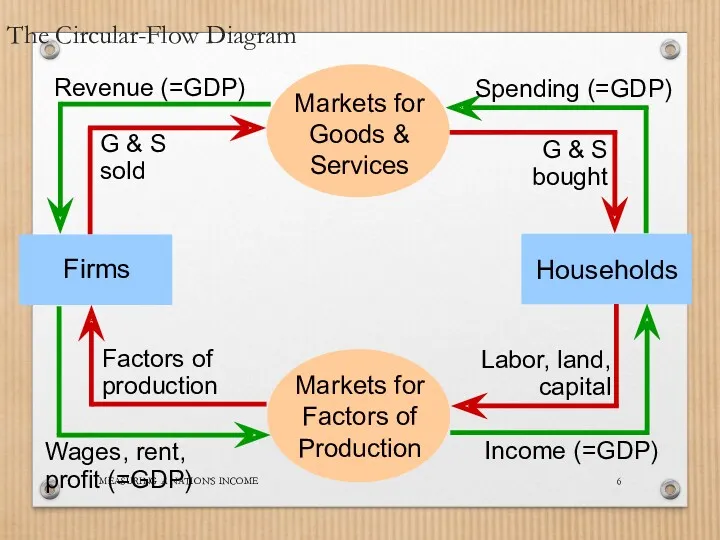
- 5. MEASURING A NATION’S INCOME The Circular-Flow Diagram a simple depiction of the macroeconomy illustrates GDP as
- 6. MEASURING A NATION’S INCOME The Circular-Flow Diagram Households: own the factors of production, sell/rent them to
- 7. MEASURING A NATION’S INCOME The Circular-Flow Diagram
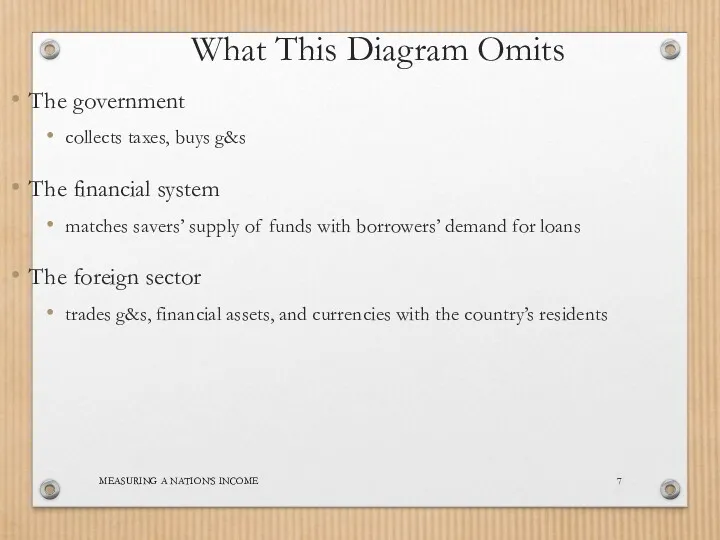
- 8. MEASURING A NATION’S INCOME What This Diagram Omits The government collects taxes, buys g&s The financial
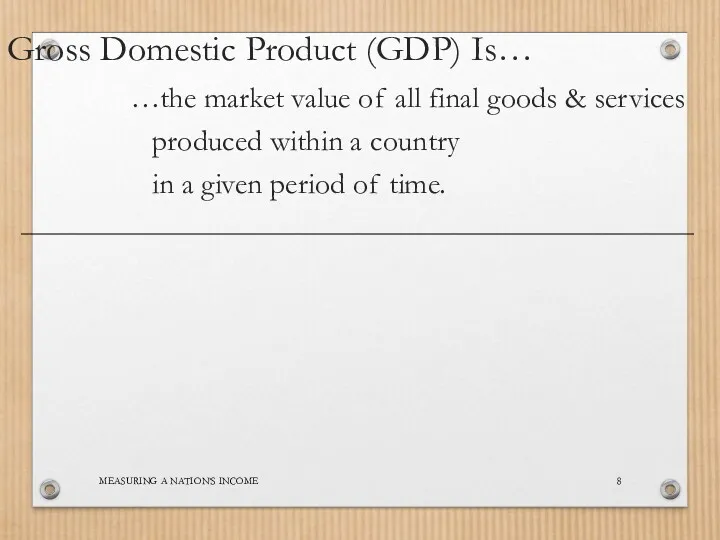
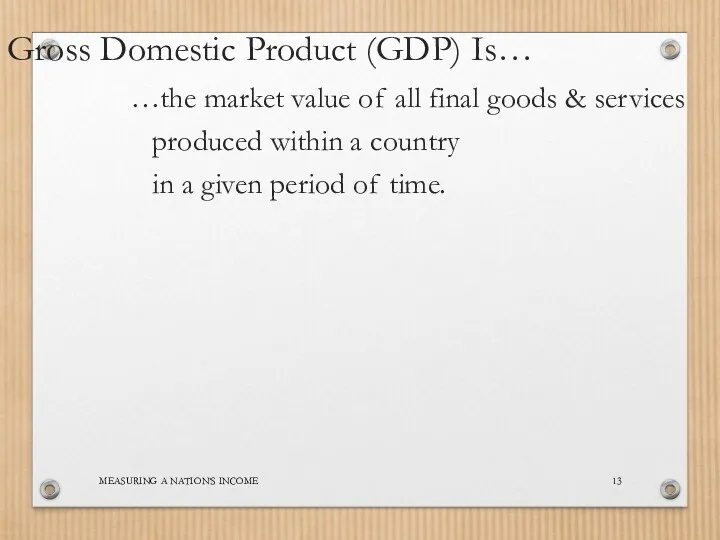
- 9. MEASURING A NATION’S INCOME …the market value of all final goods & services produced within a
- 10. MEASURING A NATION’S INCOME …the market value of all final goods & services produced within a
- 11. MEASURING A NATION’S INCOME …the market value of all final goods & services produced within a
- 12. MEASURING A NATION’S INCOME …the market value of all final goods & services produced within a
- 13. MEASURING A NATION’S INCOME …the market value of all final goods & services produced within a
- 14. MEASURING A NATION’S INCOME …the market value of all final goods & services produced within a
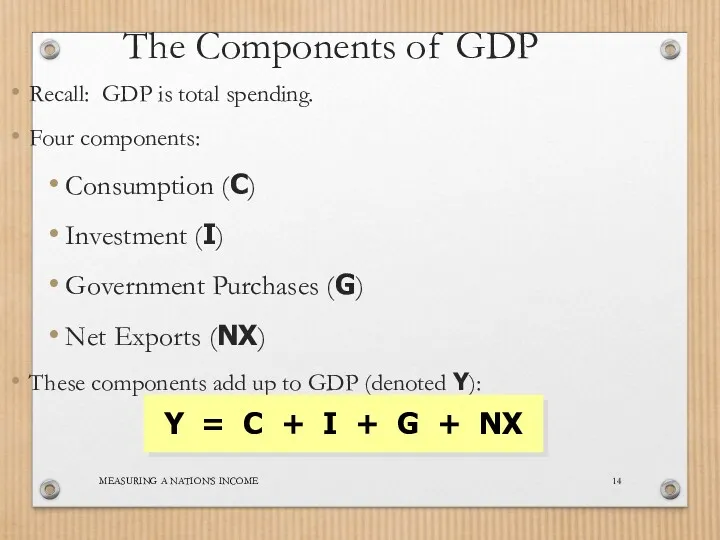
- 15. MEASURING A NATION’S INCOME The Components of GDP Recall: GDP is total spending. Four components: Consumption
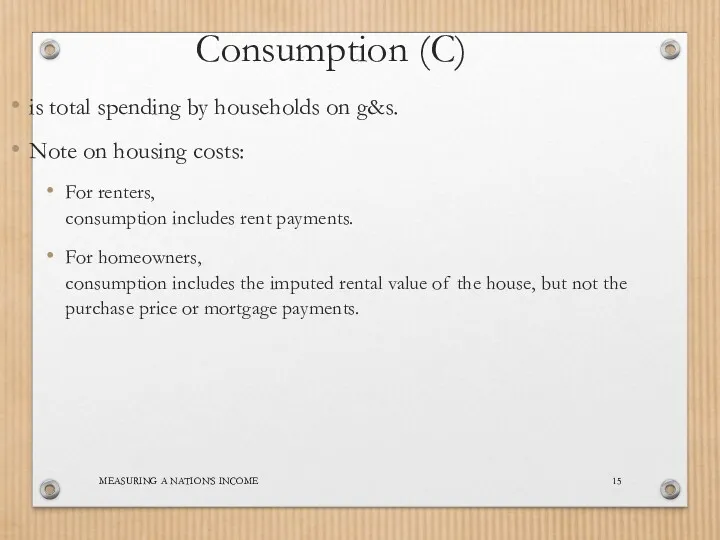
- 16. MEASURING A NATION’S INCOME Consumption (C) is total spending by households on g&s. Note on housing
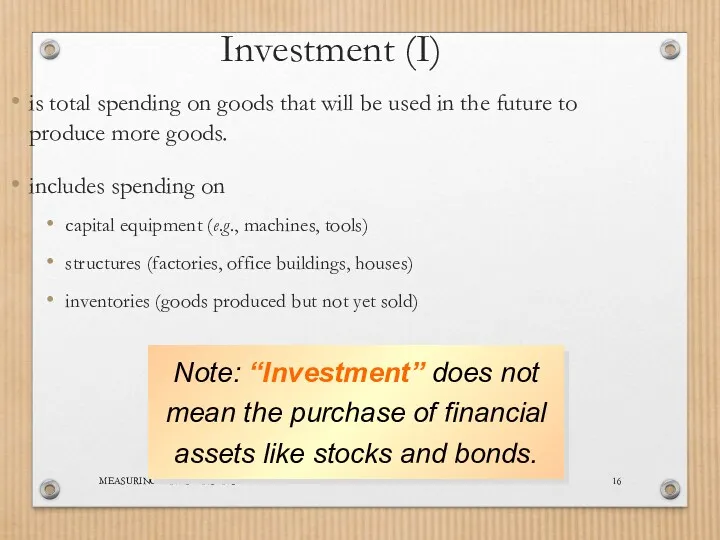
- 17. MEASURING A NATION’S INCOME Investment (I) is total spending on goods that will be used in
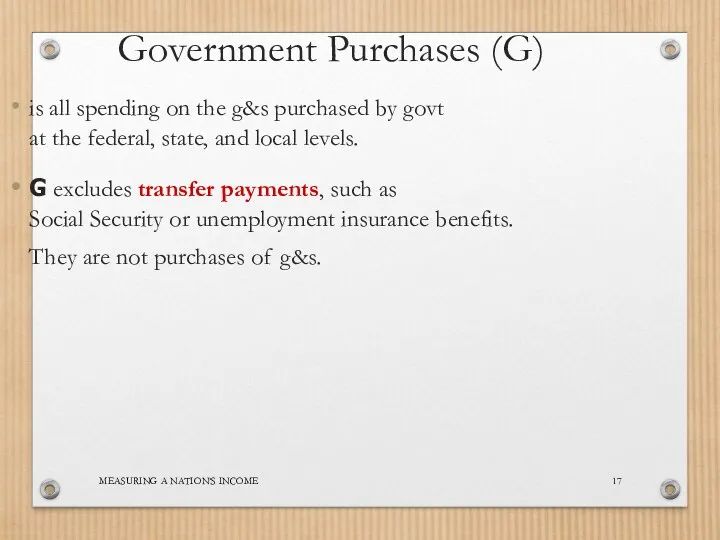
- 18. MEASURING A NATION’S INCOME Government Purchases (G) is all spending on the g&s purchased by govt
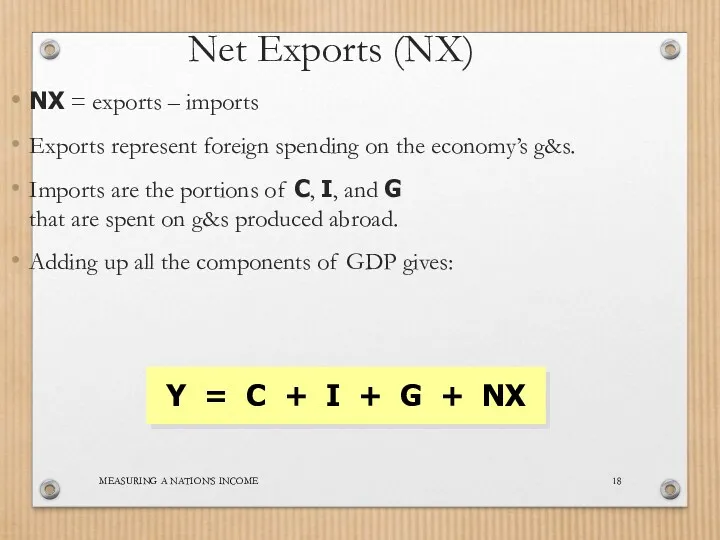
- 19. MEASURING A NATION’S INCOME Net Exports (NX) NX = exports – imports Exports represent foreign spending
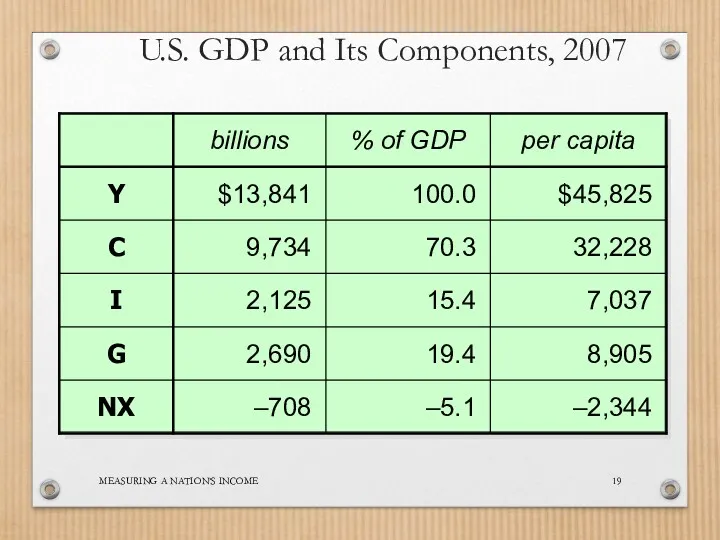
- 20. MEASURING A NATION’S INCOME U.S. GDP and Its Components, 2007
- 21. MEASURING A NATION’S INCOME Real versus Nominal GDP Inflation can distort economic variables like GDP, so
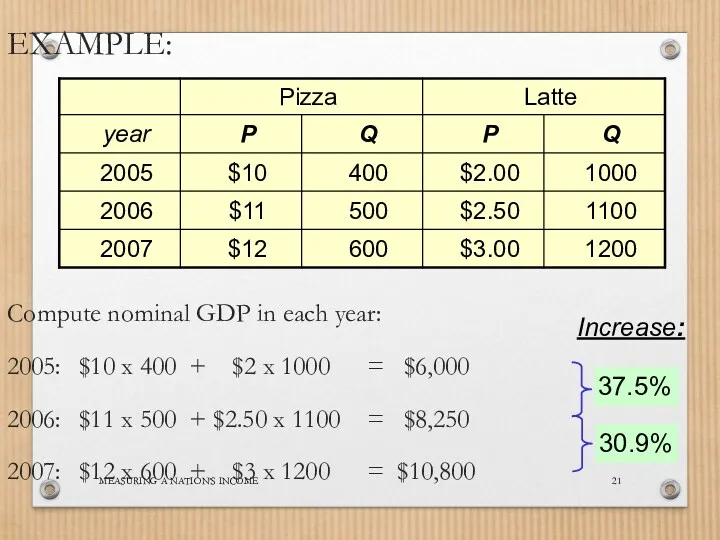
- 22. MEASURING A NATION’S INCOME EXAMPLE: Compute nominal GDP in each year: 2005: $10 x 400 +
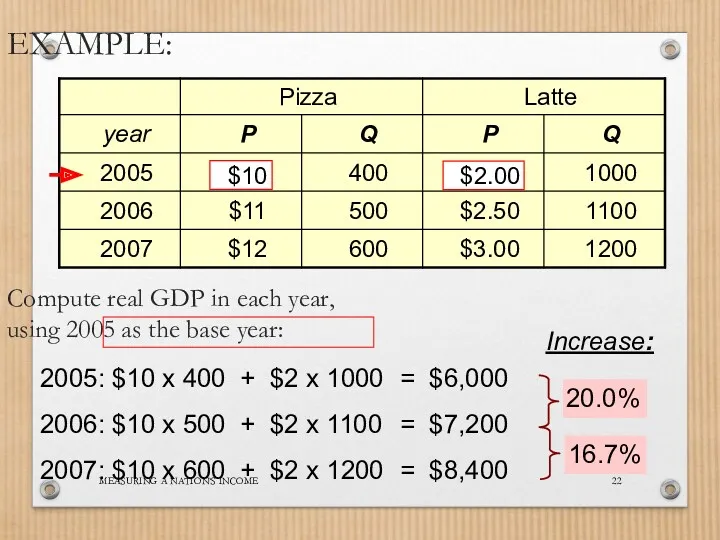
- 23. MEASURING A NATION’S INCOME EXAMPLE: Compute real GDP in each year, using 2005 as the base
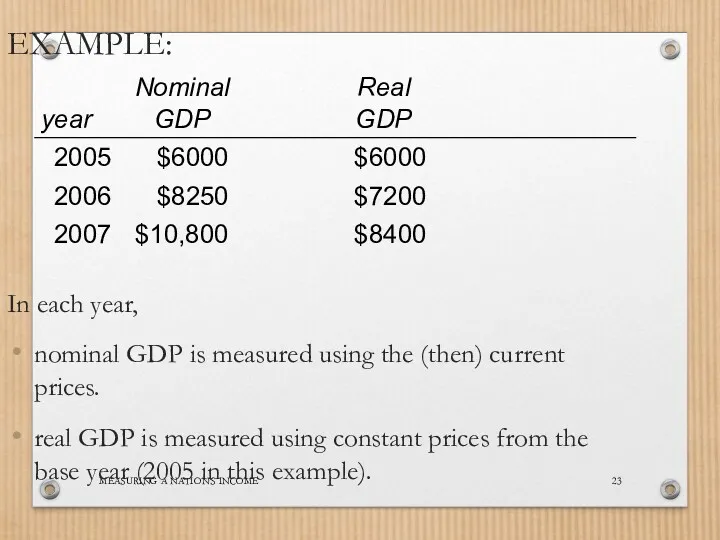
- 24. MEASURING A NATION’S INCOME EXAMPLE: In each year, nominal GDP is measured using the (then) current
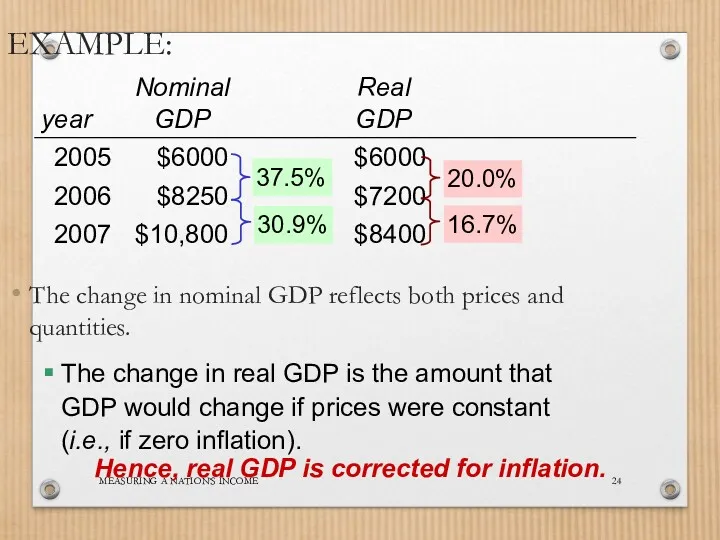
- 25. MEASURING A NATION’S INCOME EXAMPLE: The change in nominal GDP reflects both prices and quantities. The
- 26. Nominal and Real GDP in the U.S., 1965-2007 Real GDP (base year 2000) Nominal GDP
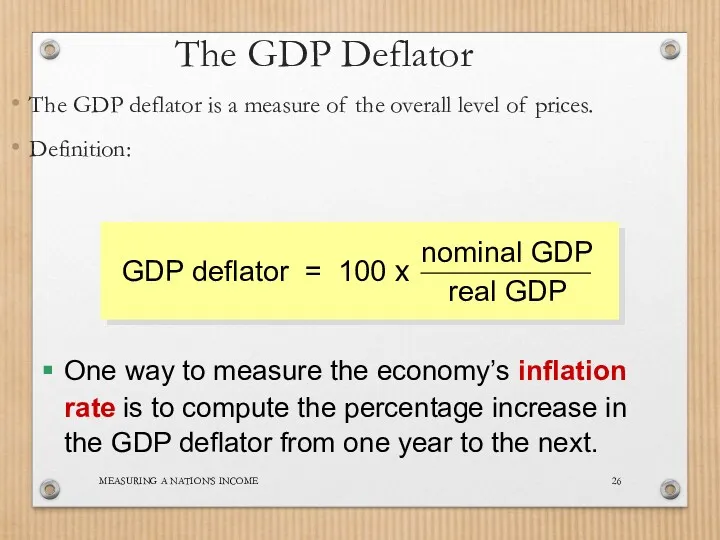
- 27. MEASURING A NATION’S INCOME The GDP Deflator The GDP deflator is a measure of the overall
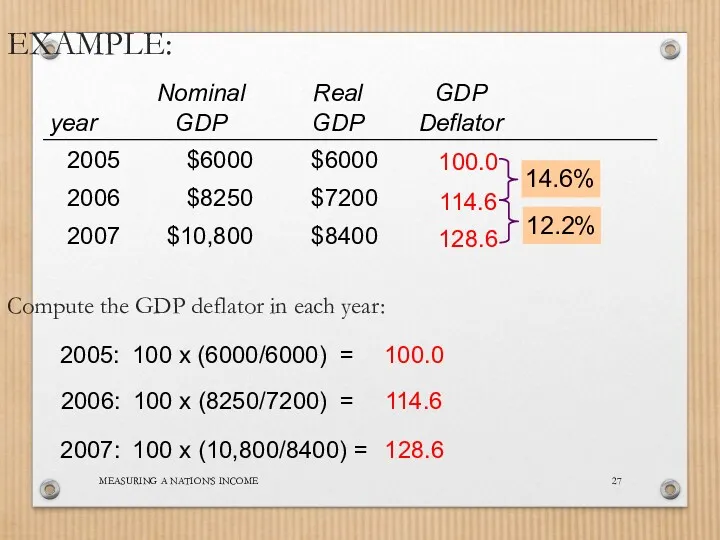
- 28. MEASURING A NATION’S INCOME EXAMPLE: Compute the GDP deflator in each year:
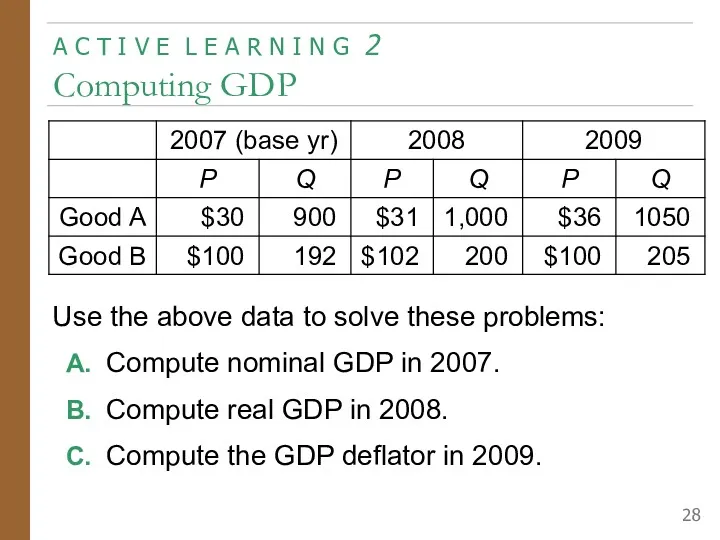
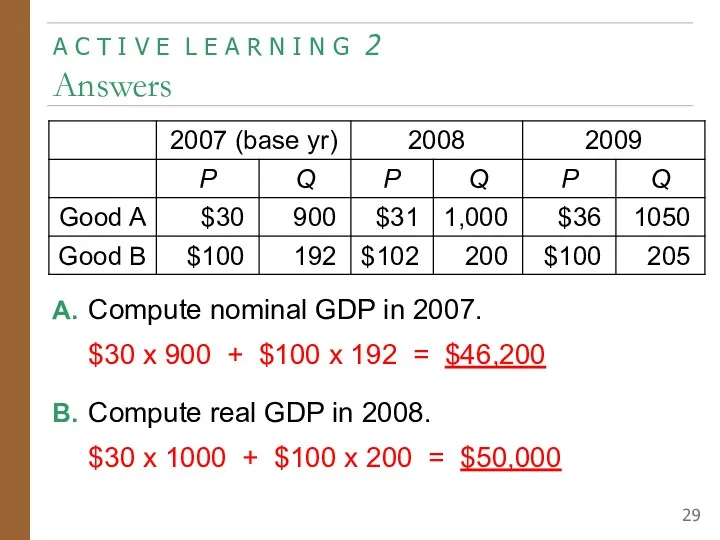
- 29. A C T I V E L E A R N I N G 2 Computing
- 30. A C T I V E L E A R N I N G 2 Answers
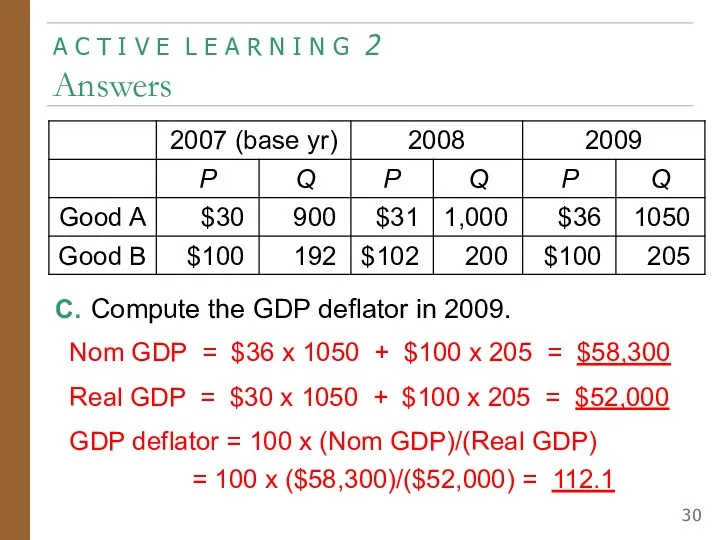
- 31. A C T I V E L E A R N I N G 2 Answers
- 32. MEASURING A NATION’S INCOME GDP and Economic Well-Being Real GDP per capita is the main indicator
- 33. Gross Domestic Product… “… does not allow for the health of our children, the quality of
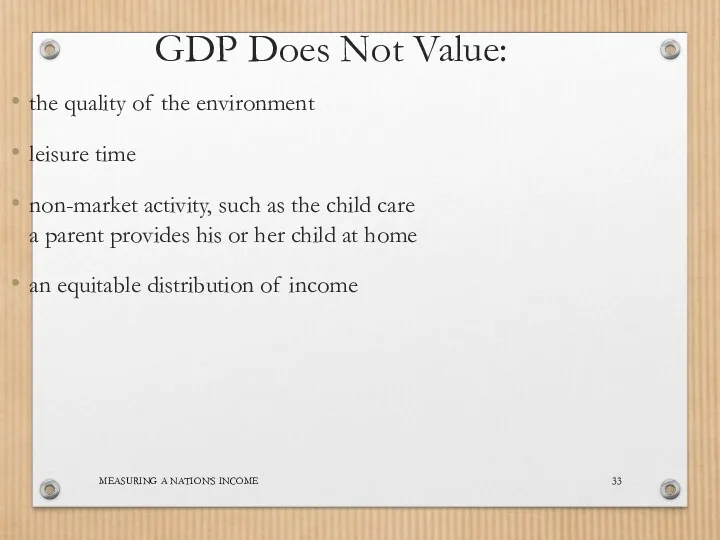
- 34. MEASURING A NATION’S INCOME GDP Does Not Value: the quality of the environment leisure time non-market
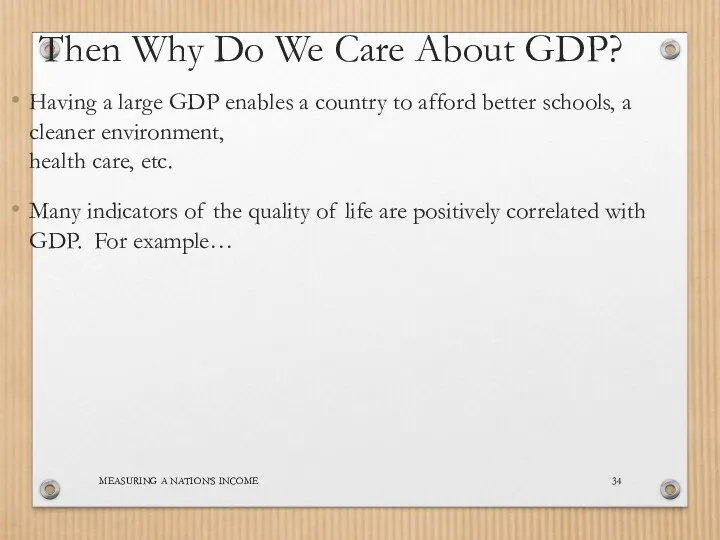
- 35. MEASURING A NATION’S INCOME Then Why Do We Care About GDP? Having a large GDP enables
- 36. GDP and Life Expectancy in 12 countries Life expectancy (years) Real GDP per capita U.S. Germany
- 37. GDP and Literacy in 12 countries Adult Literacy (% of population) Real GDP per capita U.S.
- 38. GDP and Internet Usage in 12 countries Internet Usage (% of population) Real GDP per capita
- 40. Скачать презентацию
In this chapter,
look for the answers to these questions:
What is
In this chapter,
look for the answers to these questions:
What is
MEASURING A NATION’S INCOME
Micro vs. Macro
Microeconomics:
The study of how individual
MEASURING A NATION’S INCOME
Micro vs. Macro
Microeconomics: The study of how individual
MEASURING A NATION’S INCOME
Income and Expenditure
Gross Domestic Product (GDP) measures
total
MEASURING A NATION’S INCOME
Income and Expenditure
Gross Domestic Product (GDP) measures total
MEASURING A NATION’S INCOME
The Circular-Flow Diagram
a simple depiction of the macroeconomy
illustrates
MEASURING A NATION’S INCOME
The Circular-Flow Diagram
a simple depiction of the macroeconomy
illustrates
MEASURING A NATION’S INCOME
The Circular-Flow Diagram
Households:
own the factors of production,
sell/rent
MEASURING A NATION’S INCOME
The Circular-Flow Diagram
Households:
own the factors of production,
sell/rent
MEASURING A NATION’S INCOME
The Circular-Flow Diagram
MEASURING A NATION’S INCOME
The Circular-Flow Diagram
MEASURING A NATION’S INCOME
What This Diagram Omits
The government
collects taxes, buys g&s
The
MEASURING A NATION’S INCOME
What This Diagram Omits
The government
collects taxes, buys g&s
The
MEASURING A NATION’S INCOME
…the market value of all final goods &
MEASURING A NATION’S INCOME
…the market value of all final goods &
MEASURING A NATION’S INCOME
…the market value of all final goods &
MEASURING A NATION’S INCOME
…the market value of all final goods &
MEASURING A NATION’S INCOME
…the market value of all final goods &
MEASURING A NATION’S INCOME
…the market value of all final goods &
MEASURING A NATION’S INCOME
…the market value of all final goods &
MEASURING A NATION’S INCOME
…the market value of all final goods &
MEASURING A NATION’S INCOME
…the market value of all final goods &
MEASURING A NATION’S INCOME
…the market value of all final goods &
MEASURING A NATION’S INCOME
…the market value of all final goods &
MEASURING A NATION’S INCOME
…the market value of all final goods &
MEASURING A NATION’S INCOME
The Components of GDP
Recall: GDP is total spending.
MEASURING A NATION’S INCOME
The Components of GDP
Recall: GDP is total spending.
MEASURING A NATION’S INCOME
Consumption (C)
is total spending by households on g&s.
MEASURING A NATION’S INCOME
Consumption (C)
is total spending by households on g&s.
MEASURING A NATION’S INCOME
Investment (I)
is total spending on goods that will
MEASURING A NATION’S INCOME
Investment (I)
is total spending on goods that will
MEASURING A NATION’S INCOME
Government Purchases (G)
is all spending on the g&s
MEASURING A NATION’S INCOME
Government Purchases (G)
is all spending on the g&s
MEASURING A NATION’S INCOME
Net Exports (NX)
NX = exports – imports
Exports represent
MEASURING A NATION’S INCOME
Net Exports (NX)
NX = exports – imports
Exports represent
MEASURING A NATION’S INCOME
U.S. GDP and Its Components, 2007
MEASURING A NATION’S INCOME
U.S. GDP and Its Components, 2007
MEASURING A NATION’S INCOME
Real versus Nominal GDP
Inflation can distort economic variables
MEASURING A NATION’S INCOME
Real versus Nominal GDP
Inflation can distort economic variables
MEASURING A NATION’S INCOME
EXAMPLE:
Compute nominal GDP in each year:
2005: $10 x 400
MEASURING A NATION’S INCOME
EXAMPLE:
Compute nominal GDP in each year:
2005: $10 x 400
MEASURING A NATION’S INCOME
EXAMPLE:
Compute real GDP in each year,
using 2005
MEASURING A NATION’S INCOME
EXAMPLE:
Compute real GDP in each year, using 2005
MEASURING A NATION’S INCOME
EXAMPLE:
In each year,
nominal GDP is measured using the
MEASURING A NATION’S INCOME
EXAMPLE:
In each year,
nominal GDP is measured using the
MEASURING A NATION’S INCOME
EXAMPLE:
The change in nominal GDP reflects both prices
MEASURING A NATION’S INCOME
EXAMPLE:
The change in nominal GDP reflects both prices
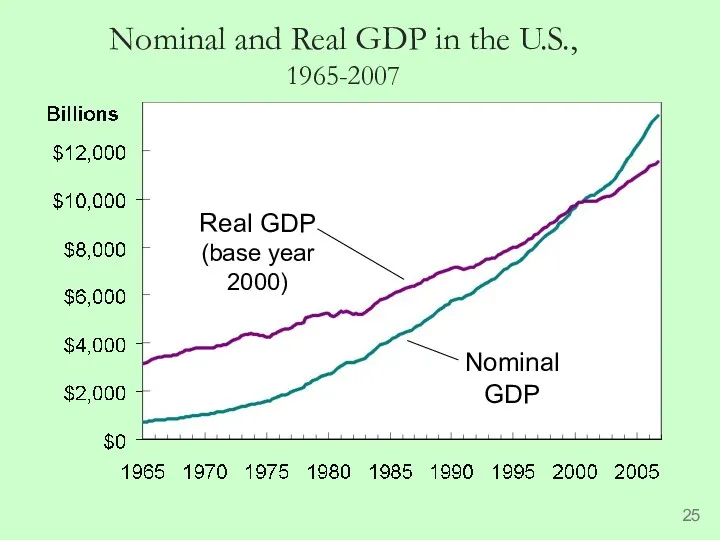
Nominal and Real GDP in the U.S.,
1965-2007
Real GDP (base year
Nominal and Real GDP in the U.S.,
1965-2007
Real GDP (base year
MEASURING A NATION’S INCOME
The GDP Deflator
The GDP deflator is a measure
MEASURING A NATION’S INCOME
The GDP Deflator
The GDP deflator is a measure
MEASURING A NATION’S INCOME
EXAMPLE:
Compute the GDP deflator in each year:
MEASURING A NATION’S INCOME
EXAMPLE:
Compute the GDP deflator in each year:
A C T I V E L E A R N
A C T I V E L E A R N
A C T I V E L E A R N
A C T I V E L E A R N
A C T I V E L E A R N
A C T I V E L E A R N
MEASURING A NATION’S INCOME
GDP and Economic Well-Being
Real GDP per capita is
MEASURING A NATION’S INCOME
GDP and Economic Well-Being
Real GDP per capita is

Gross Domestic Product…
“… does not allow for the health of our
Gross Domestic Product…
“… does not allow for the health of our
MEASURING A NATION’S INCOME
GDP Does Not Value:
the quality of the environment
leisure
MEASURING A NATION’S INCOME
GDP Does Not Value:
the quality of the environment
leisure
MEASURING A NATION’S INCOME
Then Why Do We Care About GDP?
Having a
MEASURING A NATION’S INCOME
Then Why Do We Care About GDP?
Having a
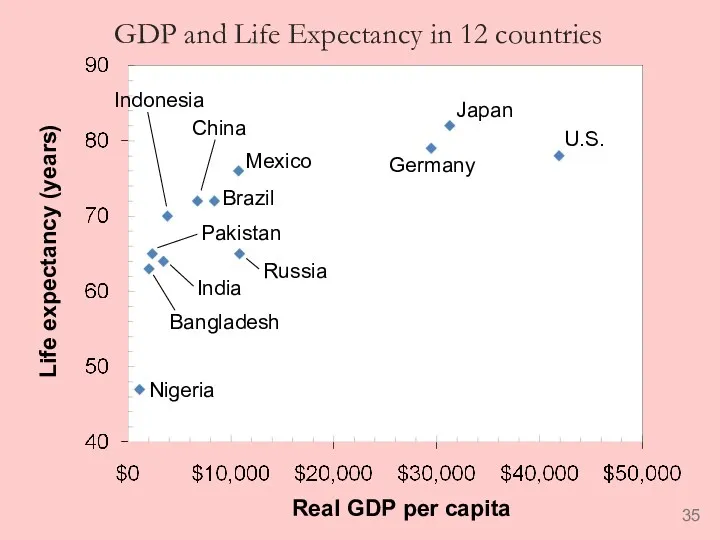
GDP and Life Expectancy in 12 countries
Life expectancy (years)
Real GDP per
GDP and Life Expectancy in 12 countries
Life expectancy (years)
Real GDP per
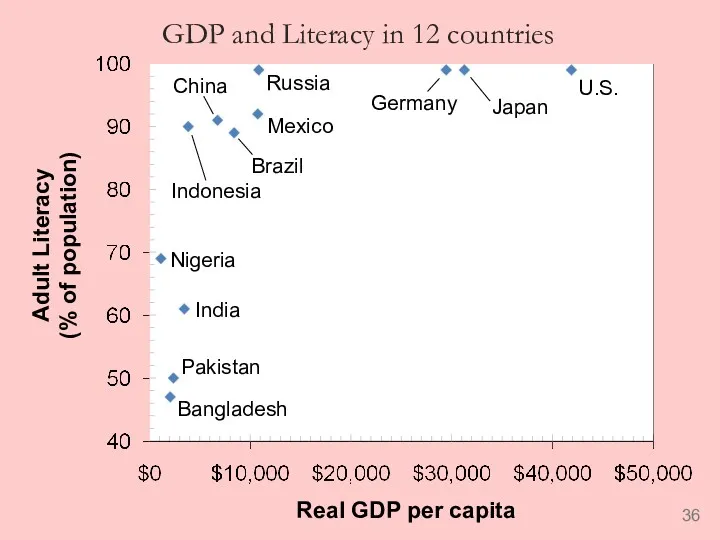
GDP and Literacy in 12 countries
Adult Literacy
(% of population)
Real GDP
GDP and Literacy in 12 countries
Adult Literacy
(% of population)
Real GDP
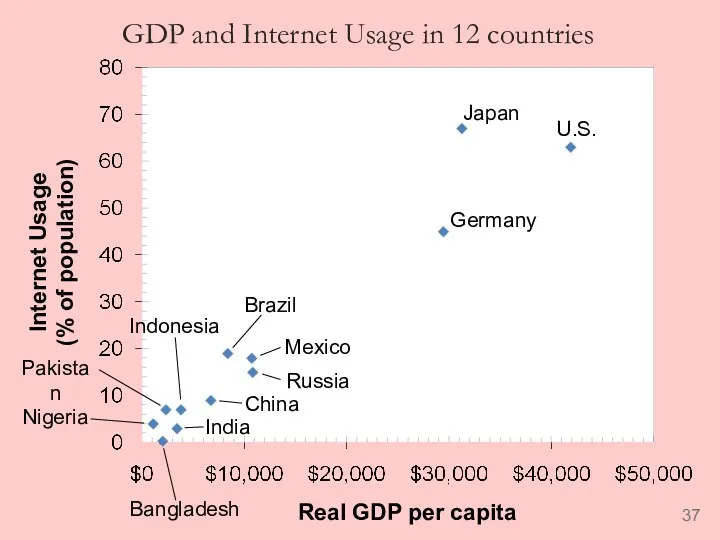
GDP and Internet Usage in 12 countries
Internet Usage
(% of population)
Real
GDP and Internet Usage in 12 countries
Internet Usage
(% of population)
Real
 Анализ производственной деятельности предприятия
 Введение в экономическую теорию. (Тема 1)
 Экономическая эффективность природопользования
 Финансовые и денежно-кредитные методы регулирования экономики
 Module structure
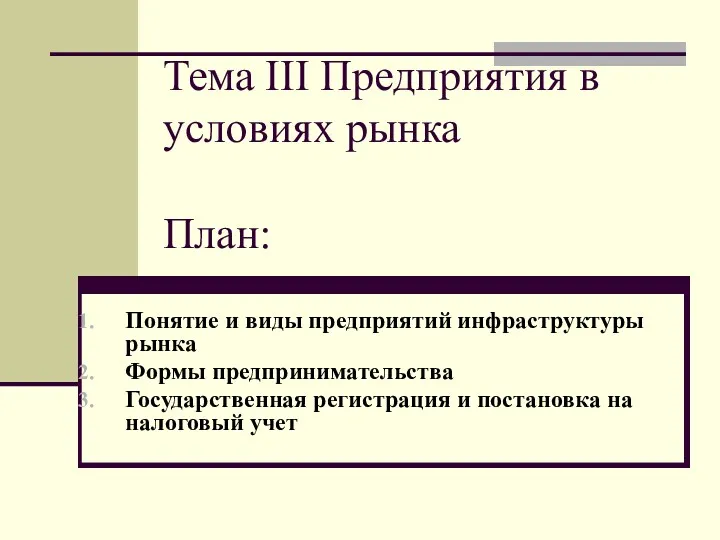 Предприятия в услових рынка. Тема 3
 Модели недропользования. Лицензия, соглашение о разделе продукции, концессия, сервисный контракт
 Макроэкономика. (Семинар 1)
 Роль экономики в жизни общества
 Особенности отраслевой структуры экономики Франции
 Экономика. Макроэкономика
 Макроэкономические условия решения профессиональных задач и их системный анализ. Экономические агенты в макроэкономике
 Мемлекеттік реттеу нысандары
 Внутренний и внешний туризм в России
 Сервисология. Сервисная деятельность
 Рыночная экономика
 Институты и организации
 Анализ спроса на рынке труда
 Мировая экономика и международные экономические отношения
 Экономика. Игра Alias
 Аудит түсінігі және оның мазмұны. Аудит принциптері
 John Maynard Keynes
 Регион как субъект устойчивого развития
 Определение потребной численности работников тяговой подстанции
 Макроэкономическая нестабильность: теория инфляции и модели антиинфляционной политики
 Совокупный спрос и совокупное предложение. Макроэкономическое равновесие
 Ринок праці. (Лекція 6)
 Денежно-кредитная политика государства