- Random walk theory and GBM

Содержание
- 2. Random walk theory Unpredictable changing of prices 50% of price increasing and 50% of price decreasing
- 3. BUBBLE- uncontrollable and sharp growth of prices
- 4. Bubble is a deviation of Random Walk Random Walk Bubble Brealay, 2014 S. Schachter, 1985
- 5. Historical bubble
- 6. GameStop an American video game, consumer electronics, and gaming merchandise retailer
- 7. Beginning of the situation GAMESTOP IS A STEAL. TRADING UP 20% ON THE DAY AND IT
- 8. CONSEQUENCES Lost up of funds in a few hours, or were lottery winners The losses of
- 9. CURRENT BUBBLE
- 10. INDUSTRY: Business intelligence and mobile software An American PUBLIC COMPANY with the revenue of $486 million
- 11. The trading volume of shares from march 2020 till January 2021 https://eikon.thomsonreuters.com/index.html
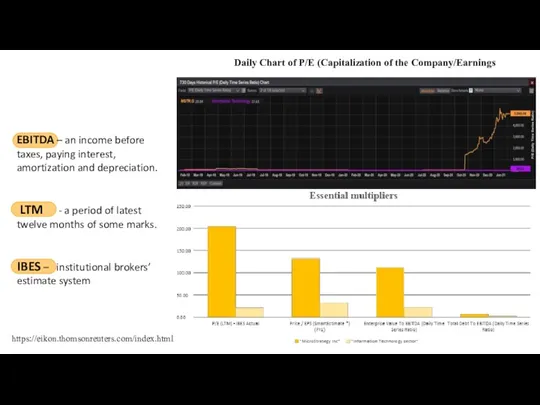
- 12. Profitability Analysis There are some initial coefficients which show the dynamic of the company’s development, they
- 13. Return on assets shows us the efficiency of the company, how it uses its assets and
- 14. The trading volume of shares from march 2020 till January 2021 https://eikon.thomsonreuters.com/index.html Daily Chart of P/E
- 15. the interest to the short swaps become more popular with the price of equity rises. For
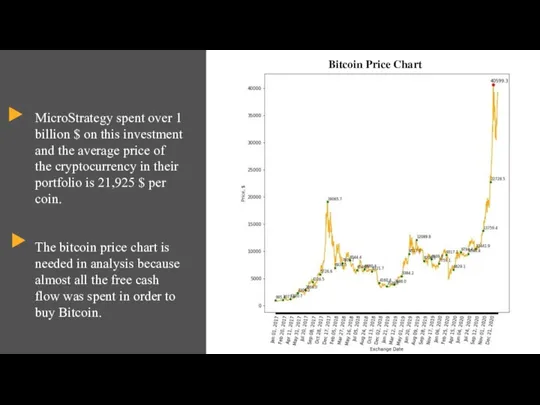
- 16. Bitcoin Price Chart MicroStrategy spent over 1 billion $ on this investment and the average price
- 17. Investors’ action The investors demonstrate a high interest to MicroStrategy shares as managers decided to invest
- 18. Sources 1. Schachter, S., Gerin, W., Hood, D. C., & Anderassen, P. (1985a). I. Was the
- 20. Скачать презентацию
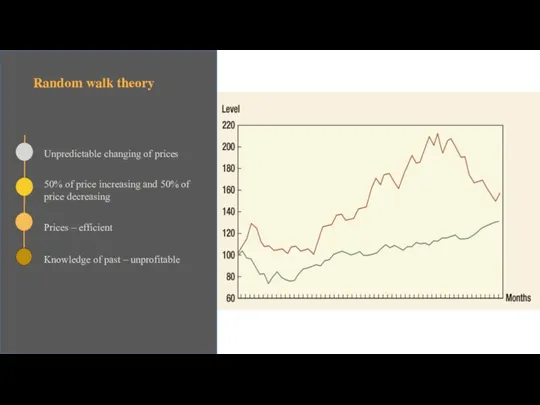
Random walk theory
Unpredictable changing of prices
50% of price increasing and 50%
Random walk theory
Unpredictable changing of prices
50% of price increasing and 50%

BUBBLE-
uncontrollable and sharp growth of prices
BUBBLE-
uncontrollable and sharp growth of prices
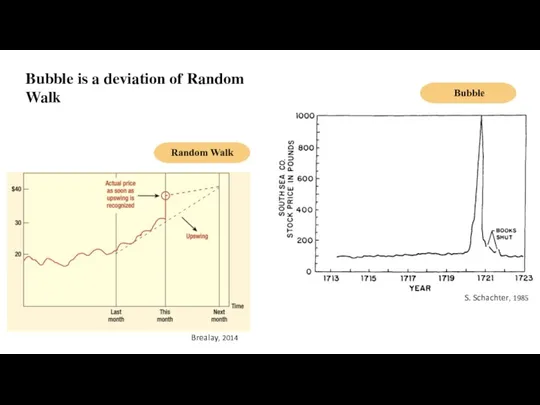
Bubble is a deviation of Random Walk
Random Walk
Bubble
Brealay, 2014
S. Schachter,
Bubble is a deviation of Random Walk
Random Walk
Bubble
Brealay, 2014
S. Schachter,

Historical bubble
Historical bubble
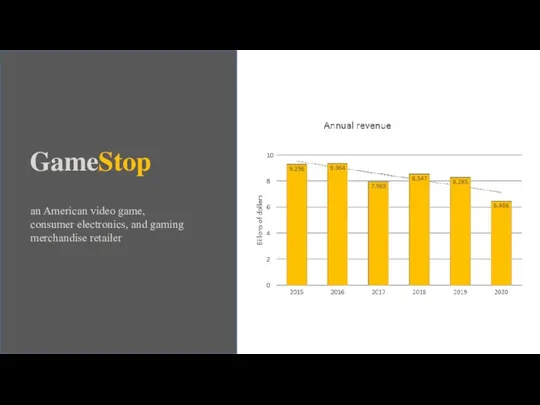
GameStop
an American video game, consumer electronics, and gaming merchandise retailer
GameStop
an American video game, consumer electronics, and gaming merchandise retailer
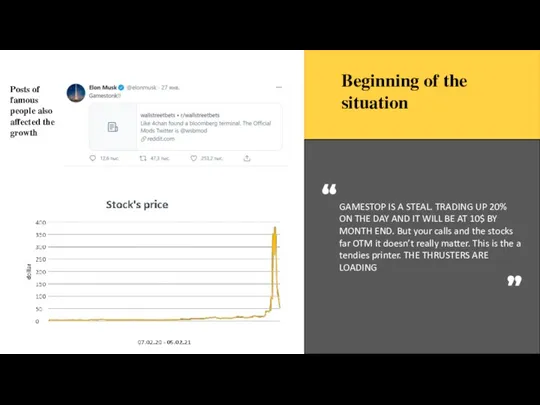
Beginning of the situation
GAMESTOP IS A STEAL. TRADING UP 20% ON
Beginning of the situation
GAMESTOP IS A STEAL. TRADING UP 20% ON
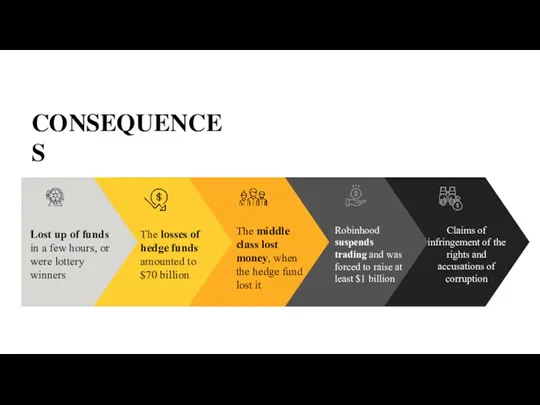
CONSEQUENCES
Lost up of funds
in a few hours, or were lottery
CONSEQUENCES
Lost up of funds in a few hours, or were lottery

CURRENT BUBBLE
CURRENT BUBBLE

INDUSTRY: Business intelligence and mobile software
An American PUBLIC COMPANY with the revenue
INDUSTRY: Business intelligence and mobile software
An American PUBLIC COMPANY with the revenue
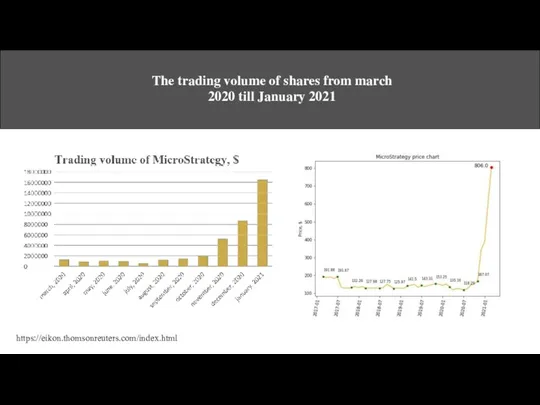
The trading volume of shares from march 2020 till January 2021
https://eikon.thomsonreuters.com/index.html
The trading volume of shares from march 2020 till January 2021
https://eikon.thomsonreuters.com/index.html
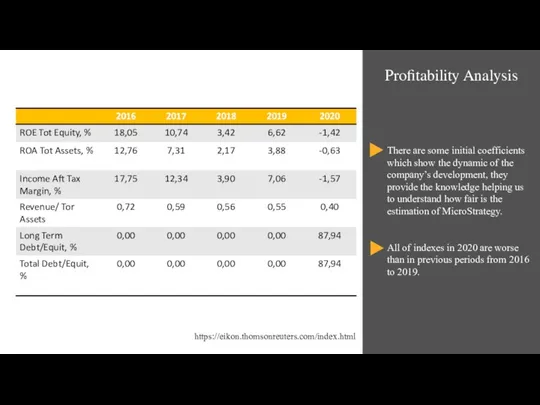
Profitability Analysis
There are some initial coefficients which show the dynamic of
Profitability Analysis
There are some initial coefficients which show the dynamic of
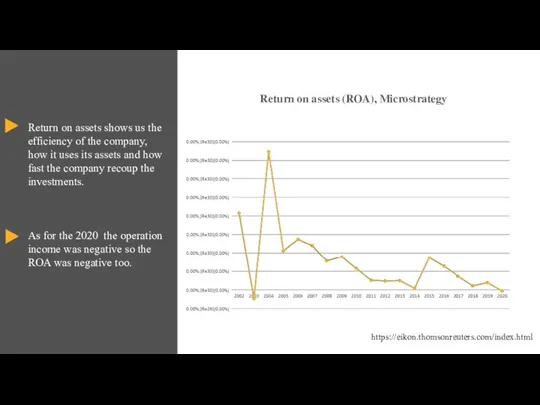
Return on assets shows us the efficiency of the company, how
Return on assets shows us the efficiency of the company, how
The trading volume of shares from march 2020 till January 2021
https://eikon.thomsonreuters.com/index.html
Daily
The trading volume of shares from march 2020 till January 2021
https://eikon.thomsonreuters.com/index.html
Daily
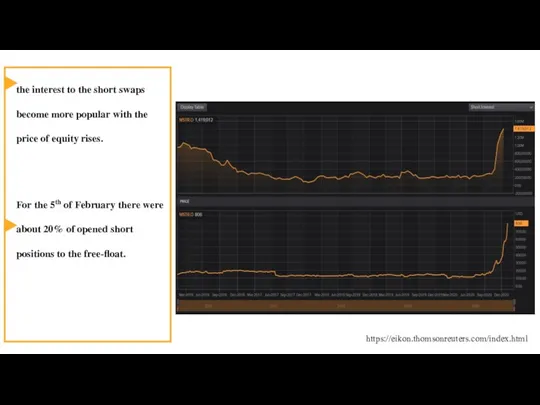
the interest to the short swaps become more popular with
the interest to the short swaps become more popular with
Bitcoin Price Chart
MicroStrategy spent over 1 billion $ on this investment
Bitcoin Price Chart
MicroStrategy spent over 1 billion $ on this investment
Investors’ action
The investors demonstrate a high interest to MicroStrategy shares as
Investors’ action
The investors demonstrate a high interest to MicroStrategy shares as
Sources
1. Schachter, S., Gerin, W., Hood, D. C., & Anderassen, P.
Sources
1. Schachter, S., Gerin, W., Hood, D. C., & Anderassen, P.
 Повышение эффективности предпринимательской деятельности малого предприятия на примере ООО Росстандарт
 Основы экономики организации. Модель разработки эффективной системы оплаты труда
 Стратегия экономического развития Санкт‑Петербурга на период до 2030 года
 Глобальна економічна політика. (Лекція 7)
 Протекционизм в международной торговле
 Роль финансовых рынков в социально экономическом развитии государства
 Эластичность спроса, ее виды и причины существования
 Ирвинг Фишер
 Система государственного стратегического планирования
 Біржа
Біржа Анализ формирования и исполнения бюджета пенсионного фонда РФ
 Лесное хозяйство
 Кәсіпорынының негізгі қорлары
 Эластичность спроса и предложения. Тема 6
 Меншік және әлеуметтік экономика
 Экономика экологической безопасности
 Управление качеством
 Ұсыныс қисығының жылжуы. Ұсыныстың икемділігі
 Экономическая и социальная политика государства
 Innovation attractiveness of the region
 Екологічна та енергетична проблеми у світі. Способи їх вирішення
 Комплексная оценка эффективности деятельности коммерческой организации
 Externalitäten und öffentliche Güter
 Лекция № 12. Основные макроэкономические показатели
 Микроэкономика. Макроэкономика
 Світовий ринок товарів та послуг
 spros_vsyo
 Макроэкономика после Дж.М. Кейнса