- The data of macroeconomics

Содержание
- 2. CHAPTER 2 The Data of Macroeconomics In this chapter, you will learn… …the meaning and measurement
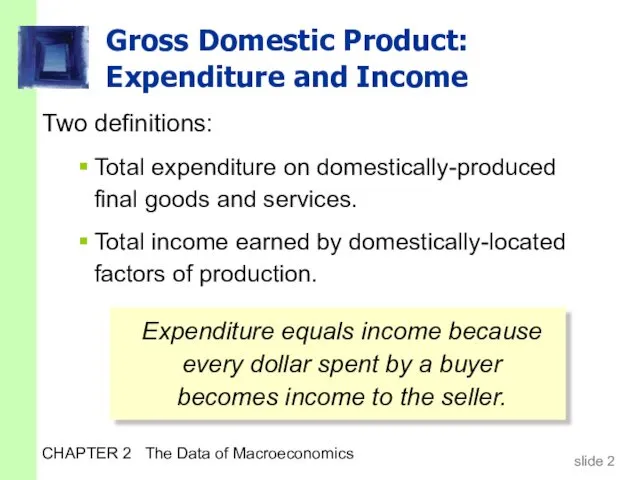
- 3. CHAPTER 2 The Data of Macroeconomics Gross Domestic Product: Expenditure and Income Two definitions: Total expenditure
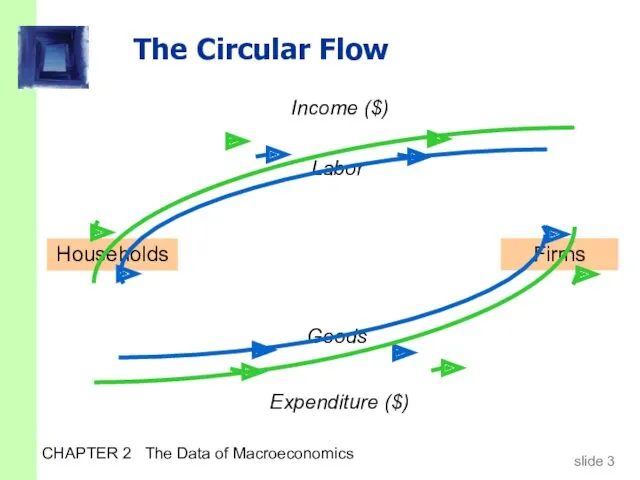
- 4. CHAPTER 2 The Data of Macroeconomics The Circular Flow Households Firms
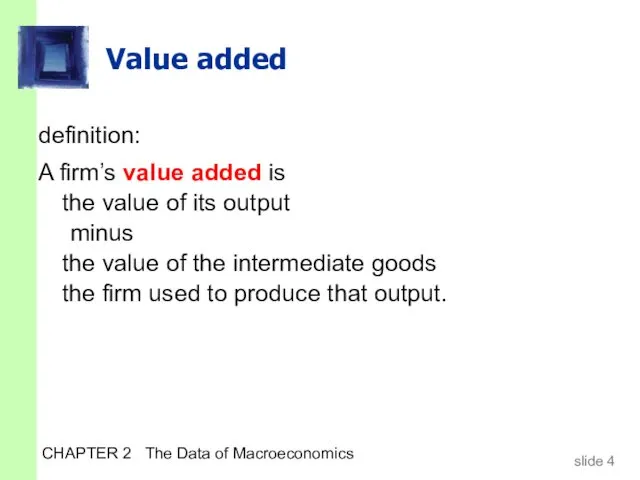
- 5. CHAPTER 2 The Data of Macroeconomics Value added definition: A firm’s value added is the value
- 6. CHAPTER 2 The Data of Macroeconomics Exercise: (Problem 2, p. 40) A farmer grows a bushel
- 7. CHAPTER 2 The Data of Macroeconomics Final goods, value added, and GDP GDP = value of
- 8. CHAPTER 2 The Data of Macroeconomics The expenditure components of GDP consumption investment government spending net
- 9. CHAPTER 2 The Data of Macroeconomics Consumption (C) durable goods last a long time ex: cars,
- 10. CHAPTER 2 The Data of Macroeconomics U.S. consumption, 2005 70.0% $8,745.7
- 11. CHAPTER 2 The Data of Macroeconomics Investment (I) Definition 1: Spending on [the factor of production]
- 12. CHAPTER 2 The Data of Macroeconomics U.S. investment, 2005 16.9% $2,105.0
- 13. CHAPTER 2 The Data of Macroeconomics Investment vs. Capital Note: Investment is spending on new capital.
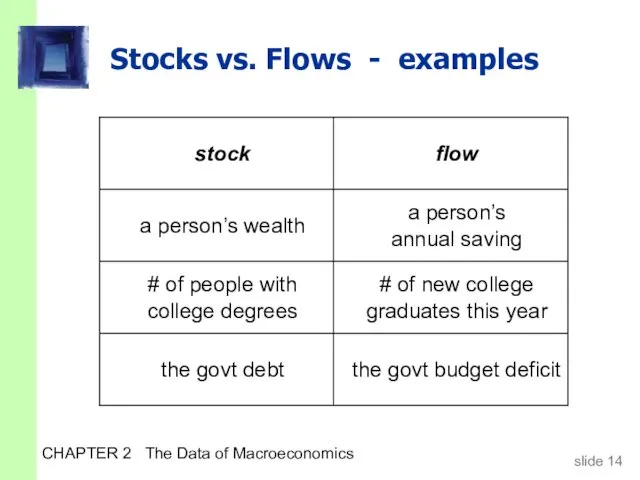
- 14. CHAPTER 2 The Data of Macroeconomics Stocks vs. Flows A flow is a quantity measured per
- 15. CHAPTER 2 The Data of Macroeconomics Stocks vs. Flows - examples the govt budget deficit the
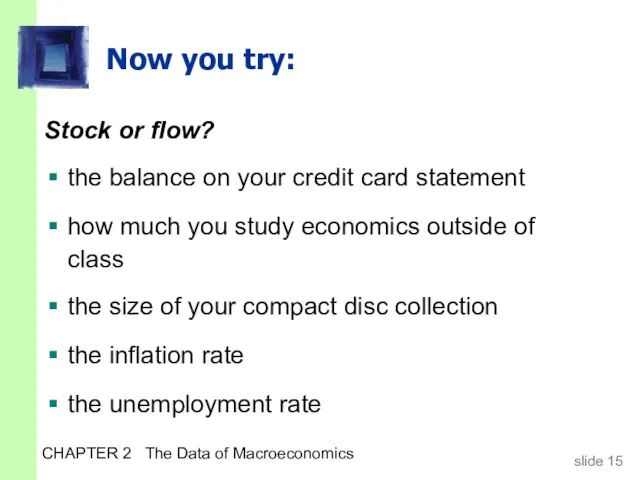
- 16. CHAPTER 2 The Data of Macroeconomics Now you try: Stock or flow? the balance on your
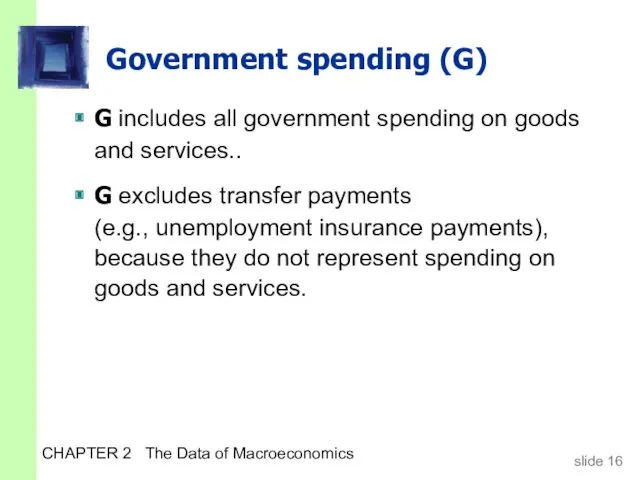
- 17. CHAPTER 2 The Data of Macroeconomics Government spending (G) G includes all government spending on goods
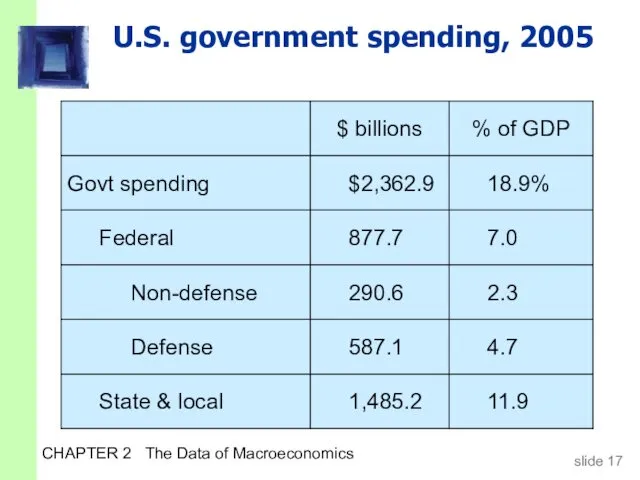
- 18. CHAPTER 2 The Data of Macroeconomics U.S. government spending, 2005 Federal 18.9% $2,362.9 Govt spending State
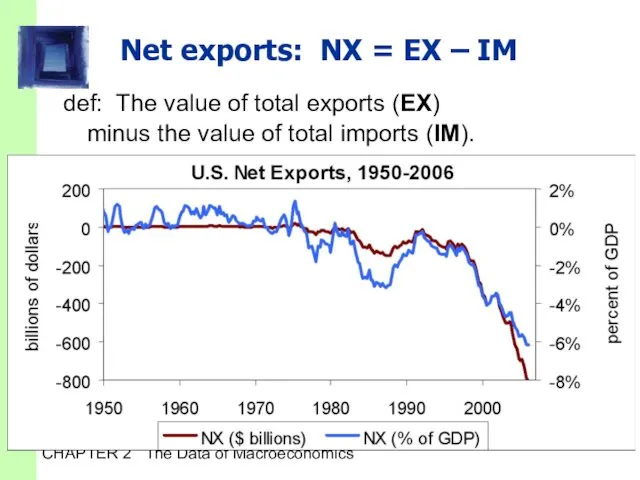
- 19. CHAPTER 2 The Data of Macroeconomics Net exports: NX = EX – IM def: The value
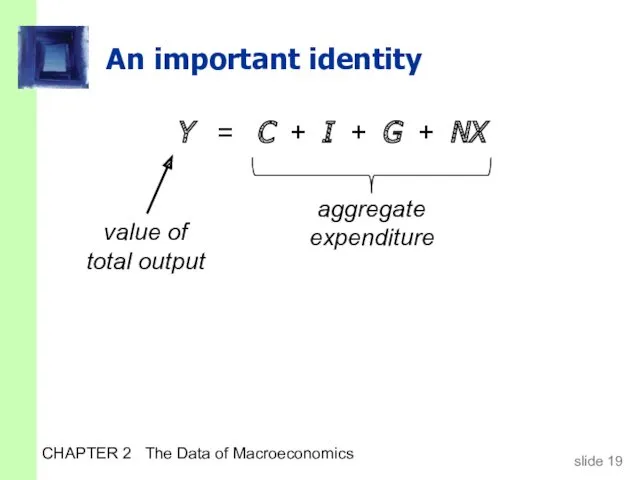
- 20. CHAPTER 2 The Data of Macroeconomics An important identity Y = C + I + G
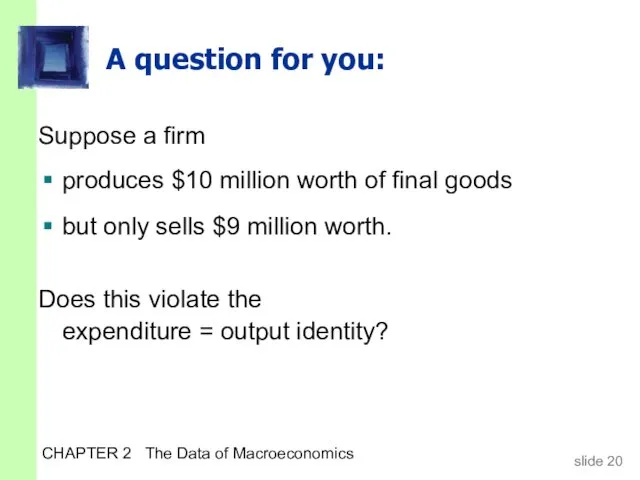
- 21. CHAPTER 2 The Data of Macroeconomics A question for you: Suppose a firm produces $10 million
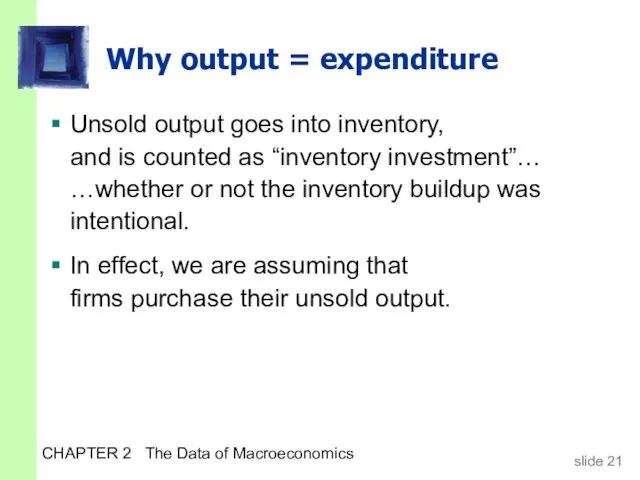
- 22. CHAPTER 2 The Data of Macroeconomics Why output = expenditure Unsold output goes into inventory, and
- 23. CHAPTER 2 The Data of Macroeconomics GDP: An important and versatile concept We have now seen
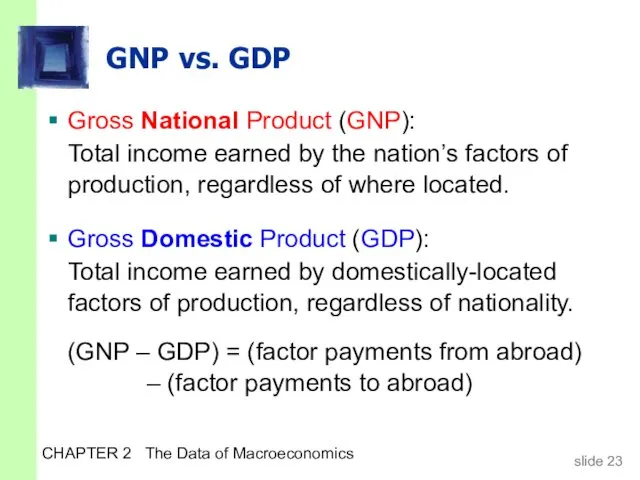
- 24. CHAPTER 2 The Data of Macroeconomics GNP vs. GDP Gross National Product (GNP): Total income earned
- 25. CHAPTER 2 The Data of Macroeconomics Discussion question: In your country, which would you want to
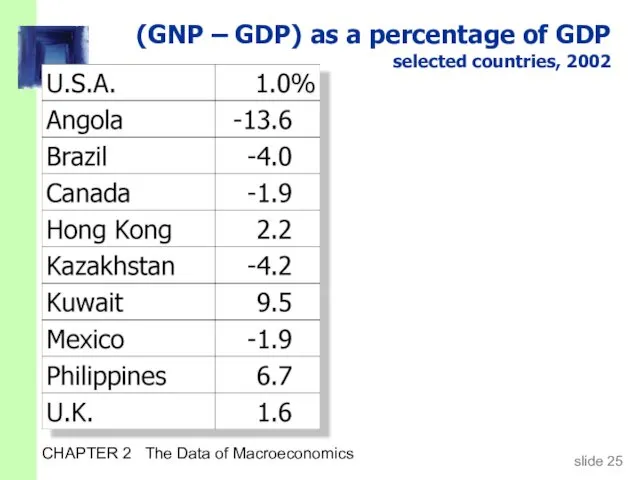
- 26. CHAPTER 2 The Data of Macroeconomics (GNP – GDP) as a percentage of GDP selected countries,
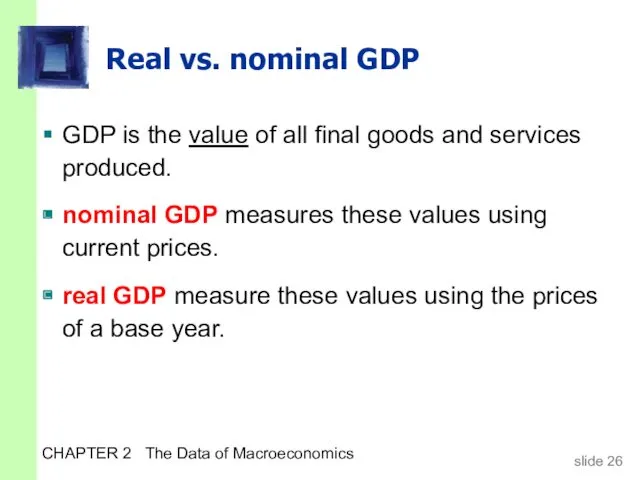
- 27. CHAPTER 2 The Data of Macroeconomics Real vs. nominal GDP GDP is the value of all
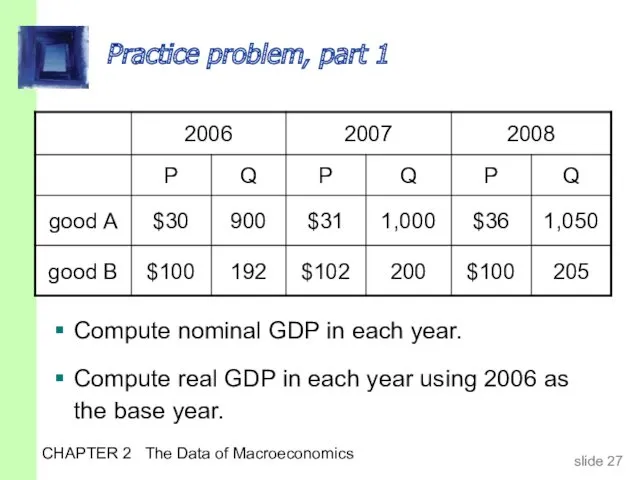
- 28. CHAPTER 2 The Data of Macroeconomics Practice problem, part 1 Compute nominal GDP in each year.
- 29. CHAPTER 2 The Data of Macroeconomics Answers to practice problem, part 1 nominal GDP multiply Ps
- 30. CHAPTER 2 The Data of Macroeconomics Real GDP controls for inflation Changes in nominal GDP can
- 31. CHAPTER 2 The Data of Macroeconomics U.S. Nominal and Real GDP, 1950–2006 Nominal GDP Real GDP
- 32. CHAPTER 2 The Data of Macroeconomics GDP Deflator The inflation rate is the percentage increase in
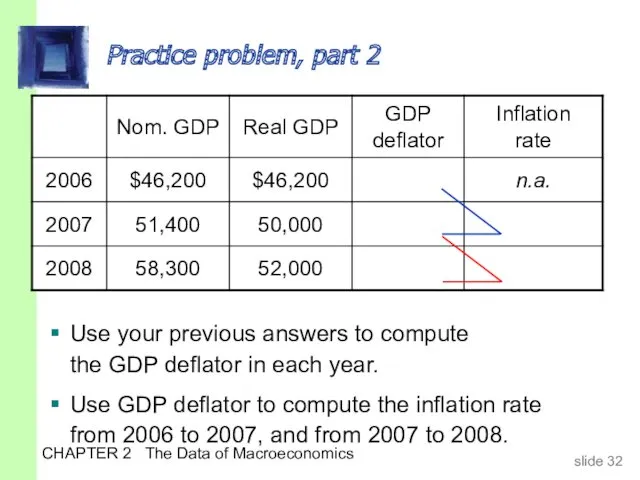
- 33. CHAPTER 2 The Data of Macroeconomics Practice problem, part 2 Use your previous answers to compute
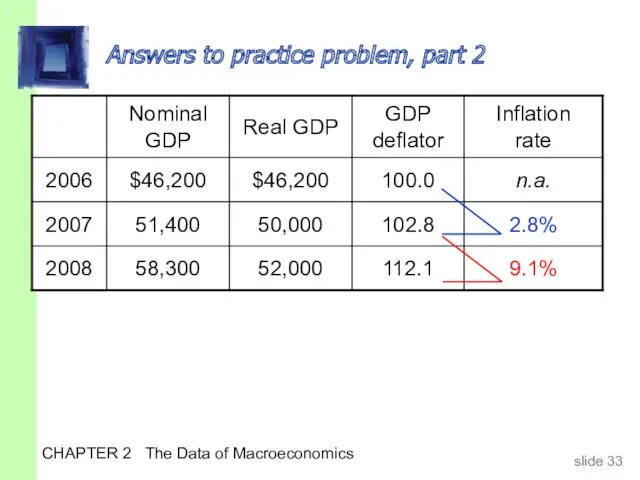
- 34. CHAPTER 2 The Data of Macroeconomics Answers to practice problem, part 2
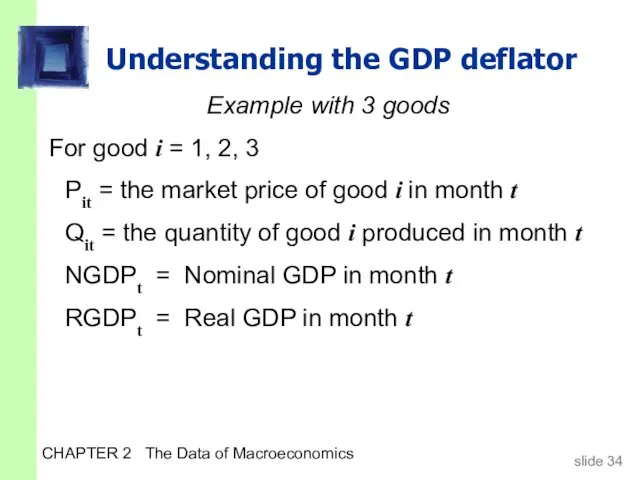
- 35. CHAPTER 2 The Data of Macroeconomics Understanding the GDP deflator Example with 3 goods For good
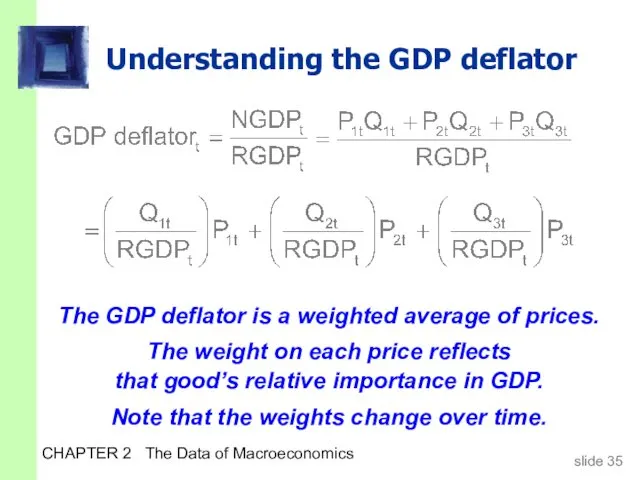
- 36. CHAPTER 2 The Data of Macroeconomics Understanding the GDP deflator The GDP deflator is a weighted
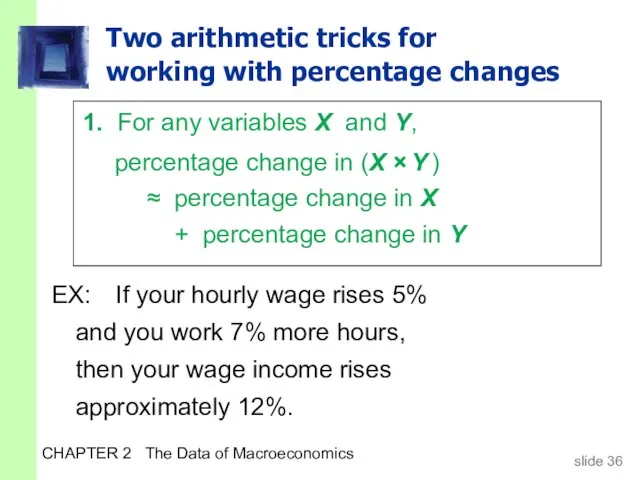
- 37. CHAPTER 2 The Data of Macroeconomics Two arithmetic tricks for working with percentage changes EX: If
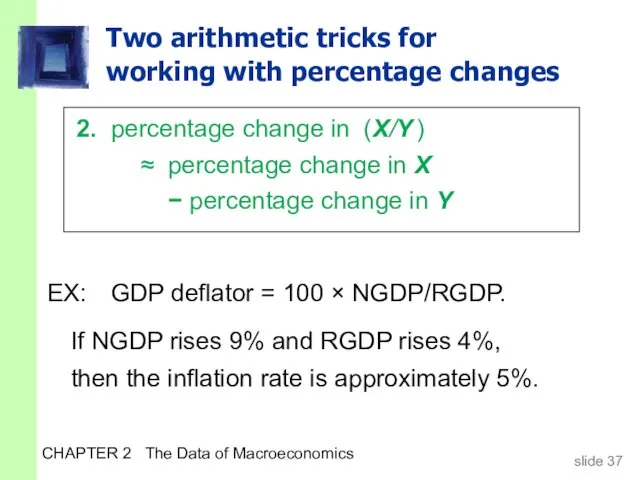
- 38. CHAPTER 2 The Data of Macroeconomics Two arithmetic tricks for working with percentage changes EX: GDP
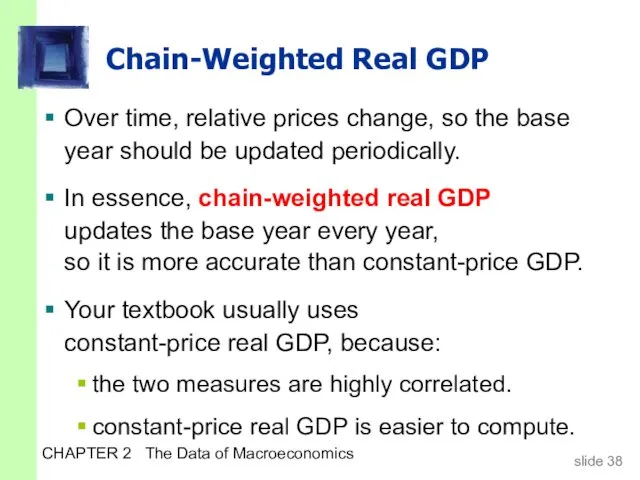
- 39. CHAPTER 2 The Data of Macroeconomics Chain-Weighted Real GDP Over time, relative prices change, so the
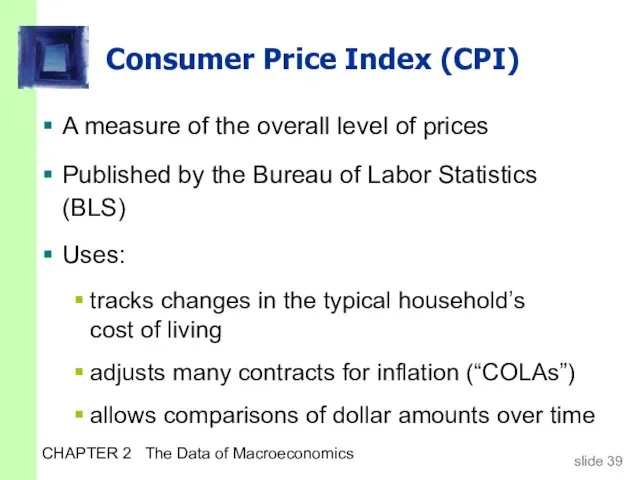
- 40. CHAPTER 2 The Data of Macroeconomics Consumer Price Index (CPI) A measure of the overall level
- 41. CHAPTER 2 The Data of Macroeconomics How the BLS constructs the CPI 1. Survey consumers to
- 42. CHAPTER 2 The Data of Macroeconomics Exercise: Compute the CPI Basket contains 20 pizzas and 10
- 43. CHAPTER 2 The Data of Macroeconomics Cost of Inflation basket CPI rate 2002 $350 100.0 n.a.
- 44. CHAPTER 2 The Data of Macroeconomics The composition of the CPI’s “basket”
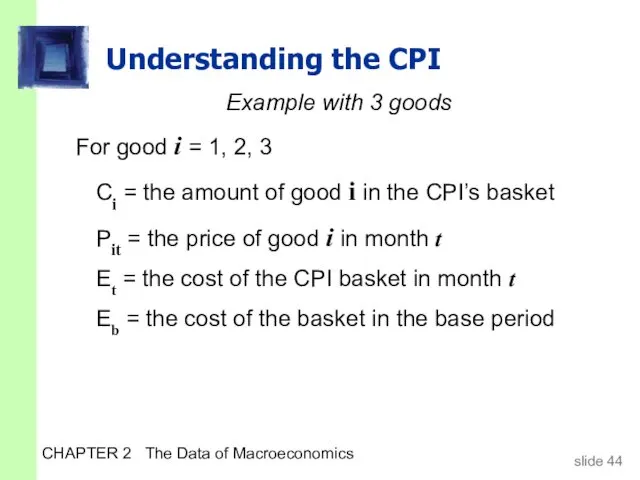
- 45. CHAPTER 2 The Data of Macroeconomics Understanding the CPI Example with 3 goods For good i
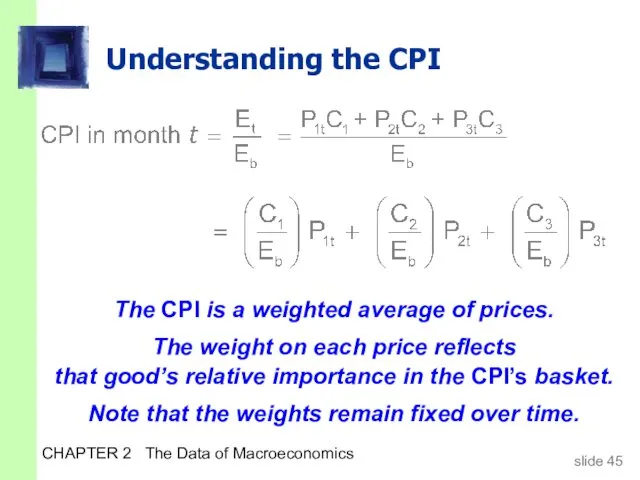
- 46. CHAPTER 2 The Data of Macroeconomics Understanding the CPI The CPI is a weighted average of
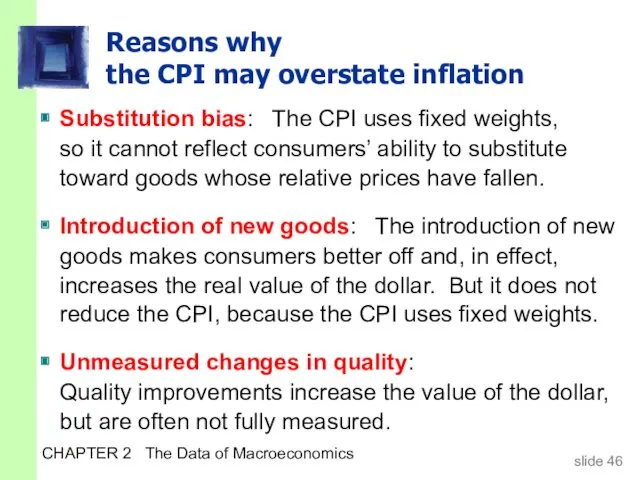
- 47. CHAPTER 2 The Data of Macroeconomics Reasons why the CPI may overstate inflation Substitution bias: The
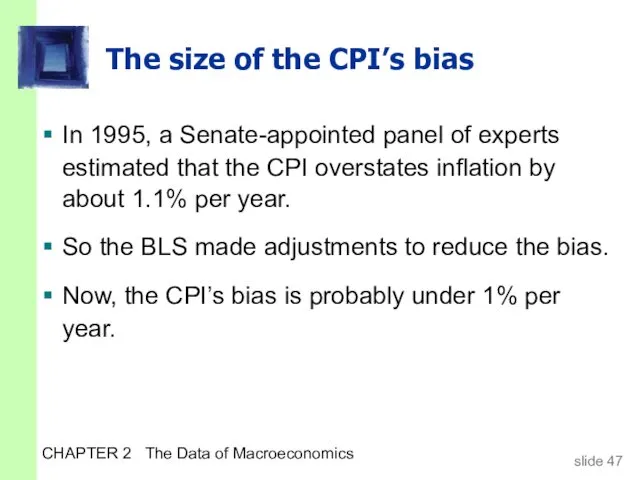
- 48. CHAPTER 2 The Data of Macroeconomics The size of the CPI’s bias In 1995, a Senate-appointed
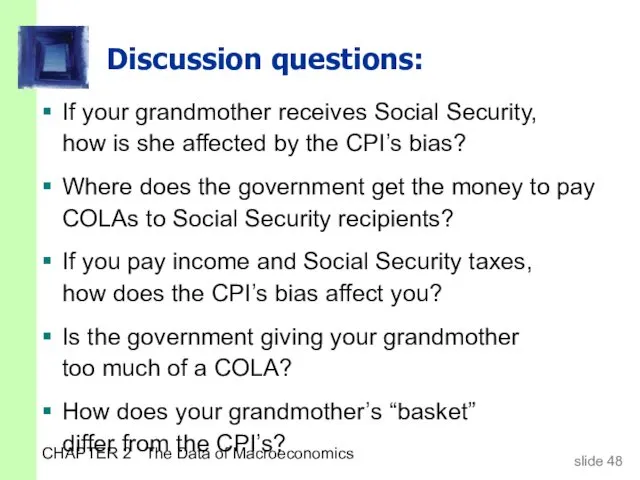
- 49. CHAPTER 2 The Data of Macroeconomics Discussion questions: If your grandmother receives Social Security, how is
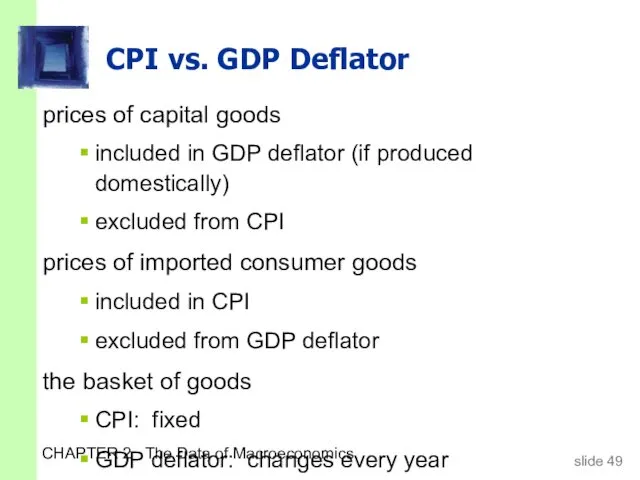
- 50. CHAPTER 2 The Data of Macroeconomics CPI vs. GDP Deflator prices of capital goods included in
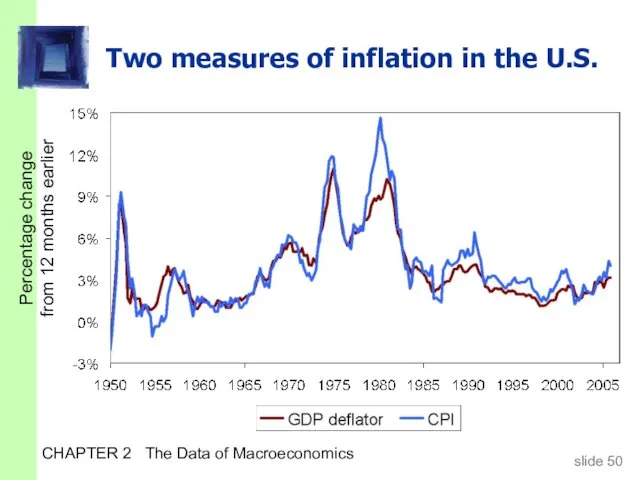
- 51. CHAPTER 2 The Data of Macroeconomics Two measures of inflation in the U.S. Percentage change from
- 52. CHAPTER 2 The Data of Macroeconomics Categories of the population employed working at a paid job
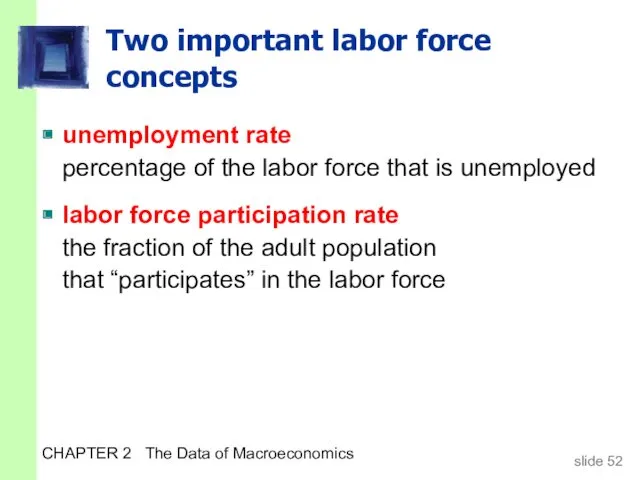
- 53. CHAPTER 2 The Data of Macroeconomics Two important labor force concepts unemployment rate percentage of the
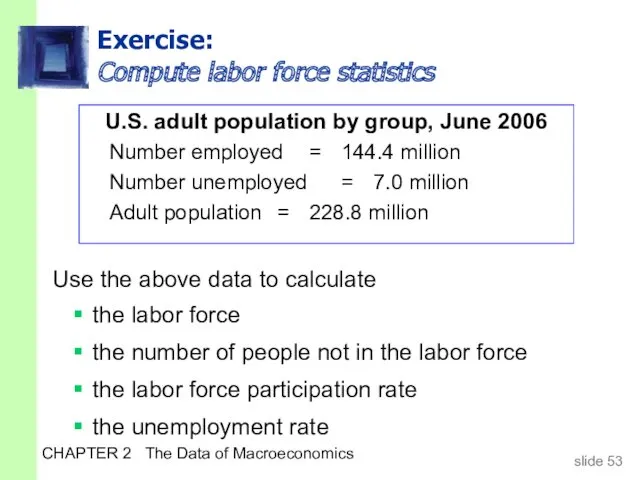
- 54. CHAPTER 2 The Data of Macroeconomics Exercise: Compute labor force statistics U.S. adult population by group,
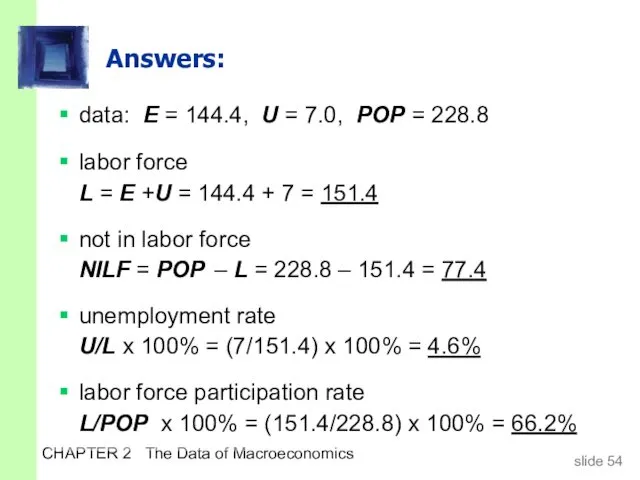
- 55. CHAPTER 2 The Data of Macroeconomics Answers: data: E = 144.4, U = 7.0, POP =
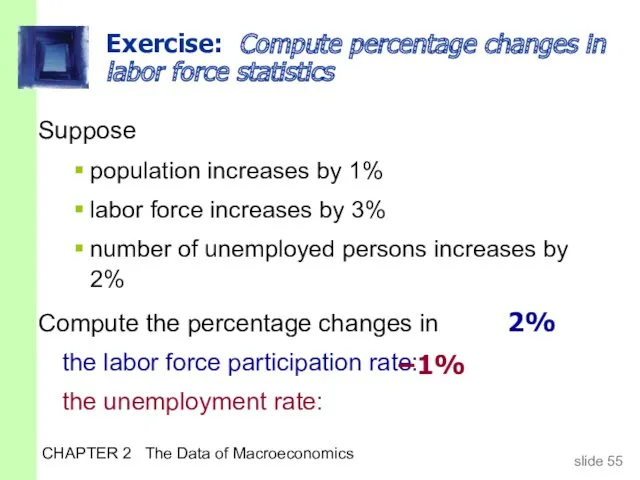
- 56. CHAPTER 2 The Data of Macroeconomics Exercise: Compute percentage changes in labor force statistics Suppose population
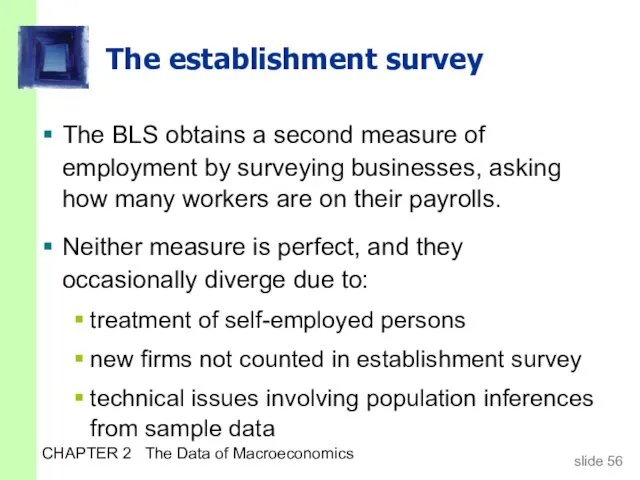
- 57. CHAPTER 2 The Data of Macroeconomics The establishment survey The BLS obtains a second measure of
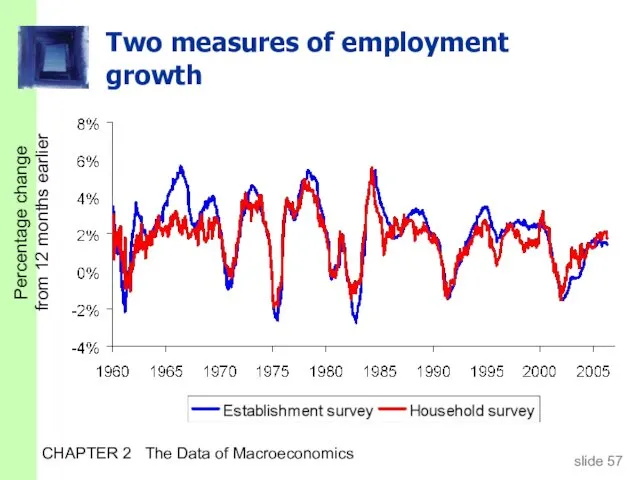
- 58. CHAPTER 2 The Data of Macroeconomics Two measures of employment growth Percentage change from 12 months
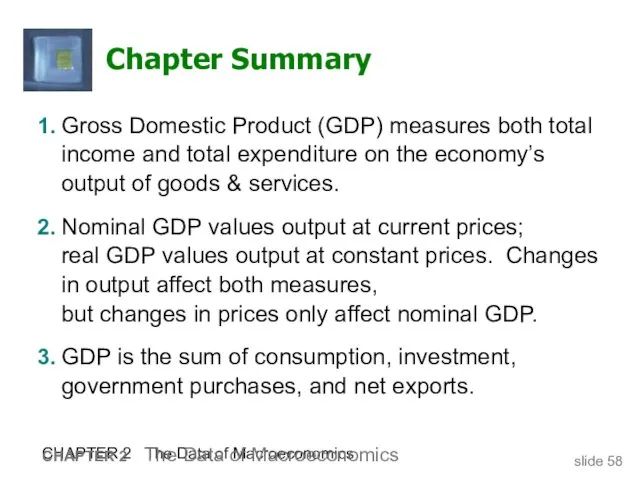
- 59. CHAPTER 2 The Data of Macroeconomics Chapter Summary 1. Gross Domestic Product (GDP) measures both total
- 61. Скачать презентацию
CHAPTER 2 The Data of Macroeconomics
In this chapter, you will learn…
…the
CHAPTER 2 The Data of Macroeconomics
In this chapter, you will learn…
…the
CHAPTER 2 The Data of Macroeconomics
Gross Domestic Product: Expenditure and Income
Two
CHAPTER 2 The Data of Macroeconomics
Gross Domestic Product: Expenditure and Income
Two
CHAPTER 2 The Data of Macroeconomics
The Circular Flow
Households
Firms
CHAPTER 2 The Data of Macroeconomics
The Circular Flow
Households
Firms
CHAPTER 2 The Data of Macroeconomics
Value added
definition:
A firm’s value added
CHAPTER 2 The Data of Macroeconomics
Value added
definition:
A firm’s value added
CHAPTER 2 The Data of Macroeconomics
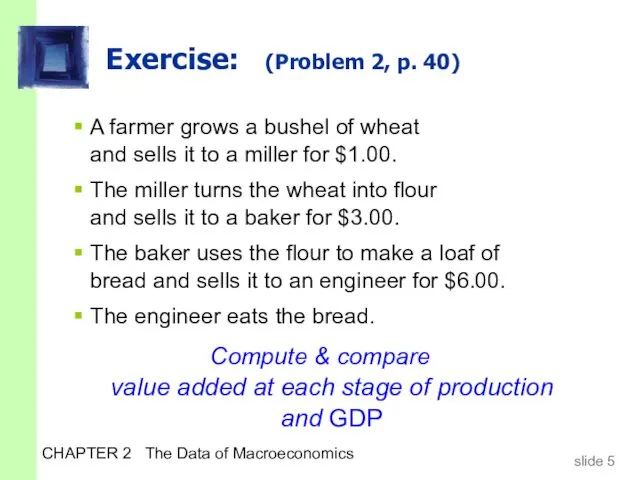
Exercise: (Problem 2, p. 40)
A farmer
CHAPTER 2 The Data of Macroeconomics
Exercise: (Problem 2, p. 40)
A farmer
CHAPTER 2 The Data of Macroeconomics
Final goods, value added, and GDP
GDP
CHAPTER 2 The Data of Macroeconomics
Final goods, value added, and GDP
GDP
CHAPTER 2 The Data of Macroeconomics
The expenditure components of GDP
consumption
investment
government spending
net
CHAPTER 2 The Data of Macroeconomics
The expenditure components of GDP
consumption
investment
government spending
net
CHAPTER 2 The Data of Macroeconomics
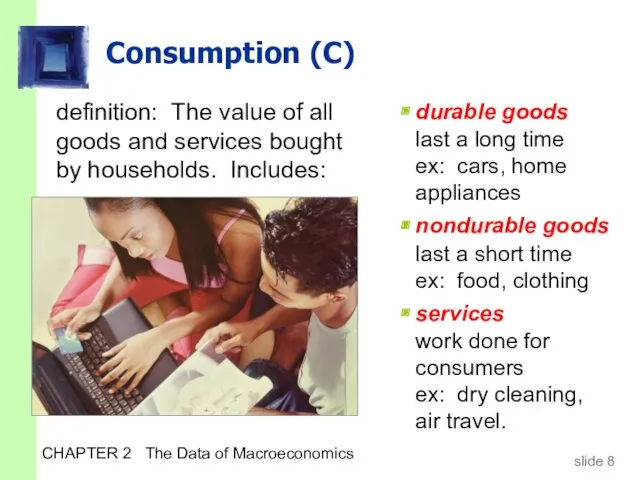
Consumption (C)
durable goods
last a long
CHAPTER 2 The Data of Macroeconomics
Consumption (C)
durable goods last a long

CHAPTER 2 The Data of Macroeconomics
U.S. consumption, 2005
70.0%
$8,745.7
CHAPTER 2 The Data of Macroeconomics
U.S. consumption, 2005
70.0%
$8,745.7
CHAPTER 2 The Data of Macroeconomics
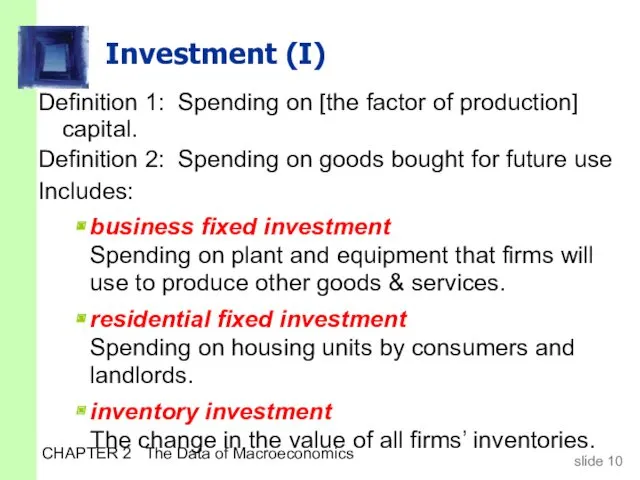
Investment (I)
Definition 1: Spending on [the
CHAPTER 2 The Data of Macroeconomics
Investment (I)
Definition 1: Spending on [the
CHAPTER 2 The Data of Macroeconomics
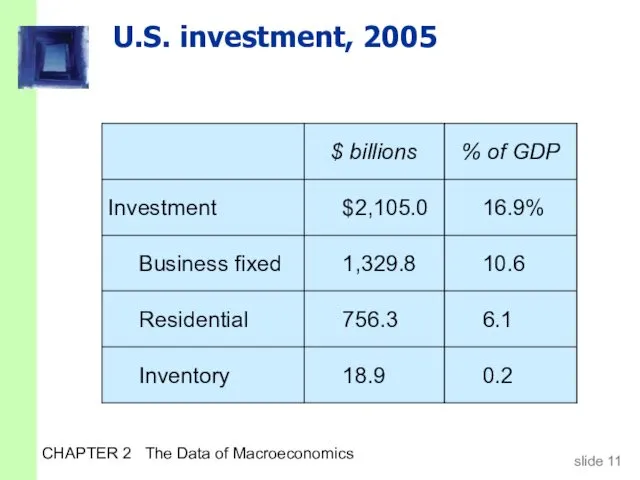
U.S. investment, 2005
16.9%
$2,105.0
CHAPTER 2 The Data of Macroeconomics
U.S. investment, 2005
16.9%
$2,105.0
CHAPTER 2 The Data of Macroeconomics
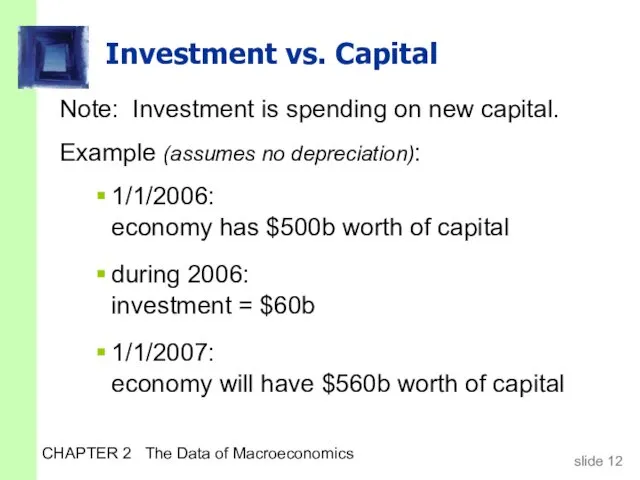
Investment vs. Capital
Note: Investment is spending
CHAPTER 2 The Data of Macroeconomics
Investment vs. Capital
Note: Investment is spending
CHAPTER 2 The Data of Macroeconomics
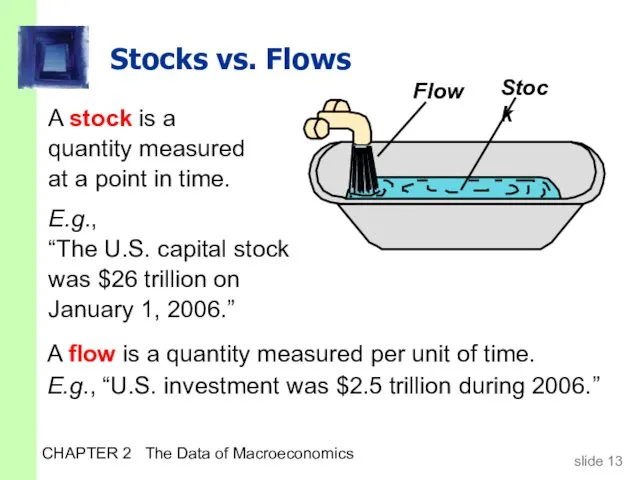
Stocks vs. Flows
A flow is a
CHAPTER 2 The Data of Macroeconomics
Stocks vs. Flows
A flow is a
CHAPTER 2 The Data of Macroeconomics
Stocks vs. Flows - examples
the govt
CHAPTER 2 The Data of Macroeconomics
Stocks vs. Flows - examples
the govt
CHAPTER 2 The Data of Macroeconomics
Now you try:
Stock or flow?
the
CHAPTER 2 The Data of Macroeconomics
Now you try:
Stock or flow?
the
CHAPTER 2 The Data of Macroeconomics
Government spending (G)
G includes all government
CHAPTER 2 The Data of Macroeconomics
Government spending (G)
G includes all government
CHAPTER 2 The Data of Macroeconomics
U.S. government spending, 2005
Federal
18.9%
$2,362.9
Govt spending
State &
CHAPTER 2 The Data of Macroeconomics
U.S. government spending, 2005
Federal
18.9%
$2,362.9
Govt spending
State &
CHAPTER 2 The Data of Macroeconomics
Net exports: NX = EX –
CHAPTER 2 The Data of Macroeconomics
Net exports: NX = EX –
CHAPTER 2 The Data of Macroeconomics
An important identity
Y = C +
CHAPTER 2 The Data of Macroeconomics
An important identity
Y = C +
CHAPTER 2 The Data of Macroeconomics
A question for you:
Suppose a firm
CHAPTER 2 The Data of Macroeconomics
A question for you:
Suppose a firm
CHAPTER 2 The Data of Macroeconomics
Why output = expenditure
Unsold output goes
CHAPTER 2 The Data of Macroeconomics
Why output = expenditure
Unsold output goes

CHAPTER 2 The Data of Macroeconomics
GDP:
An important and versatile concept
We
CHAPTER 2 The Data of Macroeconomics
GDP:
An important and versatile concept
We
CHAPTER 2 The Data of Macroeconomics
GNP vs. GDP
Gross National Product (GNP):
CHAPTER 2 The Data of Macroeconomics
GNP vs. GDP
Gross National Product (GNP):

CHAPTER 2 The Data of Macroeconomics
Discussion question:
In your country,
which would
CHAPTER 2 The Data of Macroeconomics
Discussion question:
In your country, which would
CHAPTER 2 The Data of Macroeconomics
(GNP – GDP) as a percentage
CHAPTER 2 The Data of Macroeconomics
(GNP – GDP) as a percentage
CHAPTER 2 The Data of Macroeconomics
Real vs. nominal GDP
GDP is the
CHAPTER 2 The Data of Macroeconomics
Real vs. nominal GDP
GDP is the
CHAPTER 2 The Data of Macroeconomics
Practice problem, part 1
Compute nominal GDP
CHAPTER 2 The Data of Macroeconomics
Practice problem, part 1
Compute nominal GDP
CHAPTER 2 The Data of Macroeconomics
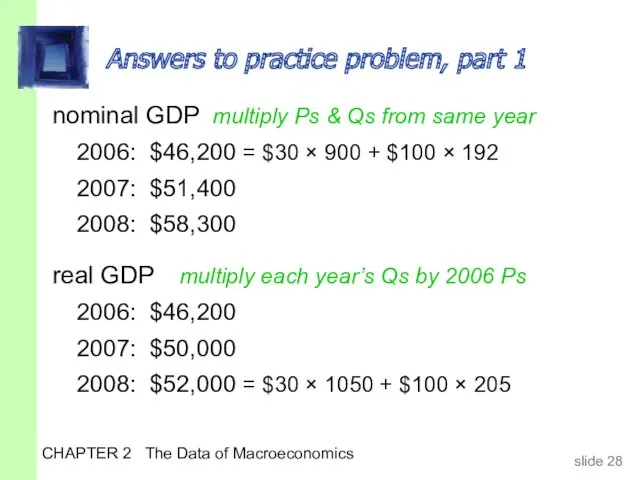
Answers to practice problem, part 1
nominal
CHAPTER 2 The Data of Macroeconomics
Answers to practice problem, part 1
nominal
CHAPTER 2 The Data of Macroeconomics
Real GDP controls for inflation
Changes in
CHAPTER 2 The Data of Macroeconomics
Real GDP controls for inflation
Changes in
CHAPTER 2 The Data of Macroeconomics
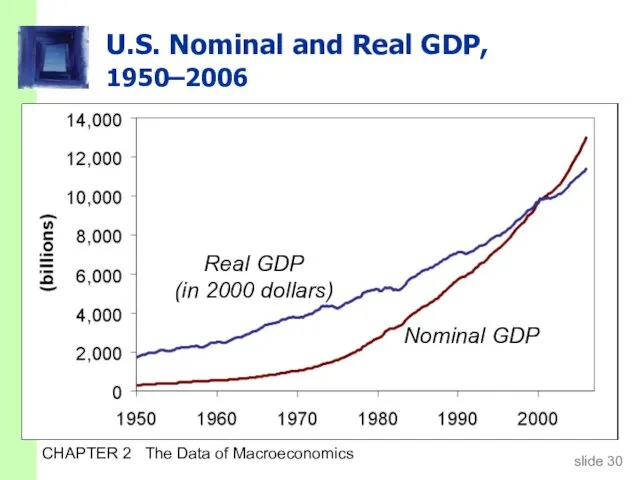
U.S. Nominal and Real GDP,
1950–2006
Nominal
CHAPTER 2 The Data of Macroeconomics
U.S. Nominal and Real GDP,
1950–2006
Nominal
CHAPTER 2 The Data of Macroeconomics
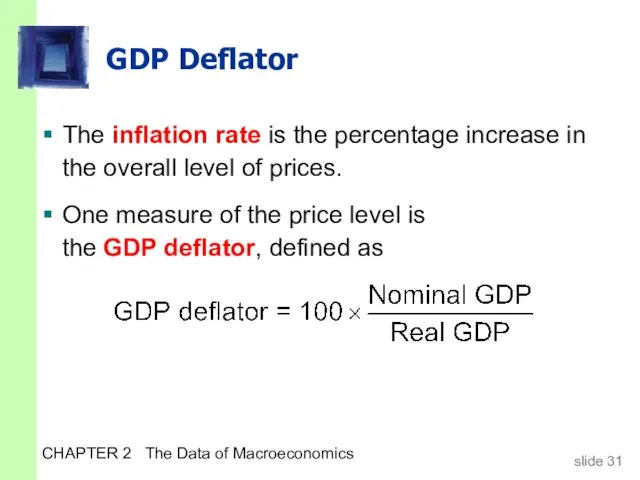
GDP Deflator
The inflation rate is the
CHAPTER 2 The Data of Macroeconomics
GDP Deflator
The inflation rate is the
CHAPTER 2 The Data of Macroeconomics
Practice problem, part 2
Use your previous
CHAPTER 2 The Data of Macroeconomics
Practice problem, part 2
Use your previous
CHAPTER 2 The Data of Macroeconomics
Answers to practice problem, part 2
CHAPTER 2 The Data of Macroeconomics
Answers to practice problem, part 2
CHAPTER 2 The Data of Macroeconomics
Understanding the GDP deflator
Example with 3
CHAPTER 2 The Data of Macroeconomics
Understanding the GDP deflator
Example with 3
CHAPTER 2 The Data of Macroeconomics
Understanding the GDP deflator
The GDP deflator
CHAPTER 2 The Data of Macroeconomics
Understanding the GDP deflator
The GDP deflator
CHAPTER 2 The Data of Macroeconomics
Two arithmetic tricks for
working with
CHAPTER 2 The Data of Macroeconomics
Two arithmetic tricks for working with
CHAPTER 2 The Data of Macroeconomics
Two arithmetic tricks for
working with
CHAPTER 2 The Data of Macroeconomics
Two arithmetic tricks for working with
CHAPTER 2 The Data of Macroeconomics
Chain-Weighted Real GDP
Over time, relative prices
CHAPTER 2 The Data of Macroeconomics
Chain-Weighted Real GDP
Over time, relative prices
CHAPTER 2 The Data of Macroeconomics
Consumer Price Index (CPI)
A measure of
CHAPTER 2 The Data of Macroeconomics
Consumer Price Index (CPI)
A measure of
CHAPTER 2 The Data of Macroeconomics
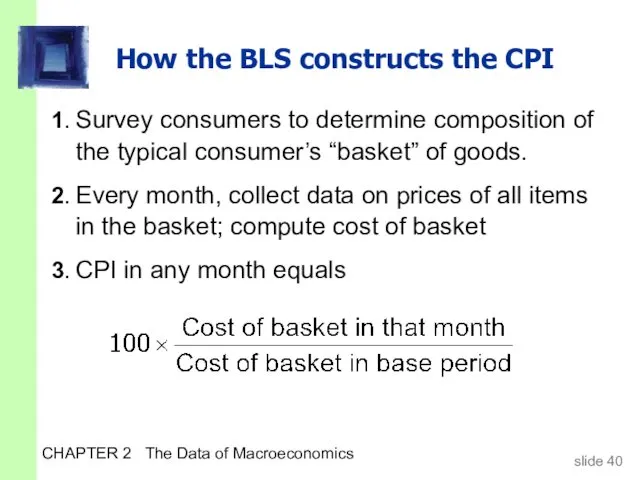
How the BLS constructs the CPI
1. Survey
CHAPTER 2 The Data of Macroeconomics
How the BLS constructs the CPI
1. Survey
CHAPTER 2 The Data of Macroeconomics
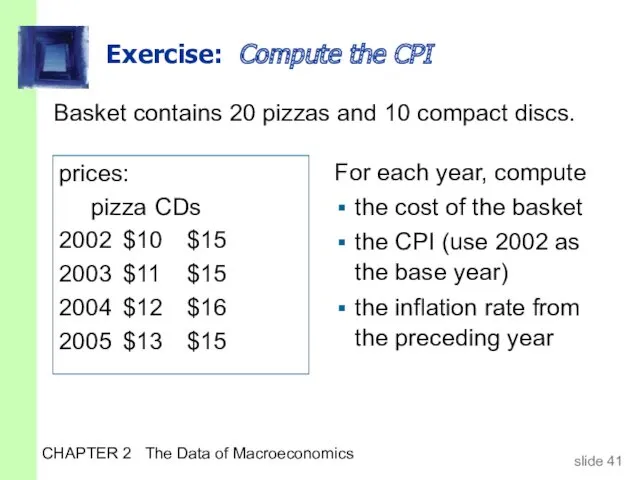
Exercise: Compute the CPI
Basket contains 20
CHAPTER 2 The Data of Macroeconomics
Exercise: Compute the CPI
Basket contains 20
CHAPTER 2 The Data of Macroeconomics
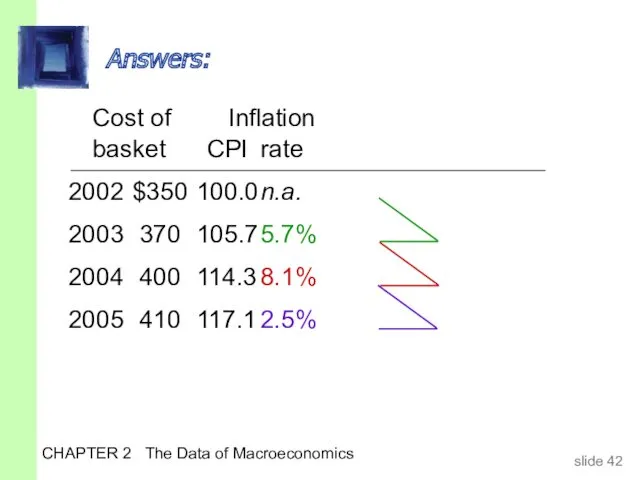
Cost of Inflation
basket CPI rate
2002 $350 100.0 n.a.
2003 370 105.7 5.7%
2004 400 114.3 8.1%
2005
CHAPTER 2 The Data of Macroeconomics
Cost of Inflation
basket CPI rate
2002 $350 100.0 n.a.
2003 370 105.7 5.7%
2004 400 114.3 8.1%
2005
CHAPTER 2 The Data of Macroeconomics
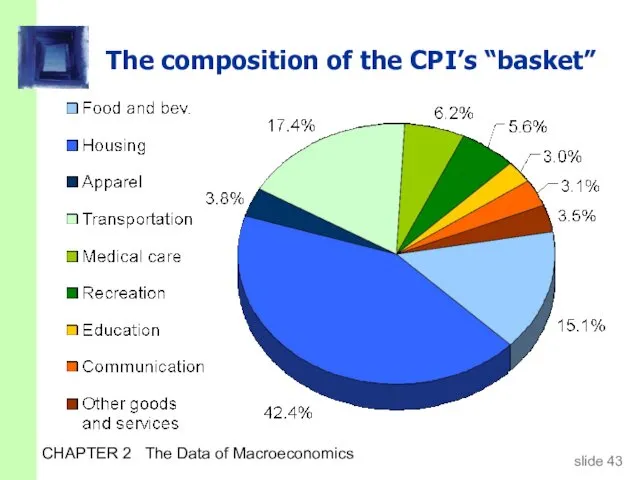
The composition of the CPI’s “basket”
CHAPTER 2 The Data of Macroeconomics
The composition of the CPI’s “basket”
CHAPTER 2 The Data of Macroeconomics
Understanding the CPI
Example with 3 goods
CHAPTER 2 The Data of Macroeconomics
Understanding the CPI
Example with 3 goods
CHAPTER 2 The Data of Macroeconomics
Understanding the CPI
The CPI is a
CHAPTER 2 The Data of Macroeconomics
Understanding the CPI
The CPI is a
CHAPTER 2 The Data of Macroeconomics
Reasons why
the CPI may overstate
CHAPTER 2 The Data of Macroeconomics
Reasons why the CPI may overstate
CHAPTER 2 The Data of Macroeconomics
The size of the CPI’s bias
In
CHAPTER 2 The Data of Macroeconomics
The size of the CPI’s bias
In
CHAPTER 2 The Data of Macroeconomics
Discussion questions:
If your grandmother receives Social
CHAPTER 2 The Data of Macroeconomics
Discussion questions:
If your grandmother receives Social
CHAPTER 2 The Data of Macroeconomics
CPI vs. GDP Deflator
prices of capital
CHAPTER 2 The Data of Macroeconomics
CPI vs. GDP Deflator
prices of capital
CHAPTER 2 The Data of Macroeconomics
Two measures of inflation in the
CHAPTER 2 The Data of Macroeconomics
Two measures of inflation in the
CHAPTER 2 The Data of Macroeconomics
Categories of the population
employed
working at
CHAPTER 2 The Data of Macroeconomics
Categories of the population
employed working at
CHAPTER 2 The Data of Macroeconomics
Two important labor force concepts
unemployment rate
CHAPTER 2 The Data of Macroeconomics
Two important labor force concepts
unemployment rate
CHAPTER 2 The Data of Macroeconomics
Exercise:
Compute labor force statistics
U.S. adult
CHAPTER 2 The Data of Macroeconomics
Exercise:
Compute labor force statistics
U.S. adult
CHAPTER 2 The Data of Macroeconomics
Answers:
data: E = 144.4, U =
CHAPTER 2 The Data of Macroeconomics
Answers:
data: E = 144.4, U =
CHAPTER 2 The Data of Macroeconomics
Exercise: Compute percentage changes in labor
CHAPTER 2 The Data of Macroeconomics
Exercise: Compute percentage changes in labor
CHAPTER 2 The Data of Macroeconomics
The establishment survey
The BLS obtains a
CHAPTER 2 The Data of Macroeconomics
The establishment survey
The BLS obtains a
CHAPTER 2 The Data of Macroeconomics
Two measures of employment growth
Percentage change
CHAPTER 2 The Data of Macroeconomics
Two measures of employment growth
Percentage change
CHAPTER 2 The Data of Macroeconomics
Chapter Summary
1. Gross Domestic Product (GDP) measures
CHAPTER 2 The Data of Macroeconomics
Chapter Summary
1. Gross Domestic Product (GDP) measures
 Безработица. (11 класс, обществознание)
 Итоги финансово-хозяйственной деятельности предприятий жилищно-коммунального хозяйства области за 1 квартал 2018 года
 Collaboration proposal between NCSR “Demokritos” & almaty Кazakhstan
 Региональная политика государства
 Фирма. Производство и издержки
 Предложение на рынке с совершенной конкуренцией
 Способы минимизации предпринимательских рисков
 Unternehmertum in Belarus
 Макроэкономика. Совокупный спрос и предложение
 Планирование материально-технического обеспечения производства
 Проблема внешнеторговых отношений России и ЕС в условиях санкций
 Человеческий и социальный капитал: общая характеристика
 Саны экономикалық белсенді халық
 Обществознание. 7 класс
 Что такое экономика
 Руководство Фраскати
 Теоретические аспекты формирования бизнес-моделей предприятия
 Моделі соціальної політики держав з ринковою економікою. Японська модель
 Сметное дело в строительстве. Модуль 1. Основы сметного дела
 Экономические взгляды Ибн-Хальдуна
 Модель совокупный спрос – совокупное предложение
 Обеспечение международных перевозок и организационно - функциональные структуры международных транспортных систем (лекция 4)
 Платёжный баланс
 Что почитать про ЭКО?
 Что такое экономика?
 Главные вопросы экономики. 9 класс
 Открытый урок по УП по профессии Бухгалтер
 Учебник в системе средств обучения экономике. Лекция 14