- Lecture 7. Correlation and Regression

Содержание
- 2. LECTURE 8 Correlation and Regression Temur Makhkamov Indira Khadjieva QM Module Leaders tmakhkamov@wiut.uz i.khadjieva@wiut.uz Office hours:
- 3. Lecture outline Define and calculate correlation coefficient Find the regression line and use it for regression
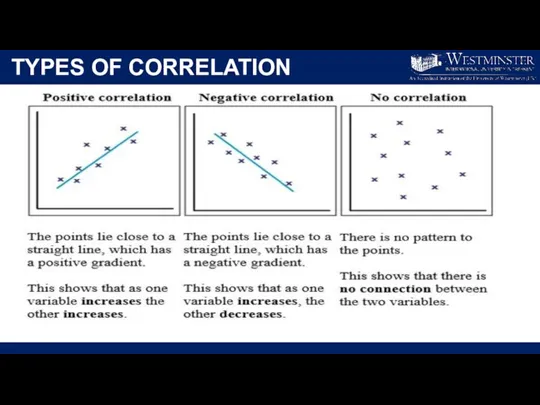
- 4. CORRELATION Correlation is a measure of the strength of a linear relationship between two quantitative variables
- 6. Doing exersice & BMI (Body Mas Index)
- 7. TYPES OF CORRELATION
- 8. POSITIVE CORRELATION EXAMPLES As the number of trees cut down increases, the probability of erosion increases.
- 9. Negative Correlation Examples A student who has many absences has a decrease in grades. If the
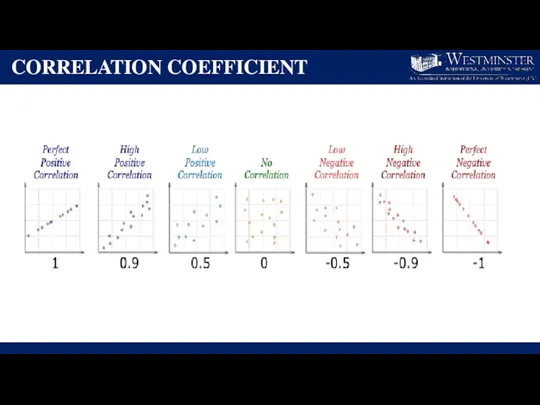
- 10. CORRELATION COEFFICIENT
- 11. Measuring association between the variables
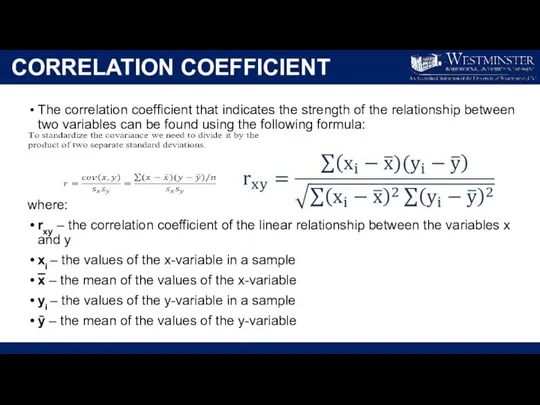
- 12. CORRELATION COEFFICIENT The correlation coefficient that indicates the strength of the relationship between two variables can
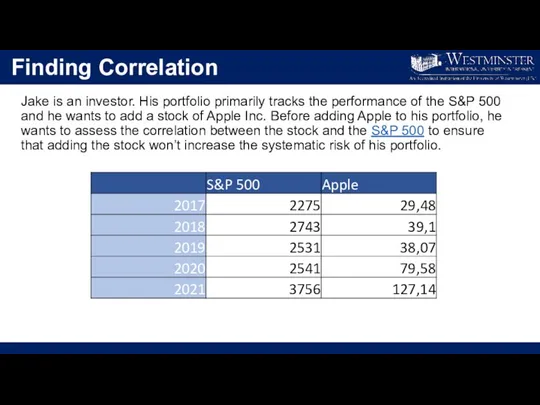
- 13. Finding Correlation Jake is an investor. His portfolio primarily tracks the performance of the S&P 500
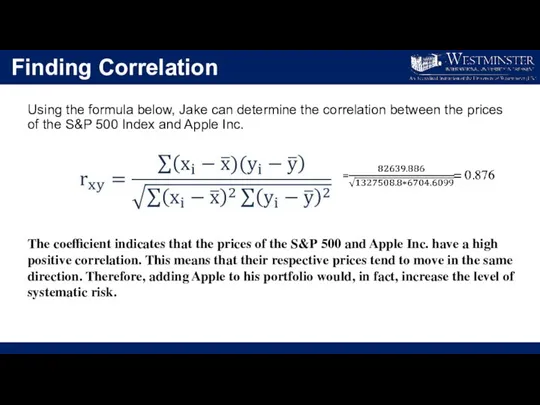
- 14. Finding Correlation Using the formula below, Jake can determine the correlation between the prices of the
- 15. Calculation
- 16. Mesuring association between variables
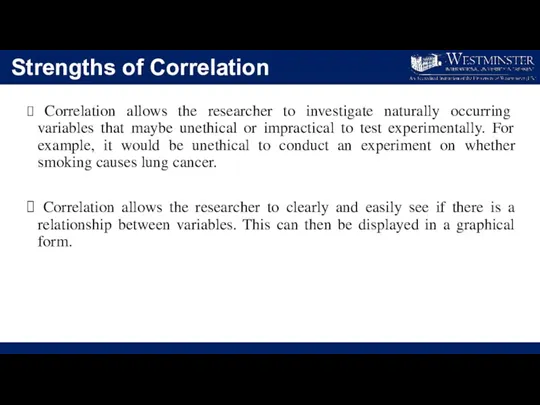
- 17. Strengths of Correlation Correlation allows the researcher to investigate naturally occurring variables that maybe unethical or
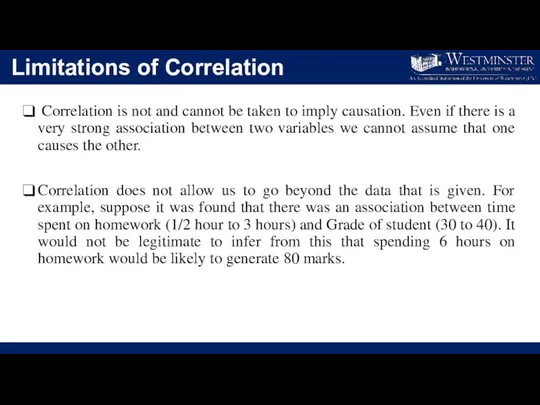
- 18. Limitations of Correlation Correlation is not and cannot be taken to imply causation. Even if there
- 19. Regression If the relationship between variables exists (as we can see from correlation coefficient) we would
- 20. Regression Analysis
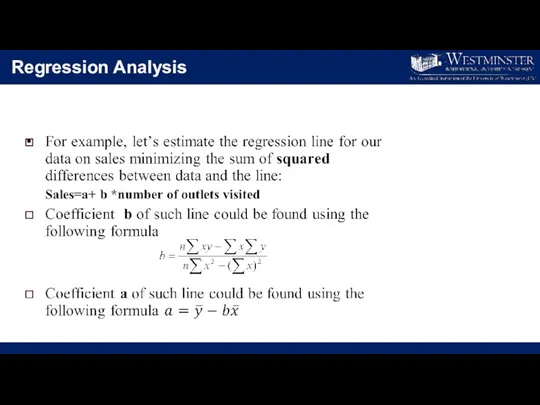
- 21. Regression Analysis Relationship between the sales and number of outlets visited could be well approximated by
- 22. Regression Analysis The problem is we could draw many possible lines. Which one to choose?
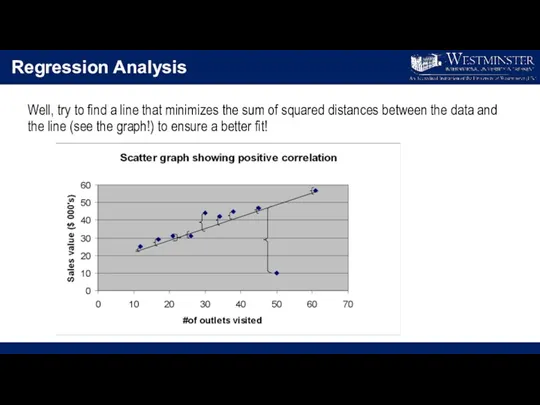
- 23. Regression Analysis Well, try to find a line that minimizes the sum of squared distances between
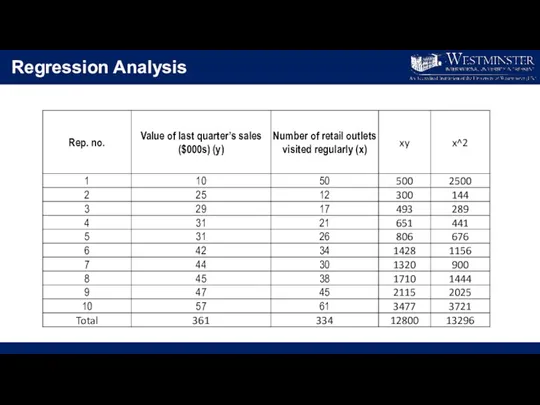
- 24. Regression Analysis
- 25. Regression Analysis
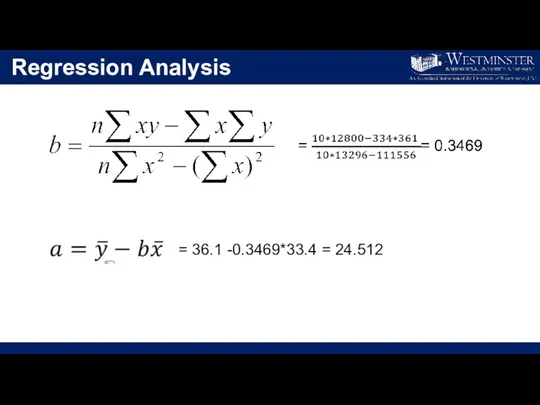
- 26. Regression Analysis = 36.1 -0.3469*33.4 = 24.512
- 27. Interpretation of Regression Analysis Simple regression analysis sales=24.5120+0.3469 x Wow, we now could predict the sales
- 28. Regression Analysis (homework) 2nd method of finding coefficient of Regression Line
- 29. Mesuring quality of regression equation
- 31. Скачать презентацию
LECTURE 8
Correlation and Regression
Temur Makhkamov
Indira Khadjieva
QM Module Leaders
tmakhkamov@wiut.uz
i.khadjieva@wiut.uz
Office hours:
LECTURE 8
Correlation and Regression
Temur Makhkamov
Indira Khadjieva
QM Module Leaders
tmakhkamov@wiut.uz
i.khadjieva@wiut.uz
Office hours:
Lecture outline
Define and calculate correlation coefficient
Find the regression line and use
Lecture outline
Define and calculate correlation coefficient
Find the regression line and use
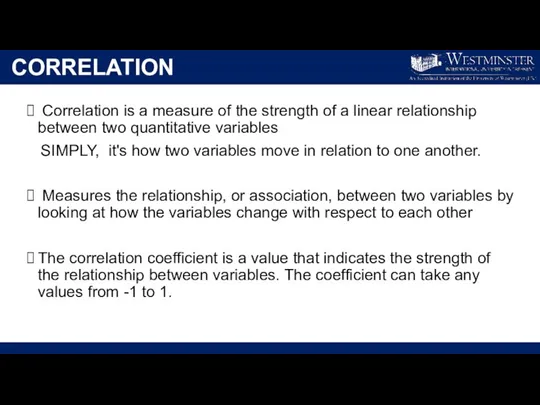
CORRELATION
Correlation is a measure of the strength of a
CORRELATION
Correlation is a measure of the strength of a

Doing exersice & BMI (Body Mas Index)
Doing exersice & BMI (Body Mas Index)
TYPES OF CORRELATION
TYPES OF CORRELATION
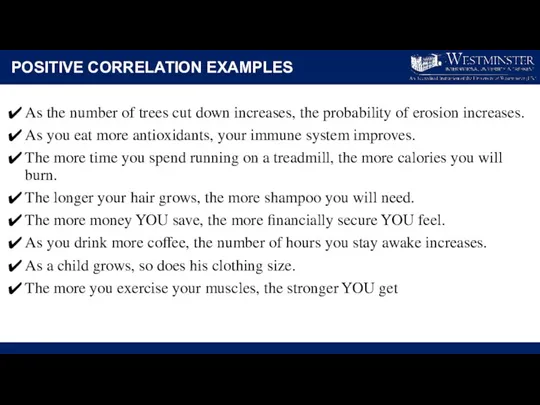
POSITIVE CORRELATION EXAMPLES
As the number of trees cut down increases, the
POSITIVE CORRELATION EXAMPLES
As the number of trees cut down increases, the
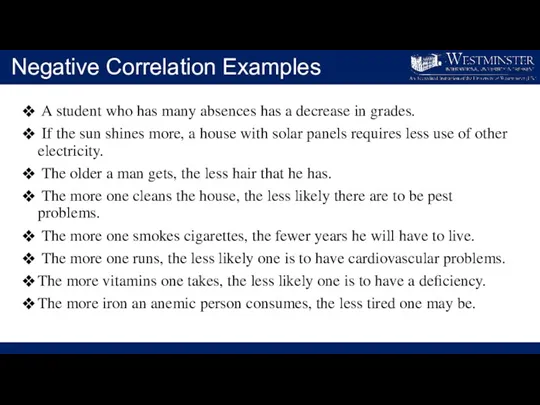
Negative Correlation Examples
A student who has many absences has a
Negative Correlation Examples
A student who has many absences has a
CORRELATION COEFFICIENT
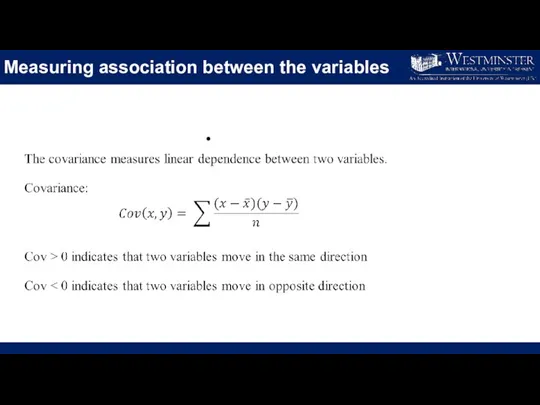
Measuring association between the variables
Measuring association between the variables
CORRELATION COEFFICIENT
The correlation coefficient that indicates the strength of the relationship
CORRELATION COEFFICIENT
The correlation coefficient that indicates the strength of the relationship
Finding Correlation
Jake is an investor. His portfolio primarily tracks the performance
Finding Correlation
Jake is an investor. His portfolio primarily tracks the performance
Finding Correlation
Using the formula below, Jake can determine the correlation between
Finding Correlation
Using the formula below, Jake can determine the correlation between
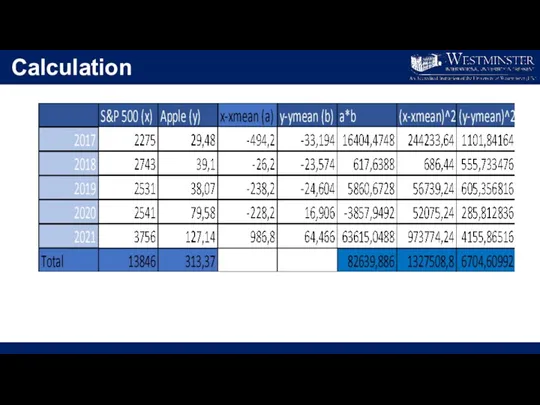
Calculation
Calculation
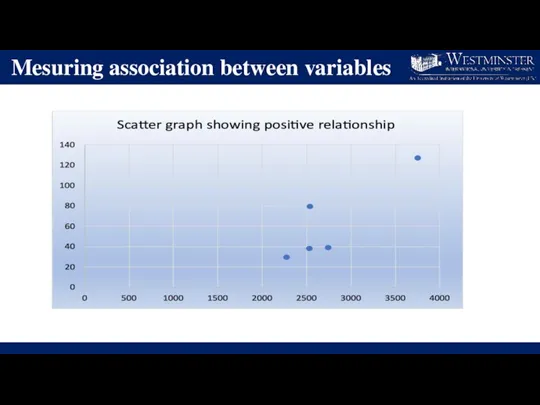
Mesuring association between variables
Mesuring association between variables
Strengths of Correlation
Correlation allows the researcher to investigate naturally occurring
Strengths of Correlation
Correlation allows the researcher to investigate naturally occurring
Limitations of Correlation
Correlation is not and cannot be taken to
Limitations of Correlation
Correlation is not and cannot be taken to
Regression
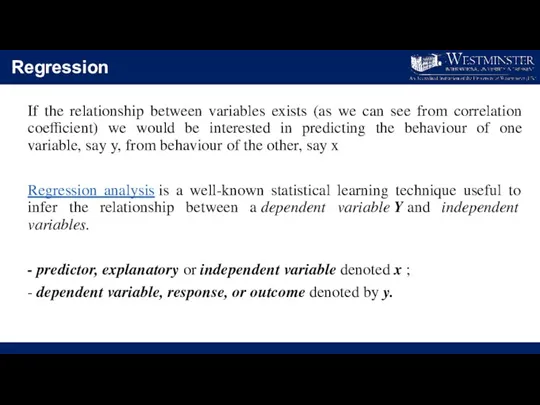
If the relationship between variables exists (as we can see from
Regression
If the relationship between variables exists (as we can see from
Regression Analysis
Regression Analysis
Regression Analysis
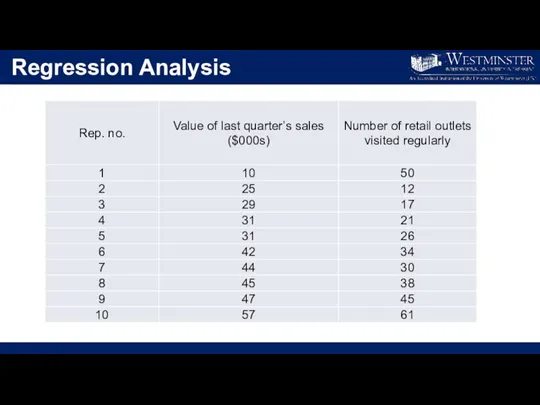
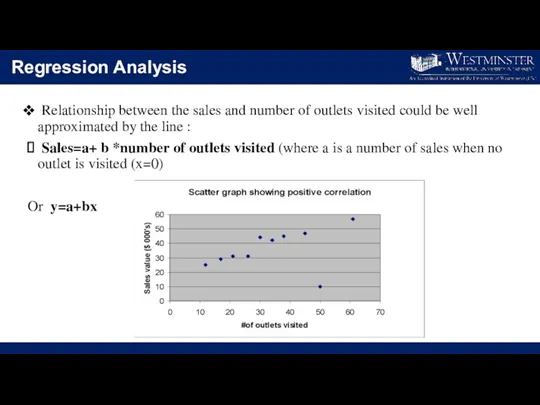
Relationship between the sales and number of outlets visited
Regression Analysis
Relationship between the sales and number of outlets visited
Regression Analysis
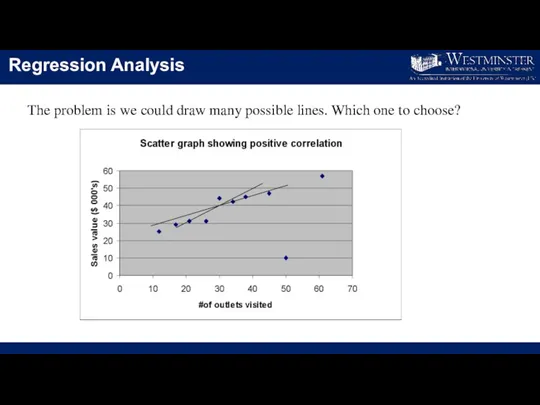
The problem is we could draw many possible lines. Which
Regression Analysis
The problem is we could draw many possible lines. Which
Regression Analysis
Well, try to find a line that minimizes the sum
Regression Analysis
Well, try to find a line that minimizes the sum
Regression Analysis
Regression Analysis
Regression Analysis
Regression Analysis
Regression Analysis
= 36.1 -0.3469*33.4 = 24.512
Regression Analysis
= 36.1 -0.3469*33.4 = 24.512
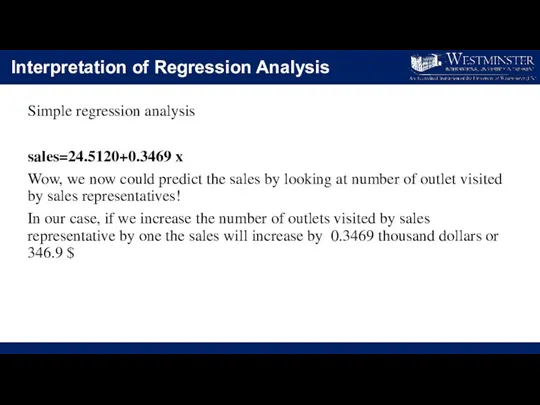
Interpretation of Regression Analysis
Simple regression analysis
sales=24.5120+0.3469 x
Wow, we now could
Interpretation of Regression Analysis
Simple regression analysis
sales=24.5120+0.3469 x
Wow, we now could
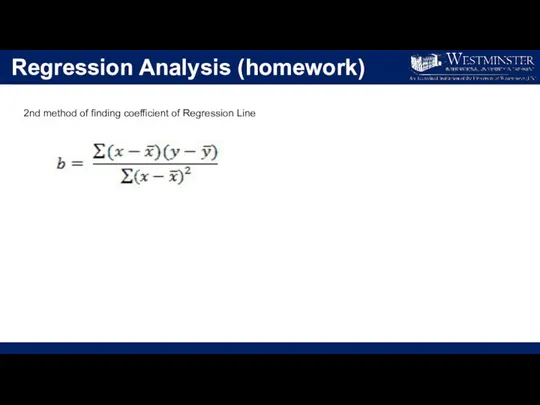
Regression Analysis (homework)
2nd method of finding coefficient of Regression Line
Regression Analysis (homework)
2nd method of finding coefficient of Regression Line
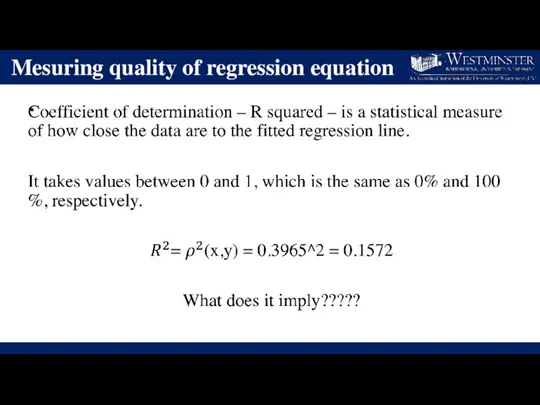
Mesuring quality of regression equation
Mesuring quality of regression equation
 Электромагнитное поле
 Теорема об изменении импульса механической системы
 Физика ОГЭ 2022. Вариант 1. (С решением)
 Философские проблемы науки и техники. Классическая механика. (Лекция 5)
 Методы исследования переключения в сегнетоэлектриках. Микроскопия
 Лекция 22 (5). Строение атома
 Системы эксплуатации космических средств, как объект системотехники
 Строение атома. Электрон. Электрический заряд и элементарные частицы
 Система стабилизации высоты полета беспилотного летательного аппарата при внешних возмущениях
 Технология ремонта машин. Решение задач
 Фотоэффект_ Давление света_ Химическое действие света_ Фотография_ Выполнил_
 Проектно-исследовательская работа Определение плотности картофеля 2. Теория эксперимента
 Русские народные игры (презентация)
 Тепловые явления. Решение задач
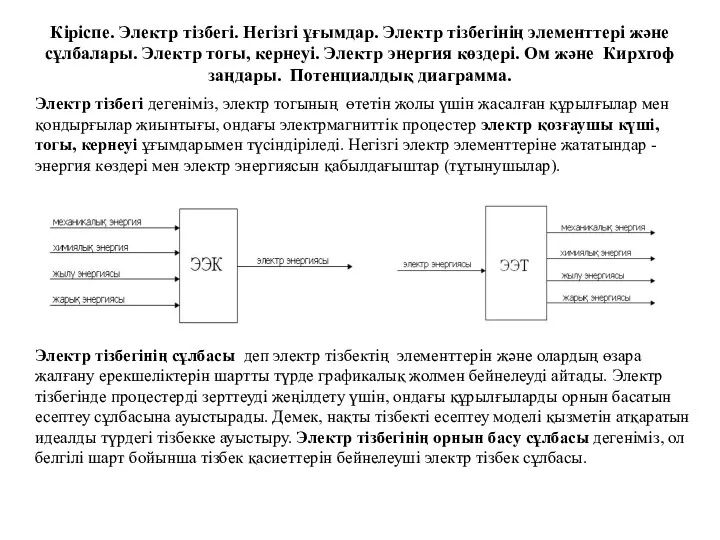 Кіріспе. Электр тізбегі. Негізгі ұғымдар. Электр тізбегінің элементтері және сұлбалары. Электр тогы, кернеуі
 Презентации к учебному материалу по физике для учащихся 8 класса
 Техническое обслуживание и ремонт подвижного состава как определяющий фактор его технического состояния
 работа и мощность эл.тока
 Механические характеристики электротехнических материалов
 Compass - magnetic and gyro
 Силовые агрегаты и двигатели
 ДЕЯТЕЛЬНОСТНЫЙ ПОДХОД В ПРЕПОДАВАНИИ ФИЗИКИ Диск
 Электростатическое поле. Закон Кулона. Напряженность электростатического поля
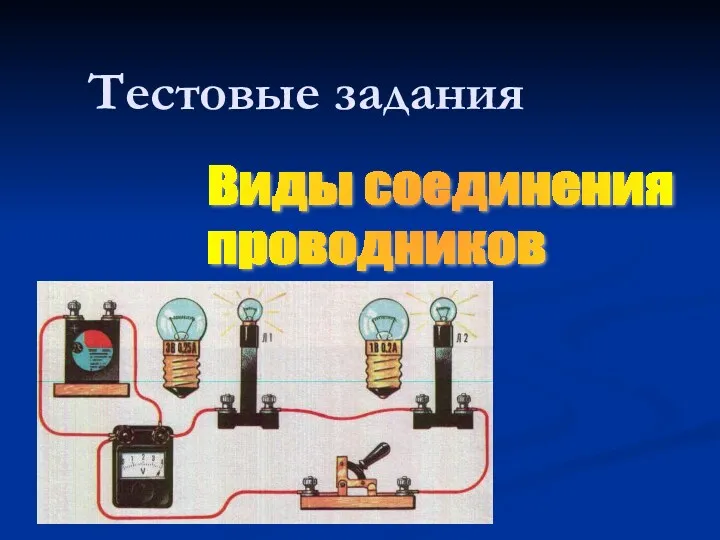 Презентация Тестовые задания по теме: Виды соединения проводников
 Физика и познание мира. Экспериментальный характер физики. Классическая механика Ньютона
 Проектная работа Система подготовки учащихся к ЕГЭ по физике
 Подводим итог 7 класса по физике
 Презентация к уроку по физике 7 класс . Тема: Сила трения.