- Разрушение. Теоретический предел прочности

Содержание
- 2. Разрушение Destruction релаксация упругой энергии за счет нарушения сплошности среды Relaxation of elastic energy by disintegration
- 3. Теоретический предел прочности Theoretical limit of strength
- 4. Стадии разрушения Destruction stages Зарождение трещины Nucleation of a crack Развитие трещины Development of cracks
- 5. Трещины Cracks Поле силовых линий у эллиптического отверстия длиной 2а в центре пластины Elastic field around
- 6. Энергетический Критерий Гриффитса Точный расчет для плоского напряженного состояния Exact solution for plane stress Высвобождаемая энергия
- 7. Напряжения вблизи края трещины Stress near the crack edge x1 x2 σ22 σ11 σ12 Энергетический критерий
- 8. Вблизи вершины острой трещины Near sharp crack tip Если на краю трещины напряжения превышают теоретический предел
- 9. Пора Pore, void Распределение напряжений у края круглого отверстия с радиусом а в бесконечной пластине, подвергнутой
- 10. Типы микротрещин Types of microcracks пора (тупая трещина) упругая трещина (острая) дислокационная трещина pore, void elastic
- 11. Формирование микротрещин при пластической деформации. Crack formation due to plastic deformation Механизм Стро (Straw’s mechanism) Механизм
- 12. Трещины в пленках. Cracks in thin stressed films Steady advance of a crack in the x-direction
- 13. Распространение трещины вглубь. Crack development Работа по созданию новой поверхности. Work to create new free surface
- 14. Движущая сила образования трещины. Driving force for a crack formation. The solid curve shows the driving
- 15. Критическая толщина для образования трещин. Critical thickness for cracking of a stressed film. The solid curve
- 16. Массив трещин Crack array Из анализа выигрыша энергии Per period λ
- 17. Минимальное расстояние между трещинами Spacing between cracks The minimum spacing possible for an array of cracks
- 18. Пример Example In0.25Ga0.75As/InP, εm=0.02, Ef=76.8 GPa, ν=0.32, Γf=1.6 J/m2; = 13.6 nm Для hf= 2 (hf)cr
- 19. Край тонкой пленки на подложке Edge of a stressed film on a substrate Schematic diagram of
- 20. Сдвиговые напряжения вблизи края пленки на подложке. Shear stress near the film edge. A schematic diagram
- 21. Напряжения вблизи свободного края пленки. Shear and normal traction near film edge. The solid curve labeled
- 22. Отслоение (деламинация) Delamination Part (a) shows a delamination crack propagating along the film-substrate interface. In part
- 23. Критическая толщина для спонтанной деламинации Critical thickness for spontaneous delamination Выигрыш в упругой энергии Release of
- 24. Деламинация и трещинообразование в пленке Cracking vs delamination for a film Plane of the dimensionless groups
- 25. Деламинация и трещинообразование в подложке Cracking vs delamination for a substrate The plane spanned by two
- 26. Изгиб при деламинации. Bending when delamination. Schematic representation of the edge force and bending moment for
- 27. Деламинация как способ получения трехмерных микро и наноструктур Production of microinductors by delamination and bending The
- 28. Вспучивание Buckling Минимальный размер области отслоения Critical size Напряжения, необходимые для отслоения Critical stress
- 29. Релаксация упругой энергии в гетероструктурах Relaxation of elastic energy in heterostructures Внутренние напряжения возникают вследствие рассогласования
- 31. Скачать презентацию
Разрушение Destruction
релаксация упругой энергии за счет нарушения сплошности среды
Relaxation of elastic
Разрушение Destruction
релаксация упругой энергии за счет нарушения сплошности среды
Relaxation of elastic
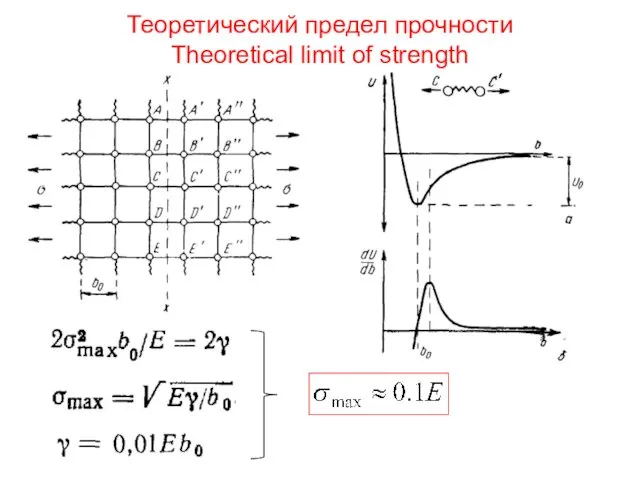
Теоретический предел прочности
Theoretical limit of strength
Теоретический предел прочности
Theoretical limit of strength
Стадии разрушения
Destruction stages
Зарождение трещины
Nucleation of a crack
Развитие трещины
Development of cracks
Стадии разрушения
Destruction stages
Зарождение трещины
Nucleation of a crack
Развитие трещины
Development of cracks
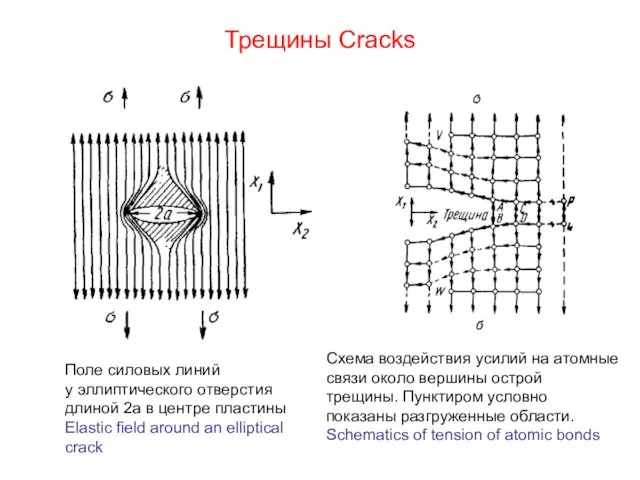
Трещины Cracks
Поле силовых линий
у эллиптического отверстия
длиной 2а в центре
Трещины Cracks
Поле силовых линий
у эллиптического отверстия
длиной 2а в центре
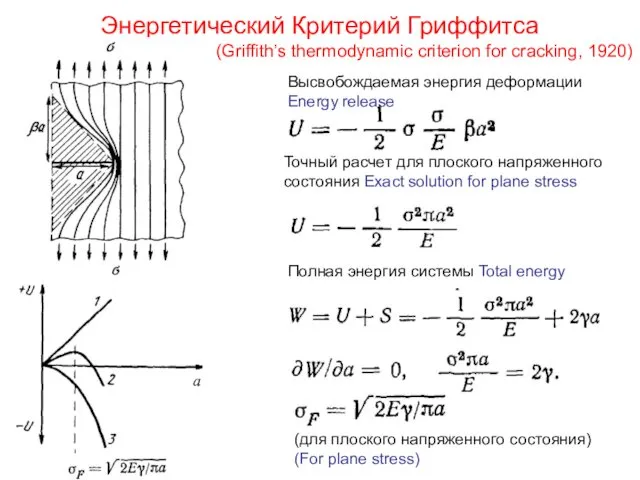
Энергетический Критерий Гриффитса
Точный расчет для плоского напряженного состояния Exact solution for
Энергетический Критерий Гриффитса
Точный расчет для плоского напряженного состояния Exact solution for
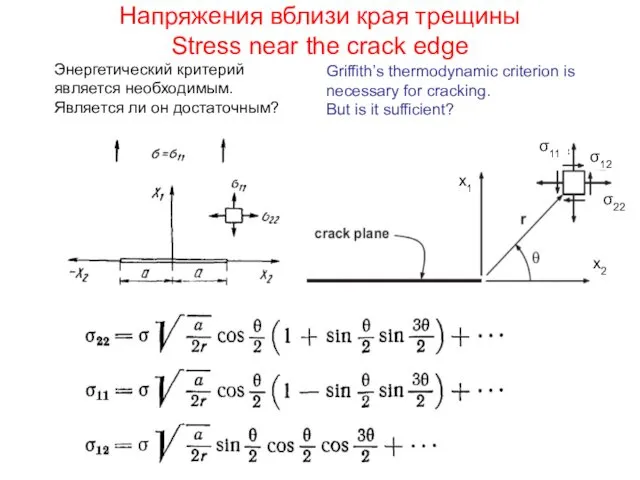
Напряжения вблизи края трещины
Stress near the crack edge
x1
x2
σ22
σ11
σ12
Энергетический критерий является необходимым.
Напряжения вблизи края трещины
Stress near the crack edge
x1
x2
σ22
σ11
σ12
Энергетический критерий является необходимым.
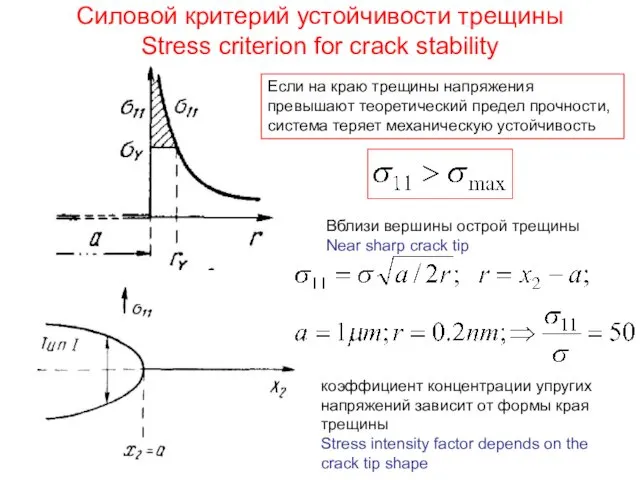
Вблизи вершины острой трещины
Near sharp crack tip
Если на краю трещины напряжения
Вблизи вершины острой трещины
Near sharp crack tip
Если на краю трещины напряжения
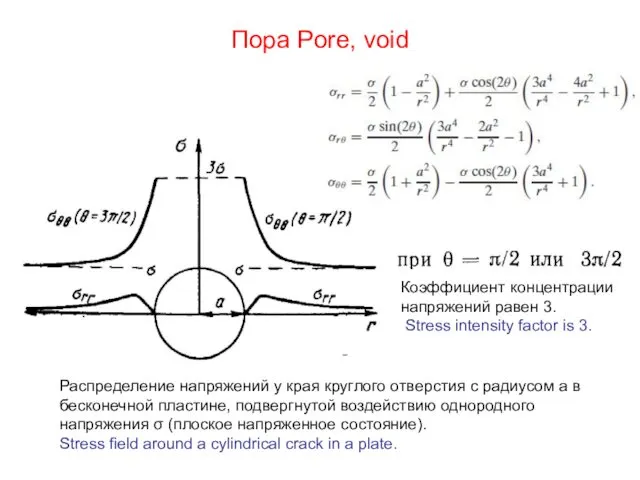
Пора Pore, void
Распределение напряжений у края круглого отверстия с радиусом а
Пора Pore, void
Распределение напряжений у края круглого отверстия с радиусом а
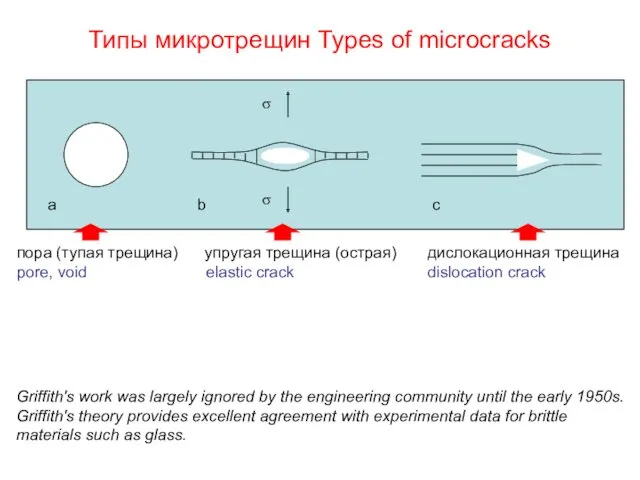
Типы микротрещин Types of microcracks
пора (тупая трещина) упругая трещина (острая) дислокационная
Типы микротрещин Types of microcracks
пора (тупая трещина) упругая трещина (острая) дислокационная
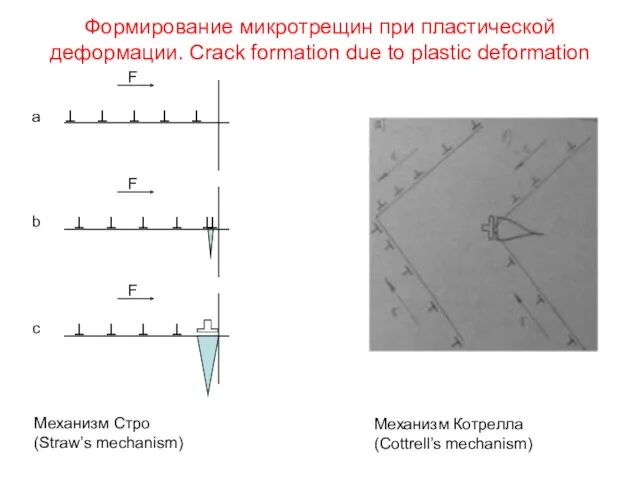
Формирование микротрещин при пластической деформации. Crack formation due to plastic deformation
Механизм
Формирование микротрещин при пластической деформации. Crack formation due to plastic deformation
Механизм
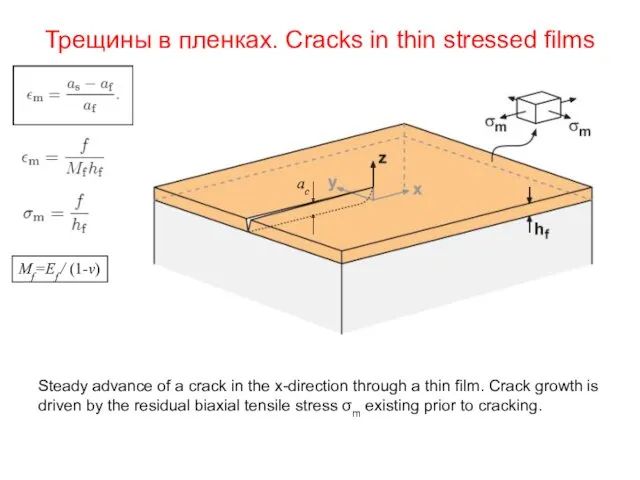
Трещины в пленках. Cracks in thin stressed films
Steady advance of a
Трещины в пленках. Cracks in thin stressed films
Steady advance of a
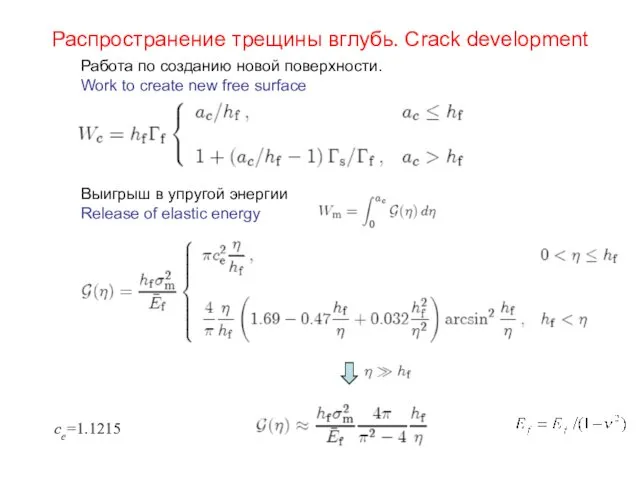
Распространение трещины вглубь. Crack development
Работа по созданию новой поверхности.
Work to create
Распространение трещины вглубь. Crack development
Работа по созданию новой поверхности. Work to create
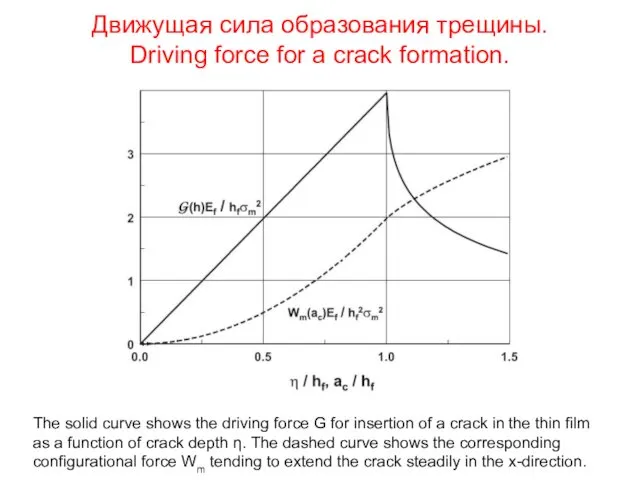
Движущая сила образования трещины.
Driving force for a crack formation.
The solid curve
Движущая сила образования трещины.
Driving force for a crack formation.
The solid curve
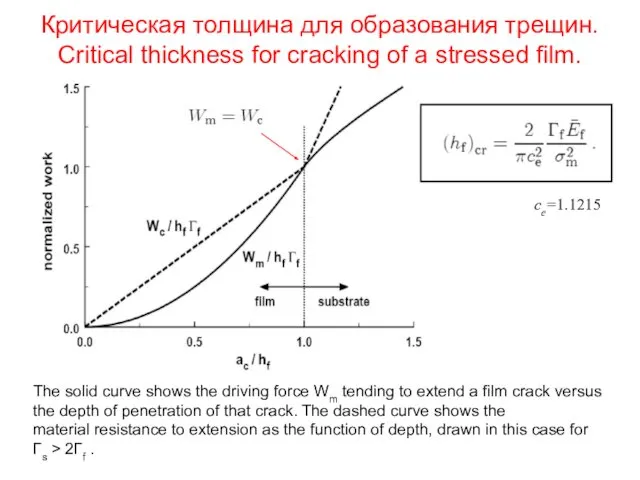
Критическая толщина для образования трещин.
Critical thickness for cracking of a stressed
Критическая толщина для образования трещин. Critical thickness for cracking of a stressed
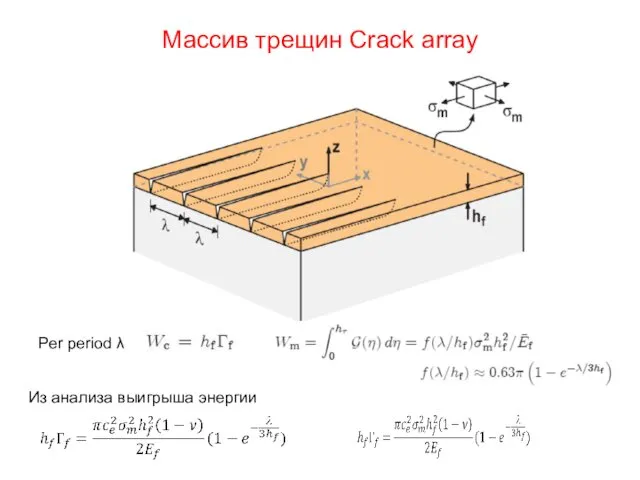
Массив трещин Crack array
Из анализа выигрыша энергии
Per period λ
Массив трещин Crack array
Из анализа выигрыша энергии
Per period λ
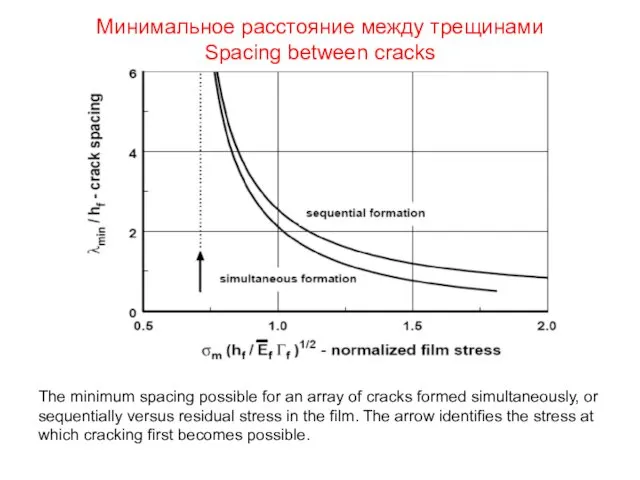
Минимальное расстояние между трещинами
Spacing between cracks
The minimum spacing possible for an
Минимальное расстояние между трещинами
Spacing between cracks
The minimum spacing possible for an
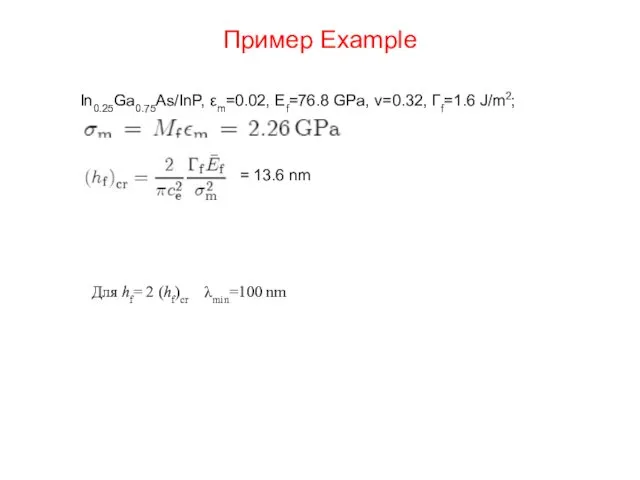
Пример Example
In0.25Ga0.75As/InP, εm=0.02, Ef=76.8 GPa, ν=0.32, Γf=1.6 J/m2;
= 13.6 nm
Для hf=
Пример Example
In0.25Ga0.75As/InP, εm=0.02, Ef=76.8 GPa, ν=0.32, Γf=1.6 J/m2;
= 13.6 nm
Для hf=
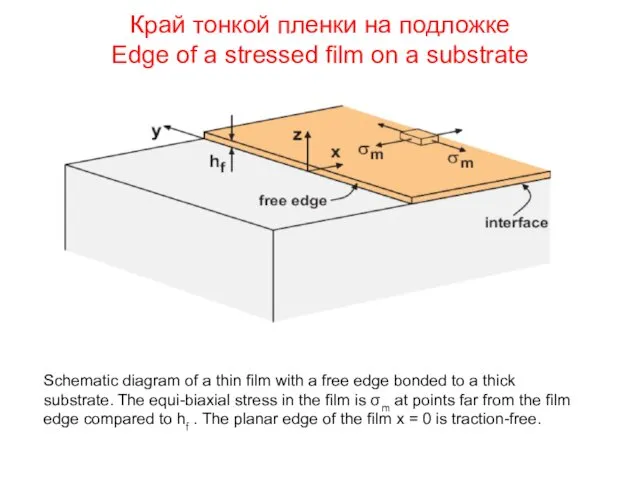
Край тонкой пленки на подложке
Edge of a stressed film on a
Край тонкой пленки на подложке Edge of a stressed film on a
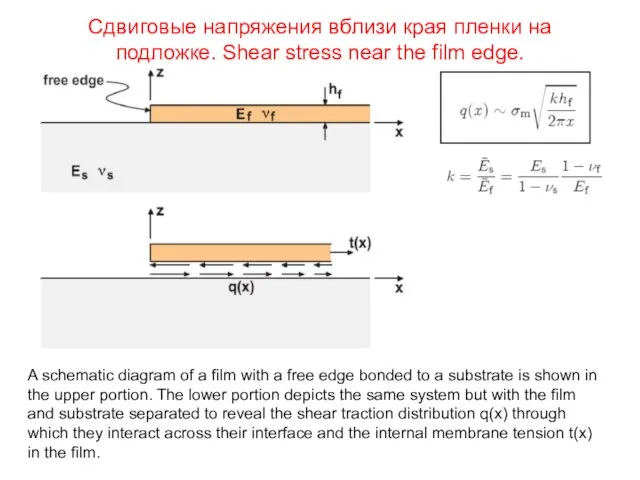
Сдвиговые напряжения вблизи края пленки на подложке. Shear stress near the
Сдвиговые напряжения вблизи края пленки на подложке. Shear stress near the
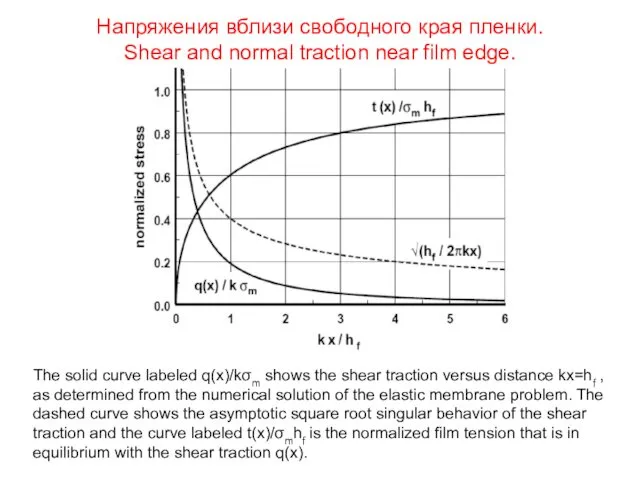
Напряжения вблизи свободного края пленки.
Shear and normal traction near film edge.
The
Напряжения вблизи свободного края пленки.
Shear and normal traction near film edge.
The
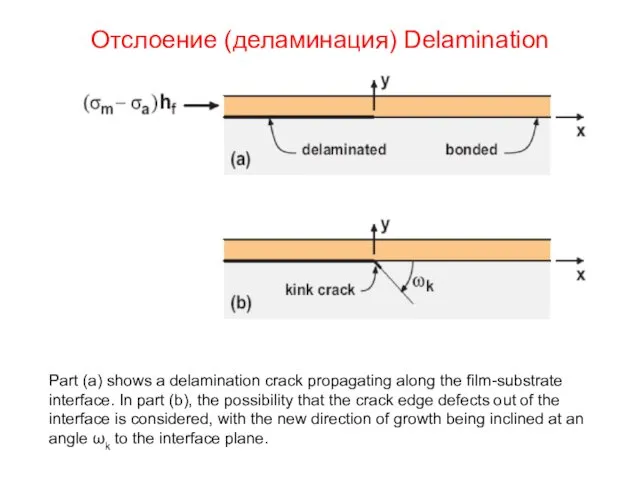
Отслоение (деламинация) Delamination
Part (a) shows a delamination crack propagating along the
Отслоение (деламинация) Delamination
Part (a) shows a delamination crack propagating along the
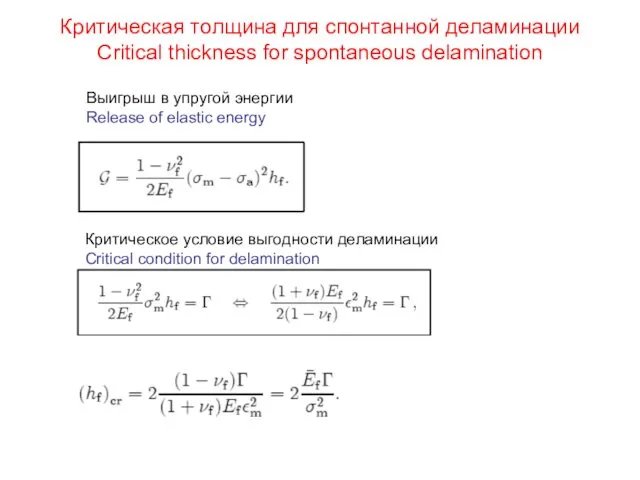
Критическая толщина для спонтанной деламинации
Critical thickness for spontaneous delamination
Выигрыш в упругой
Критическая толщина для спонтанной деламинации
Critical thickness for spontaneous delamination
Выигрыш в упругой
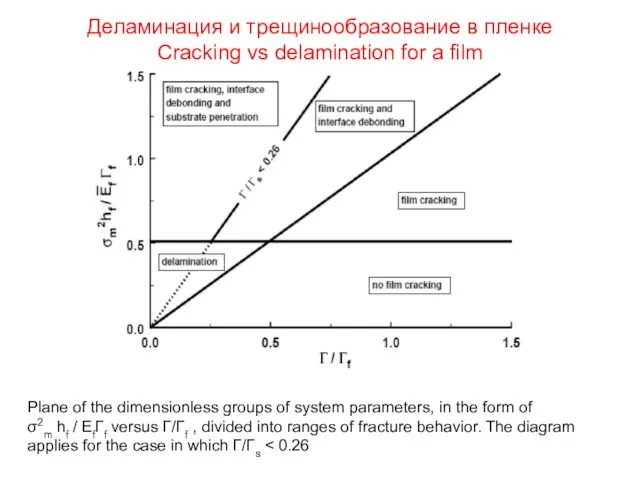
Деламинация и трещинообразование в пленке
Cracking vs delamination for a film
Plane of
Деламинация и трещинообразование в пленке
Cracking vs delamination for a film
Plane of
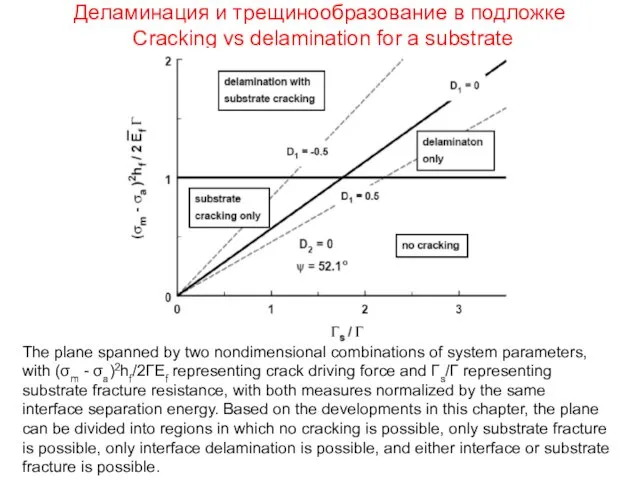
Деламинация и трещинообразование в подложке
Cracking vs delamination for a substrate
The
Деламинация и трещинообразование в подложке
Cracking vs delamination for a substrate
The
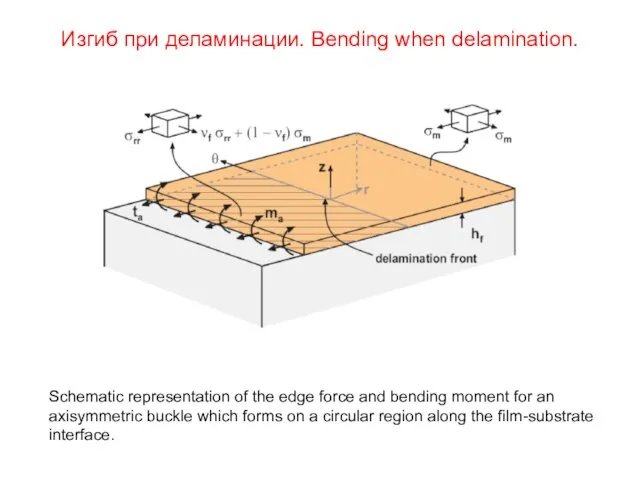
Изгиб при деламинации. Bending when delamination.
Schematic representation of the edge force
Изгиб при деламинации. Bending when delamination.
Schematic representation of the edge force
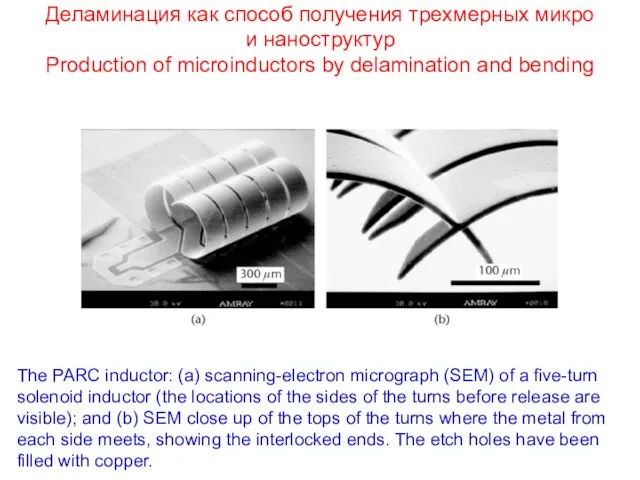
Деламинация как способ получения трехмерных микро и наноструктур
Production of microinductors
Деламинация как способ получения трехмерных микро и наноструктур Production of microinductors
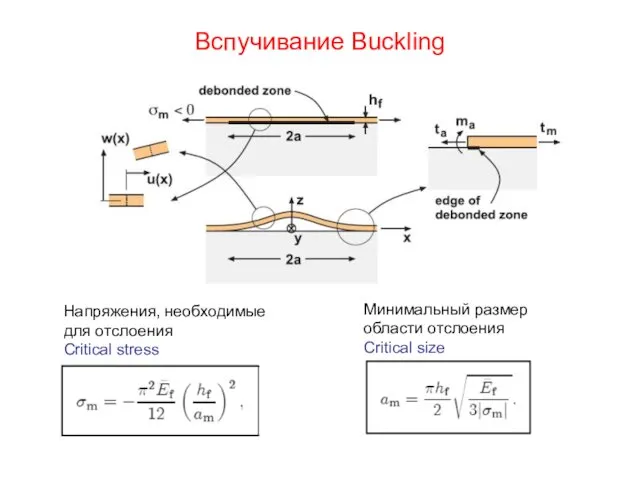
Вспучивание Buckling
Минимальный размер области отслоения
Critical size
Напряжения, необходимые для отслоения
Critical stress
Вспучивание Buckling
Минимальный размер области отслоения
Critical size
Напряжения, необходимые для отслоения
Critical stress
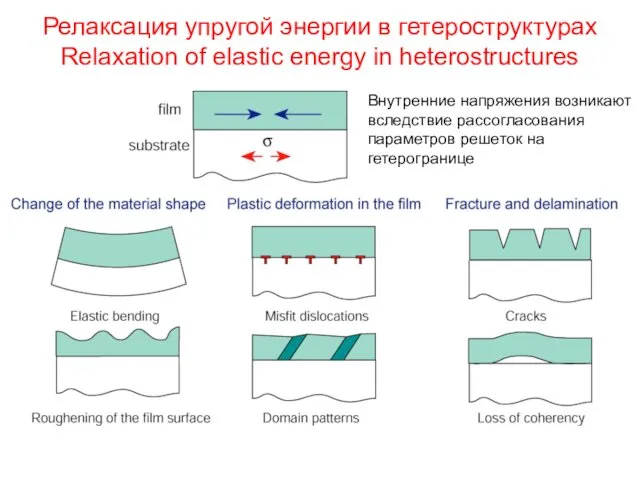
Релаксация упругой энергии в гетероструктурах
Relaxation of elastic energy in heterostructures
Внутренние напряжения
Релаксация упругой энергии в гетероструктурах
Relaxation of elastic energy in heterostructures
Внутренние напряжения
 Механическая работа. Мощность
 Балка на упругом основании
 Измерение удельной теплоёмкости твердого тела
 Рідкі кристали та їх властивості
 Электроприборы в быту
 Техническое обслуживание и текущий ремонт систем электроснабжения автомобиля
 Подшипники качения
 Свисты-волны ОНЧ диапазона (1-30 кГц) в магнитосфере
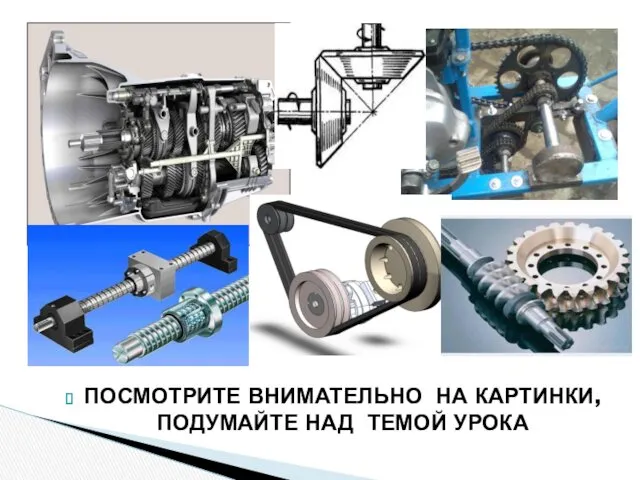 Общие сведения о механических передачах
 Биофизика мембранных процессов. Мембранный транспорт
 Основные понятия непотопляемости
 Diodo shockley
 Направление тока и направление линий его магнитного поля. Сила Ампера
 Технологии на квантовых эффектах
 Физика - наука о природе
 Расчет линейных разветвленных цепей
 Определение эдс и внутреннего сопротивления источника тока
 Передаточна функція систем автоматики. Стуктурно-динамічні схеми систем автоматики та їх перетворення
 Диэлектриктегі физикалық процесс. Диэлектрлік шығындар және диэлектриктардың тесілуі
 Теории прочности
 Цепные передачи
 Тонкослойная хроматография
 Урок Лист Успеха Работа и мощность 7 класс
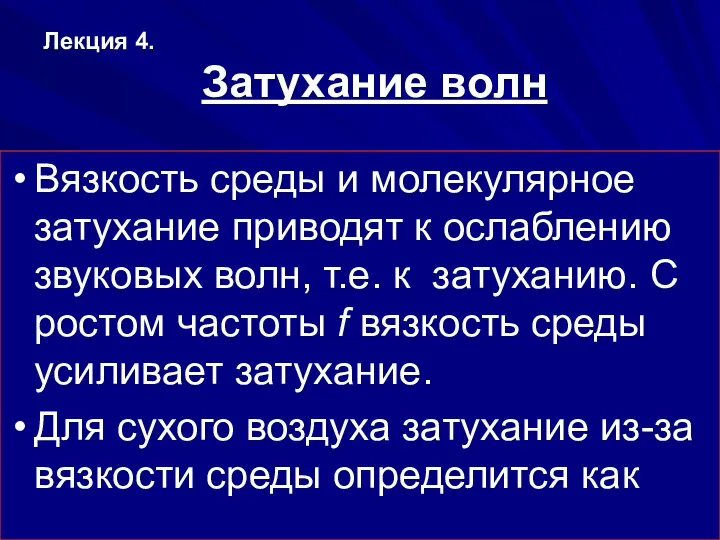 Акустика. Затухание волн
 Сферические зеркала.Ход лучей в призме, плоскопараллельной пластине
 Радиометрия и спектрометрия ионизирующих излучений. (Лекция 9)
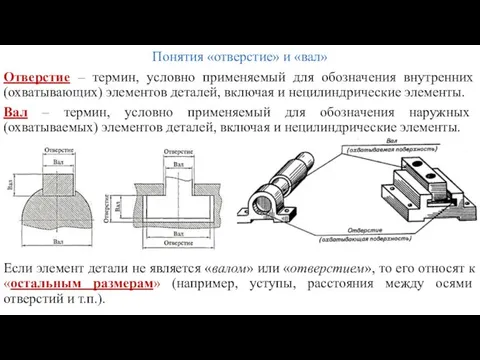 Понятия отверстие и вал
 Інерція та інертність. Маса та імпульс тіла. Другий закон Ньютона