- Acronyms. IT Information Technology

Содержание
- 2. Acronyms IT Information Technology BLT Bacon, Lettuce & Tomato SSADM Structured Systems Analysis & Design Method
- 3. Unit 11: Systems analysis & design SSADM Tools & Techniques Overview
- 4. Learning Outcomes Task 1 – Principles of systems analysis & design Produce a report describing the
- 5. Typical Tools and Techniques used in SSADM Activity diagrams Context diagrams Data Flow Diagrams Entity relationship
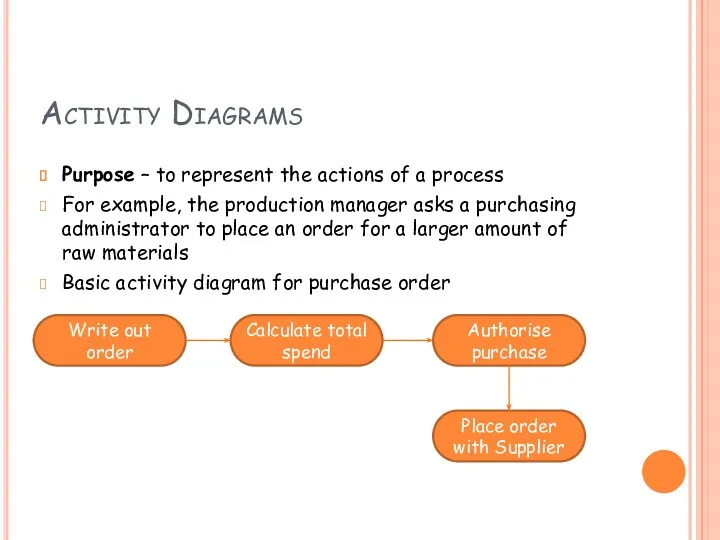
- 6. Activity Diagrams Purpose – to represent the actions of a process For example, the production manager
- 7. Activity Diagrams - Tasks Create activity diagrams for the following examples;- Making a cup of tea
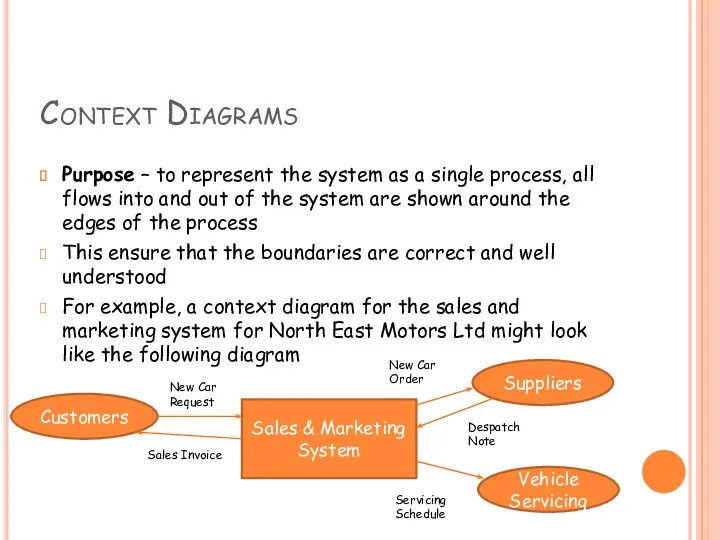
- 8. Context Diagrams Purpose – to represent the system as a single process, all flows into and
- 9. Context Diagrams - Tasks Create context diagrams for the following examples;- A customer bring a car
- 10. Data Flow Diagrams (DFD) Purpose :- To represent the information flows of a system The diagrams
- 11. Data Flow Diagrams (DFD) For example, the production manager asks a purchasing administrator to place an
- 12. Entity Relationship Diagrams (ERD) Also referred to as a Logical Data Model or Logical Data Structure
- 13. ERD Diagrams - Tasks Create Entity Relationship Diagrams for the following examples;- A customer buying a
- 14. Data dictionaries Purpose - the data dictionary is a formal record of what fields will be
- 15. Decision Tables Purpose - A decision table is used to represent a process where a number
- 16. Decision Tables - Tasks Create Decision Table for the following example;- The process you go through
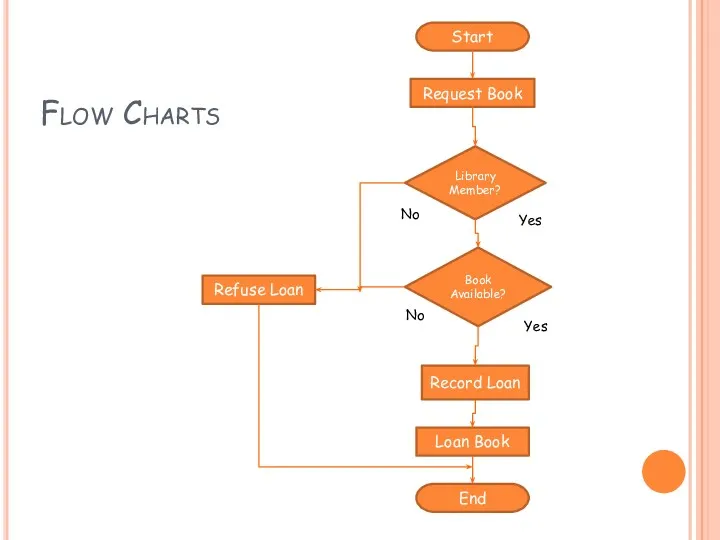
- 17. Flow Charts Purpose :– A flow chart shows how steps in a process fit together and
- 18. Flow Charts Start Request Book Refuse Loan Record Loan Loan Book End Library Member? Book Available?
- 19. Flow Chart- Tasks Create Flow Chart for the following example;- The process you go through while
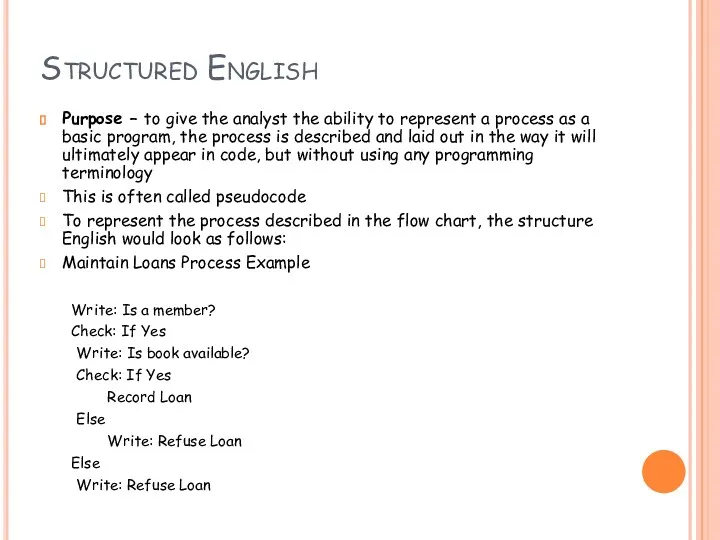
- 20. Structured English Purpose – to give the analyst the ability to represent a process as a
- 21. Structured English- Tasks Create Structured English for the following example;- The process you go through while
- 22. Non-diagrammatic Techniques Relational data analysis Requirements definition Function definition Formulation of options Specification prototyping
- 24. Скачать презентацию
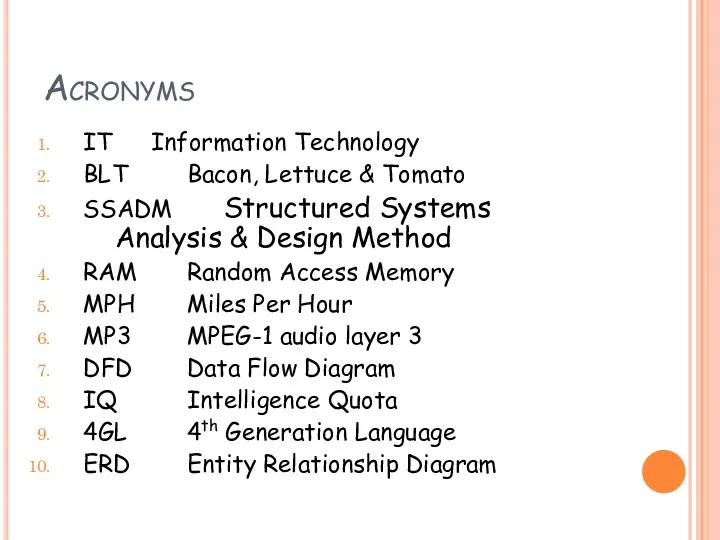
Acronyms
IT Information Technology
BLT Bacon, Lettuce & Tomato
SSADM Structured Systems Analysis & Design Method
RAM Random Access
Acronyms
IT Information Technology
BLT Bacon, Lettuce & Tomato
SSADM Structured Systems Analysis & Design Method
RAM Random Access
Unit 11: Systems analysis & design
SSADM Tools & Techniques Overview
Unit 11: Systems analysis & design
SSADM Tools & Techniques Overview
Learning Outcomes
Task 1 – Principles of systems analysis & design
Produce a
Learning Outcomes
Task 1 – Principles of systems analysis & design
Produce a
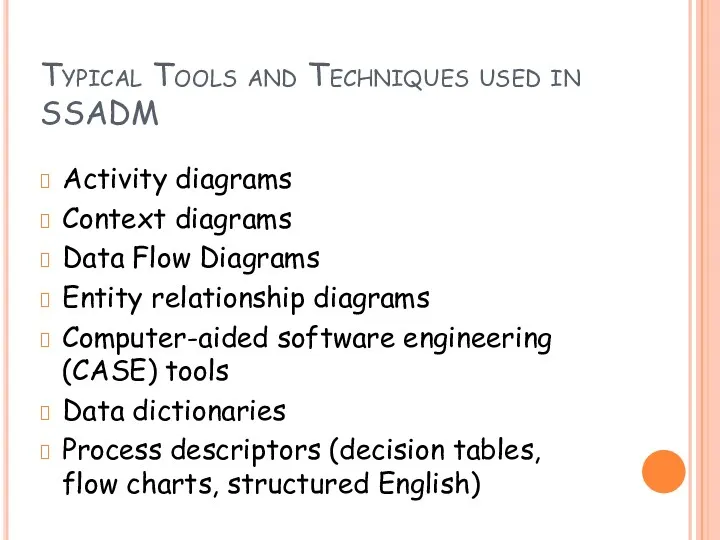
Typical Tools and Techniques used in SSADM
Activity diagrams
Context diagrams
Data Flow Diagrams
Entity
Typical Tools and Techniques used in SSADM
Activity diagrams
Context diagrams
Data Flow Diagrams
Entity
Activity Diagrams
Purpose – to represent the actions of a process
For example,
Activity Diagrams
Purpose – to represent the actions of a process
For example,
Activity Diagrams - Tasks
Create activity diagrams for the following examples;-
Making a
Activity Diagrams - Tasks
Create activity diagrams for the following examples;-
Making a
Context Diagrams
Purpose – to represent the system as a single process,
Context Diagrams
Purpose – to represent the system as a single process,
Context Diagrams - Tasks
Create context diagrams for the following examples;-
A customer
Context Diagrams - Tasks
Create context diagrams for the following examples;-
A customer
Data Flow Diagrams (DFD)
Purpose :-
To represent the information flows of
Data Flow Diagrams (DFD)
Purpose :-
To represent the information flows of
Data Flow Diagrams (DFD)
For example, the production manager asks a purchasing
Data Flow Diagrams (DFD)
For example, the production manager asks a purchasing
Entity Relationship Diagrams (ERD)
Also referred to as a Logical Data Model
Entity Relationship Diagrams (ERD)
Also referred to as a Logical Data Model
ERD Diagrams - Tasks
Create Entity Relationship Diagrams for the following examples;-
A
ERD Diagrams - Tasks
Create Entity Relationship Diagrams for the following examples;-
A
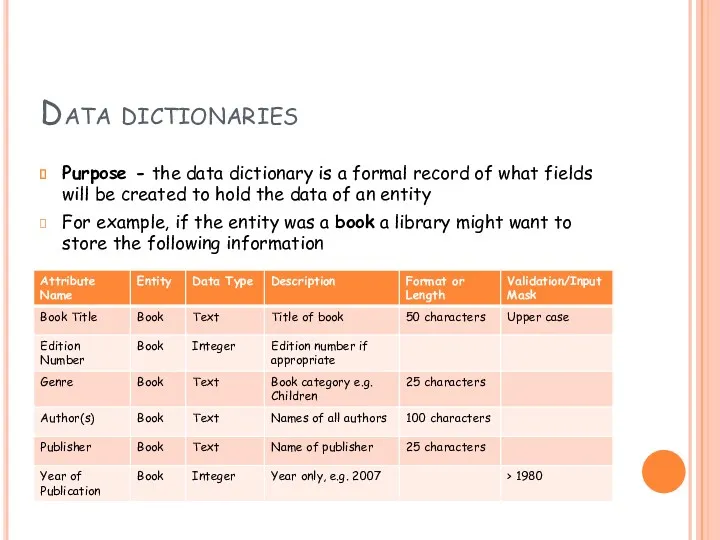
Data dictionaries
Purpose - the data dictionary is a formal record of
Data dictionaries
Purpose - the data dictionary is a formal record of
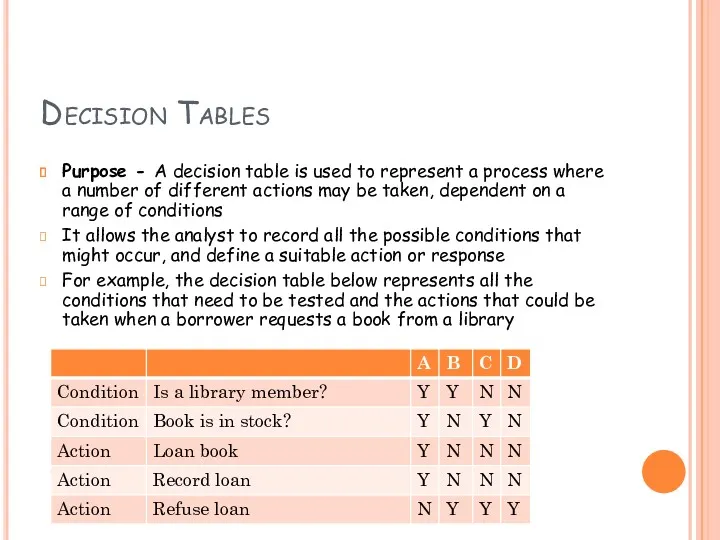
Decision Tables
Purpose - A decision table is used to represent a
Decision Tables
Purpose - A decision table is used to represent a
Decision Tables - Tasks
Create Decision Table for the following example;-
The process
Decision Tables - Tasks
Create Decision Table for the following example;-
The process
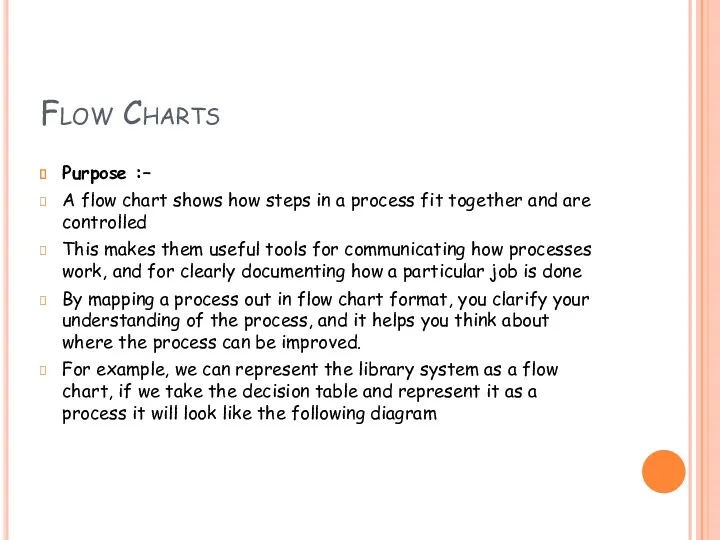
Flow Charts
Purpose :–
A flow chart shows how steps in a process
Flow Charts
Purpose :–
A flow chart shows how steps in a process
Flow Charts
Start
Request Book
Refuse Loan
Record Loan
Loan Book
End
Library Member?
Book Available?
No
No
Yes
Yes
Flow Charts
Start
Request Book
Refuse Loan
Record Loan
Loan Book
End
Library Member?
Book Available?
No
No
Yes
Yes
Flow Chart- Tasks
Create Flow Chart for the following example;-
The process you
Flow Chart- Tasks
Create Flow Chart for the following example;-
The process you
Structured English
Purpose – to give the analyst the ability to represent
Structured English
Purpose – to give the analyst the ability to represent
Structured English- Tasks
Create Structured English for the following example;-
The process you
Structured English- Tasks
Create Structured English for the following example;-
The process you
Non-diagrammatic Techniques
Relational data analysis
Requirements definition
Function definition
Formulation of options
Specification prototyping
Non-diagrammatic Techniques
Relational data analysis
Requirements definition
Function definition
Formulation of options
Specification prototyping
 Простейшая (каскадная) модель жизненного цикла ПО. Техническое задание. Требования к содержанию и оформлению
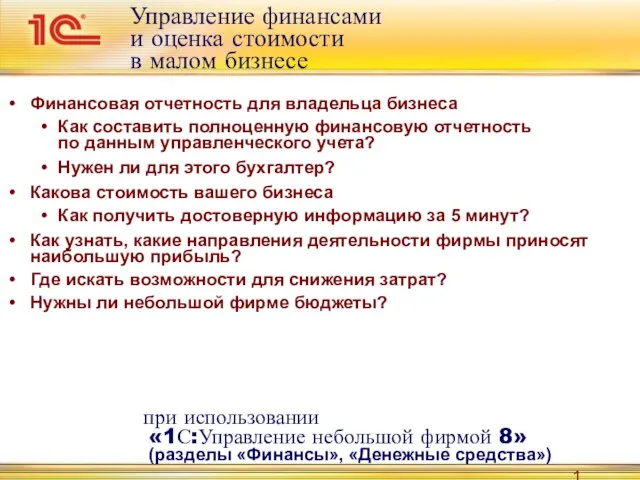 Финансовая отчетность для владельца бизнеса. 1С:Управление небольшой фирмой 8
 СУБД MySQL PHP. Лекція №7
 Профессия: Оператор компьютерного набора
 Знакомство с языком программирования Python. Ввод. Вывод. Оператор присваивания
 Устройство компьютера. Схема устройства компьютера
 Лидар. Сбор входных данных
 Рекурсия
 Программирование разветвляющихся алгоритмов
 Фейковые новости и как их отличать от настоящих
 Как создать свой сайт
 Берсерк. Самоучитель
 Миркомир. Игра
 Предметно-ориентированные информационные системы
 Розробка системи обміну повідомленнями для Twitter, на базі мобільних технологій
 Эффективные инструменты визуализации учебной информации
 Тестирование программного обеспечения. Основы реляционных баз данных. Работа с SQL. (Урок 6)
 Логические выражения и таблицы истинности. Логика
 Что такое Unity и Vuforia
 Хранение и предварительная обработка больших наборов данных с помощью Tensor Flow
 Турбопоиск. Предложение для компании “Концепт-Строй”
 Кодирование звуковой информации. Представление информации в компьютере
 Математичне програмування. Задачі оптимізації. Задача лінійного програмування. Лекція 5
 Внешние устройства компьютера
 История развития вычислительной техники
 Проектирование реляционных баз данных
 Графический редактор PAINT
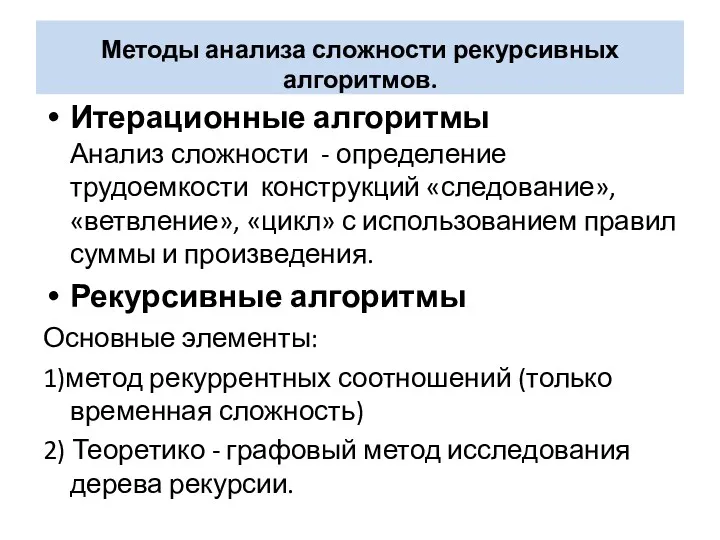 Методы анализа сложности рекурсивных алгоритмов