- Analyzing missing data

Содержание
- 2. Missing data and data analysis Missing data is a problem in multivariate data because a case
- 3. Tools for evaluating missing data SPSS has a specific package for evaluating missing data, but it
- 4. Key issues in missing data analysis We will focus on three key issues for evaluating missing
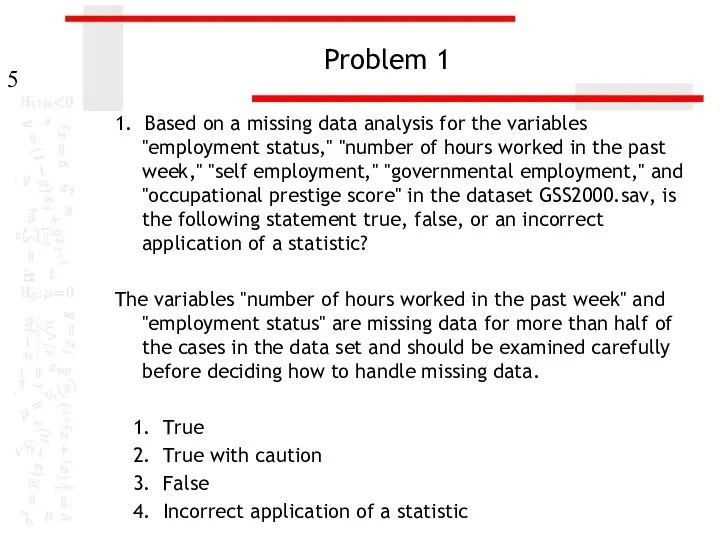
- 5. Problem 1 1. Based on a missing data analysis for the variables "employment status," "number of
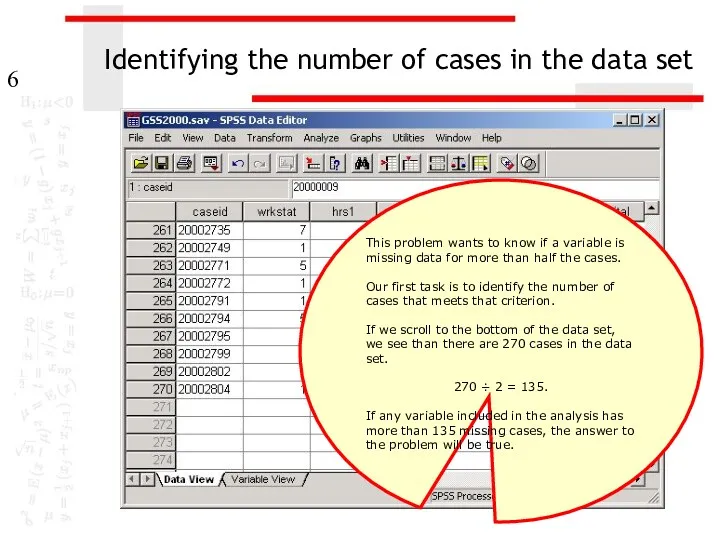
- 6. Identifying the number of cases in the data set This problem wants to know if a
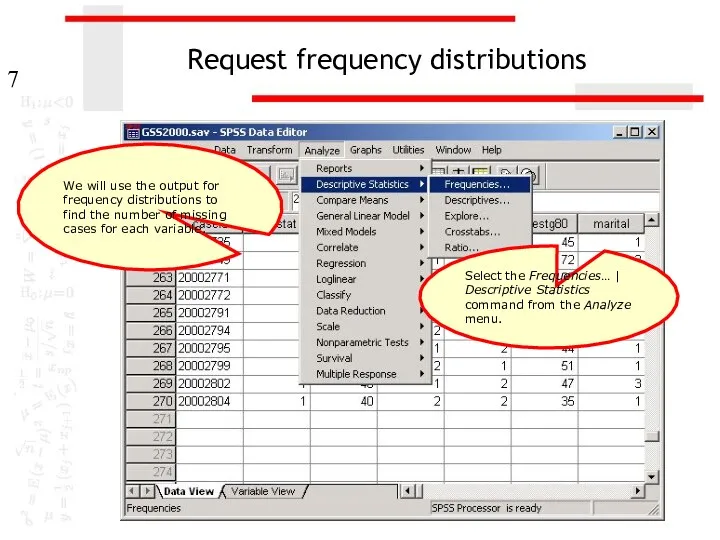
- 7. Request frequency distributions We will use the output for frequency distributions to find the number of
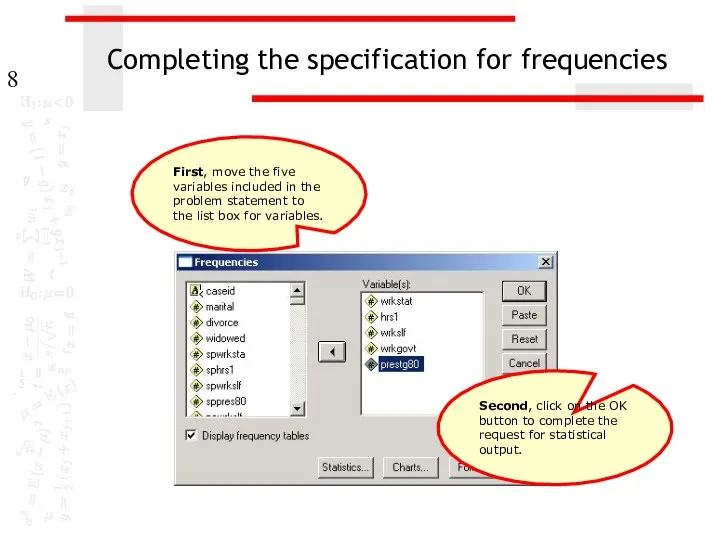
- 8. Completing the specification for frequencies Second, click on the OK button to complete the request for
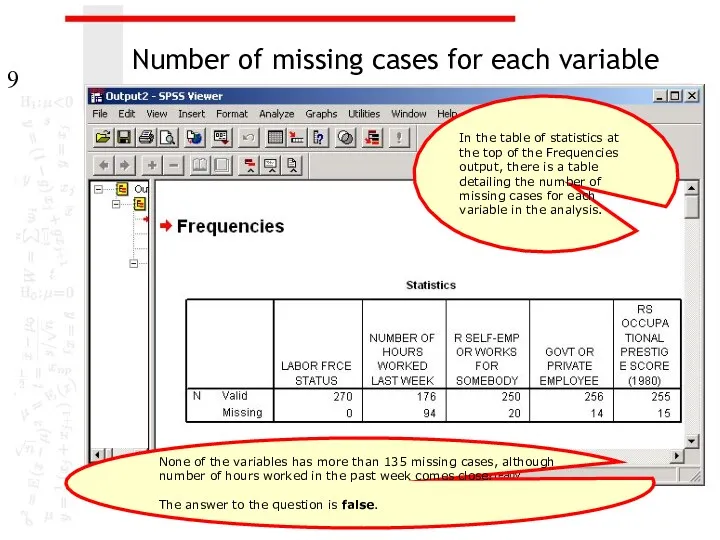
- 9. Number of missing cases for each variable In the table of statistics at the top of
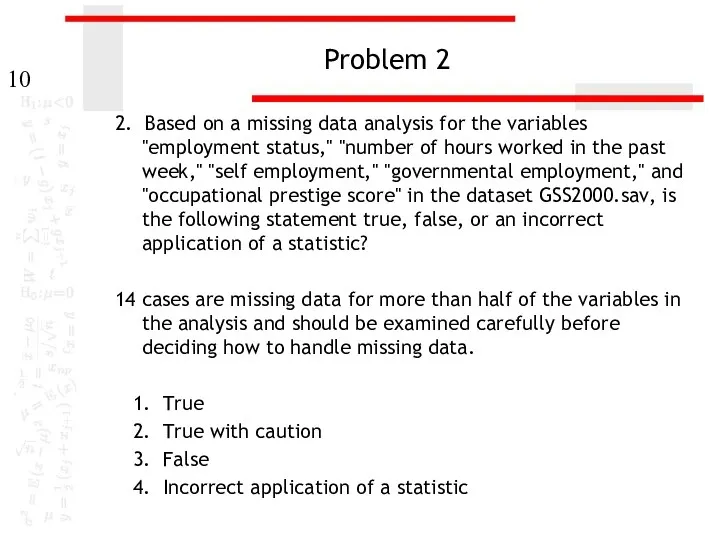
- 10. Problem 2 2. Based on a missing data analysis for the variables "employment status," "number of
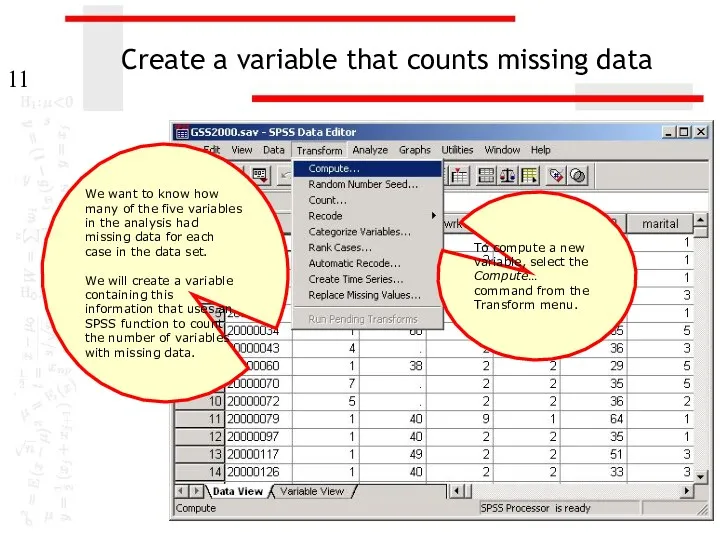
- 11. Create a variable that counts missing data We want to know how many of the five
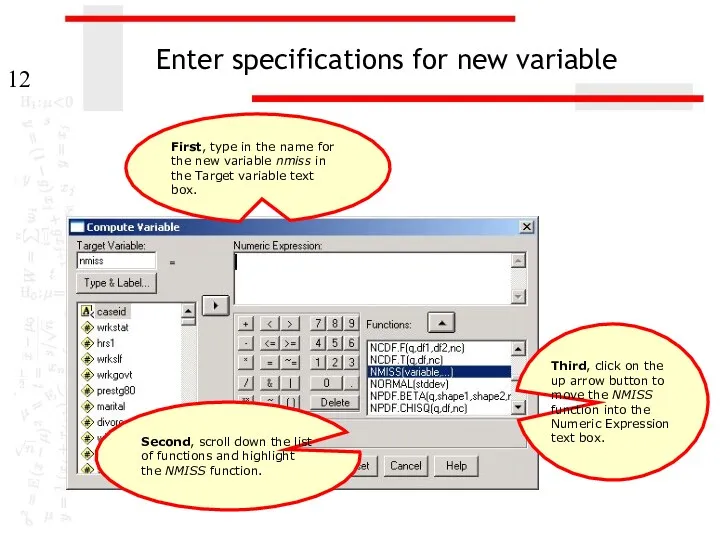
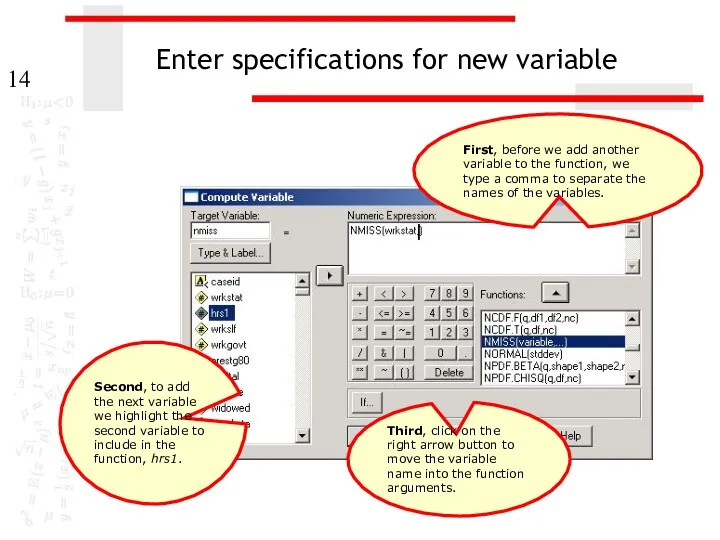
- 12. Enter specifications for new variable Third, click on the up arrow button to move the NMISS
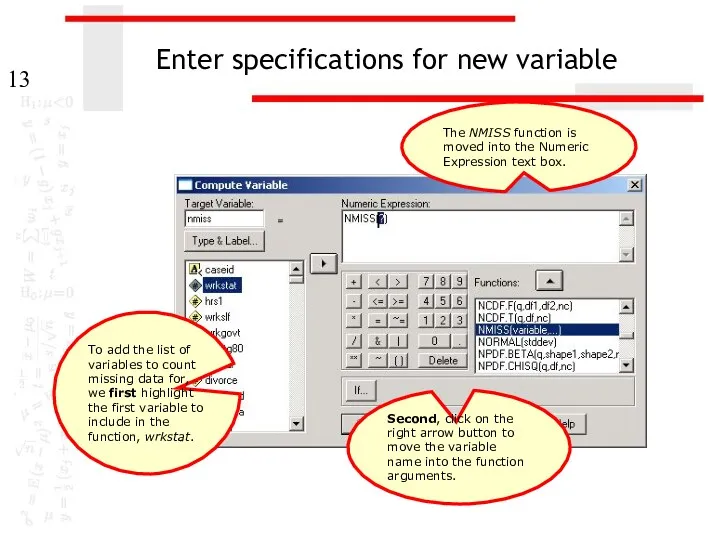
- 13. Enter specifications for new variable The NMISS function is moved into the Numeric Expression text box.
- 14. Enter specifications for new variable First, before we add another variable to the function, we type
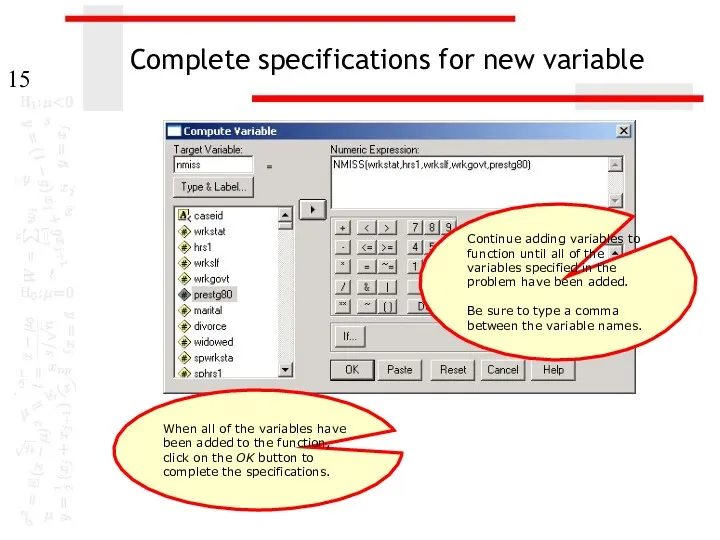
- 15. Complete specifications for new variable Continue adding variables to function until all of the variables specified
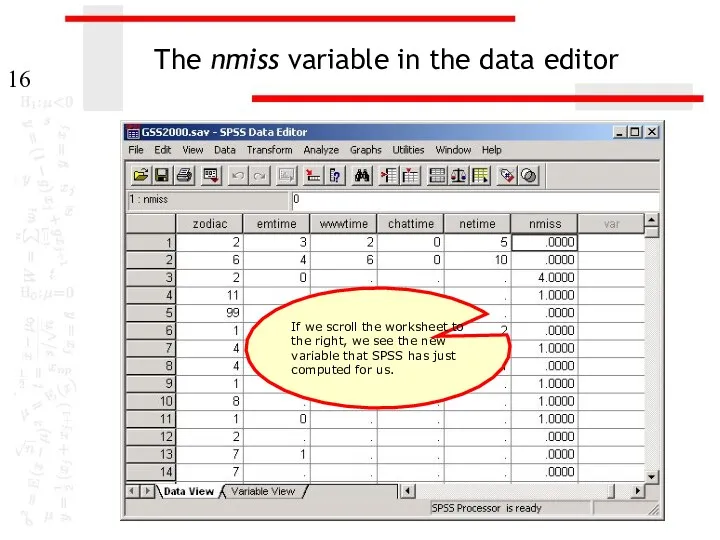
- 16. The nmiss variable in the data editor If we scroll the worksheet to the right, we
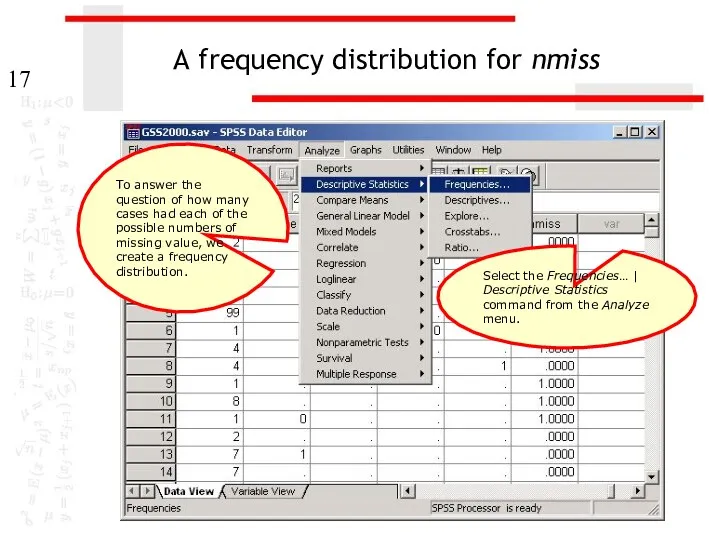
- 17. A frequency distribution for nmiss To answer the question of how many cases had each of
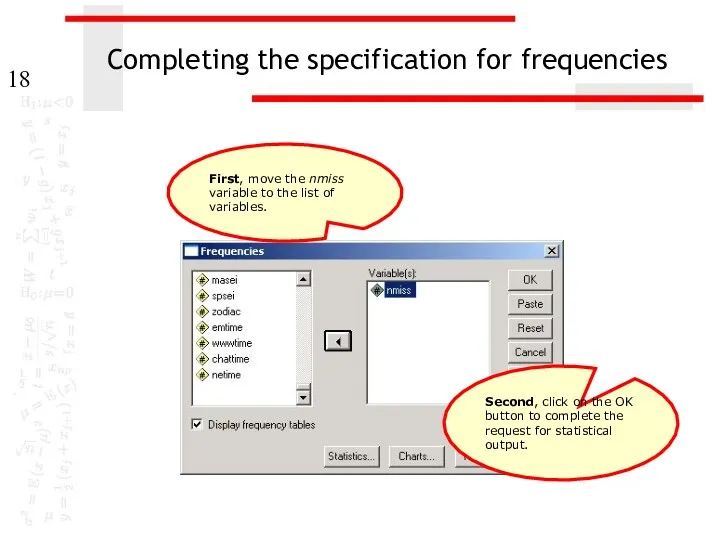
- 18. Completing the specification for frequencies Second, click on the OK button to complete the request for
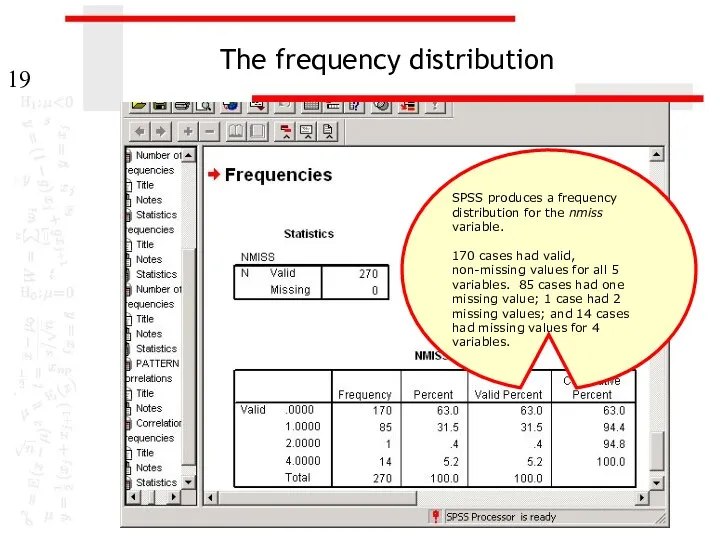
- 19. The frequency distribution SPSS produces a frequency distribution for the nmiss variable. 170 cases had valid,
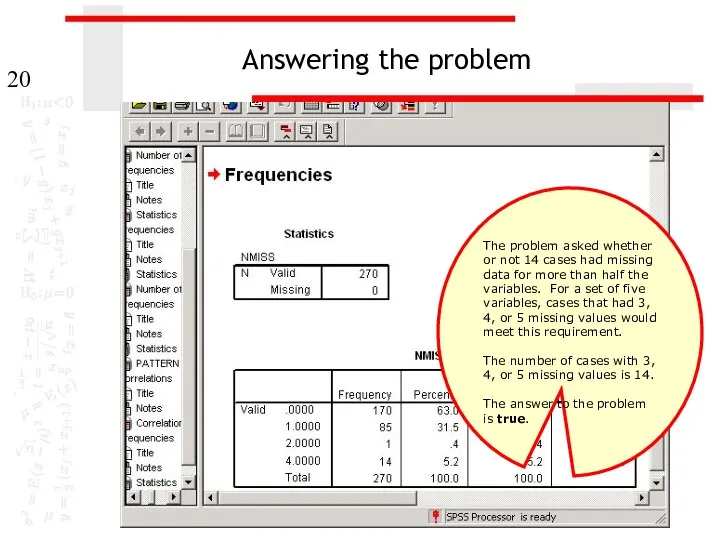
- 20. Answering the problem The problem asked whether or not 14 cases had missing data for more
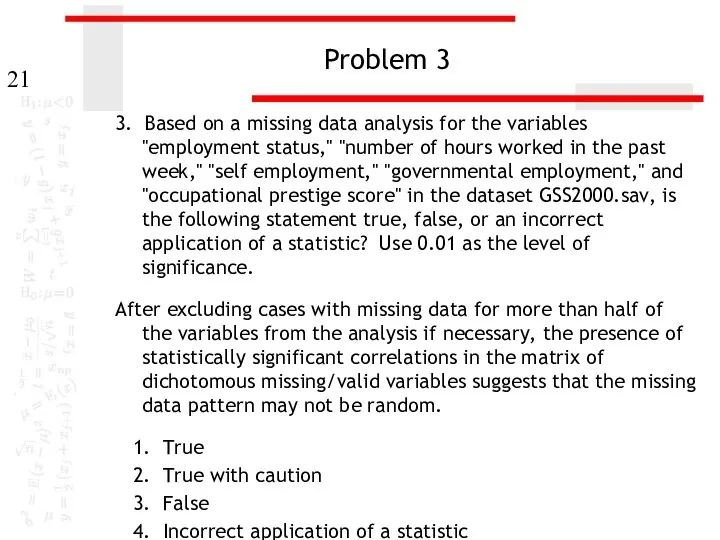
- 21. Problem 3 3. Based on a missing data analysis for the variables "employment status," "number of
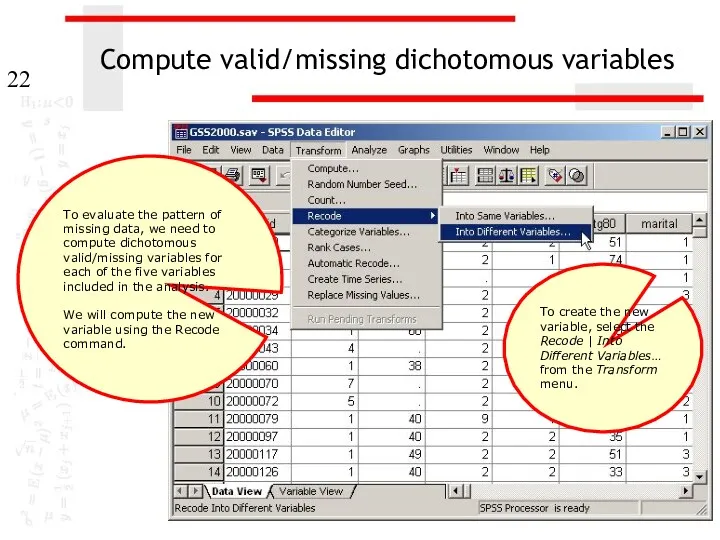
- 22. Compute valid/missing dichotomous variables To evaluate the pattern of missing data, we need to compute dichotomous
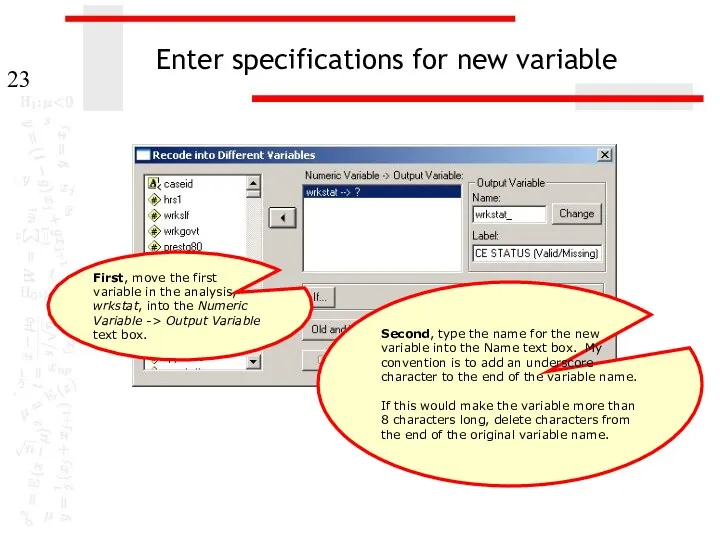
- 23. Enter specifications for new variable First, move the first variable in the analysis, wrkstat, into the
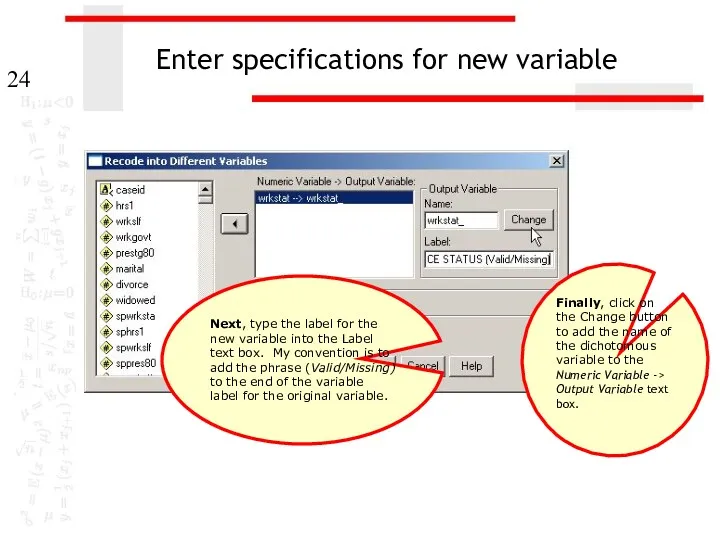
- 24. Enter specifications for new variable Next, type the label for the new variable into the Label
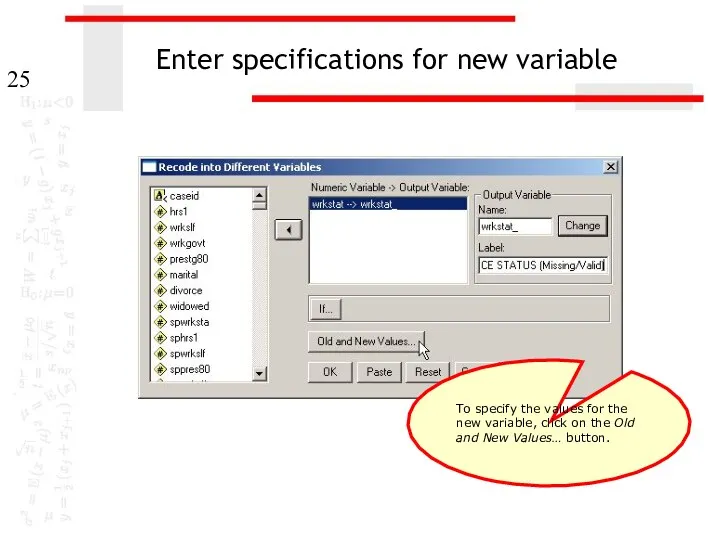
- 25. Enter specifications for new variable To specify the values for the new variable, click on the
- 26. Change the value for missing data The dichotomous variable should be coded 1 if the variable
- 27. Change the value for valid data First, mark the All other values option button. Second, type
- 28. Complete the value specifications Having entered the values for recoding the variable into dichotomous values, we
- 29. Complete the recode specifications Having entered specifications for the new variable and the values for recoding
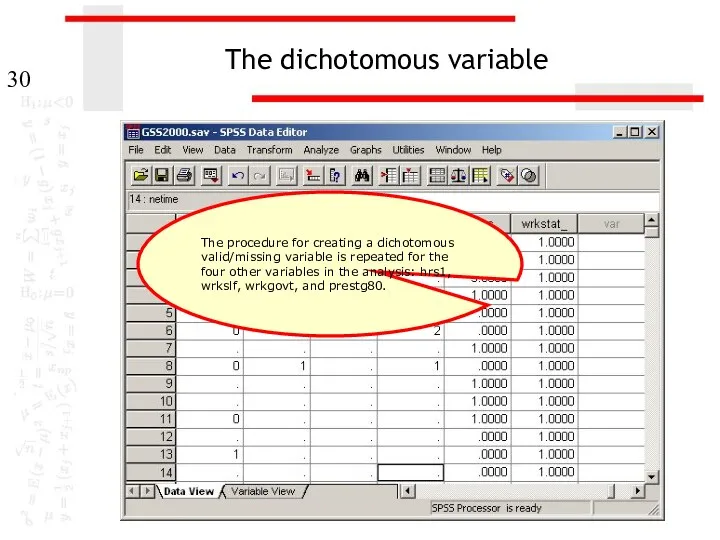
- 30. The dichotomous variable The procedure for creating a dichotomous valid/missing variable is repeated for the four
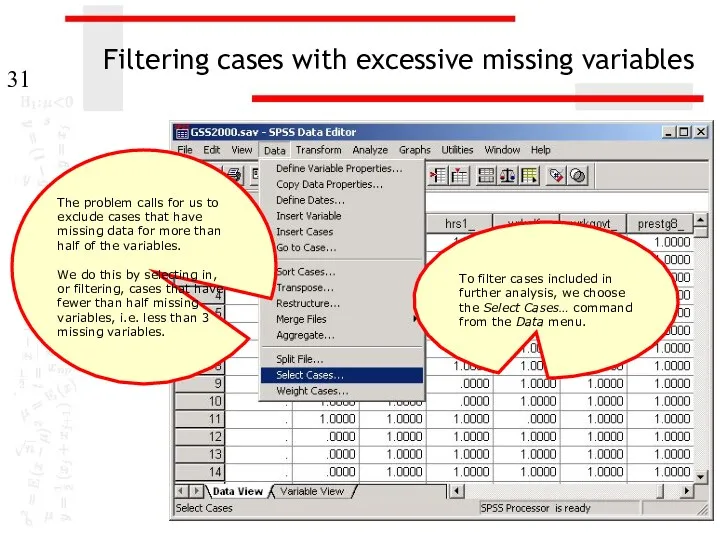
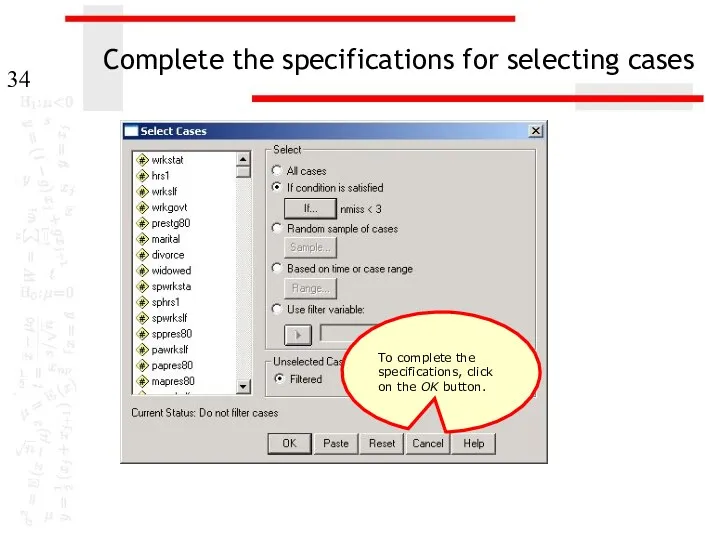
- 31. Filtering cases with excessive missing variables To filter cases included in further analysis, we choose the
- 32. Enter specifications for selecting cases Second, click on the If… button to enter the criteria for
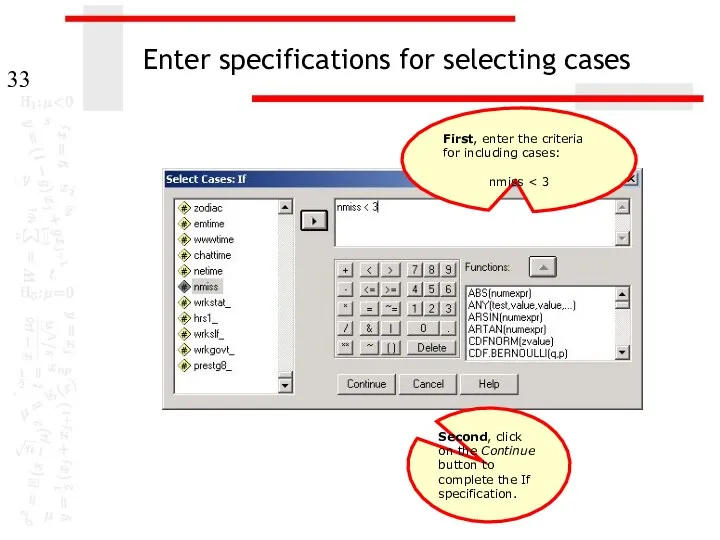
- 33. Enter specifications for selecting cases Second, click on the Continue button to complete the If specification.
- 34. Complete the specifications for selecting cases To complete the specifications, click on the OK button.
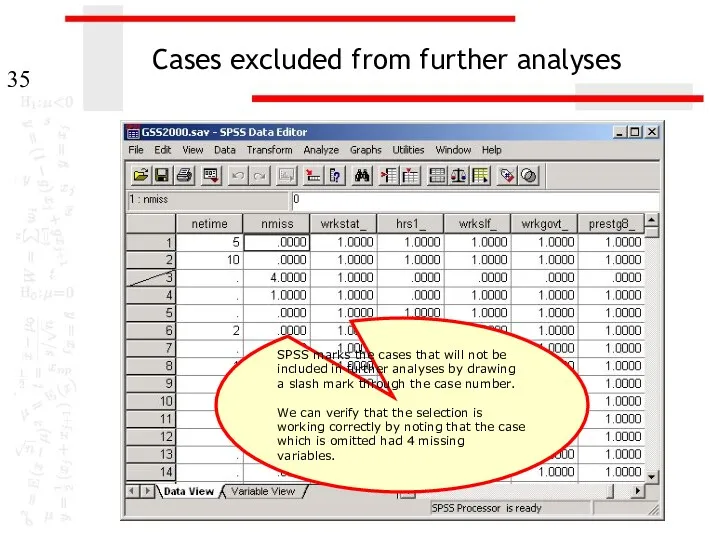
- 35. Cases excluded from further analyses SPSS marks the cases that will not be included in further
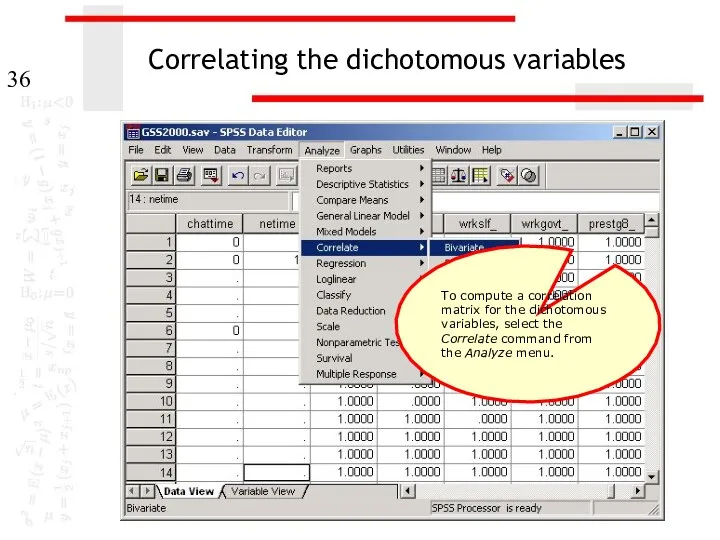
- 36. Correlating the dichotomous variables To compute a correlation matrix for the dichotomous variables, select the Correlate
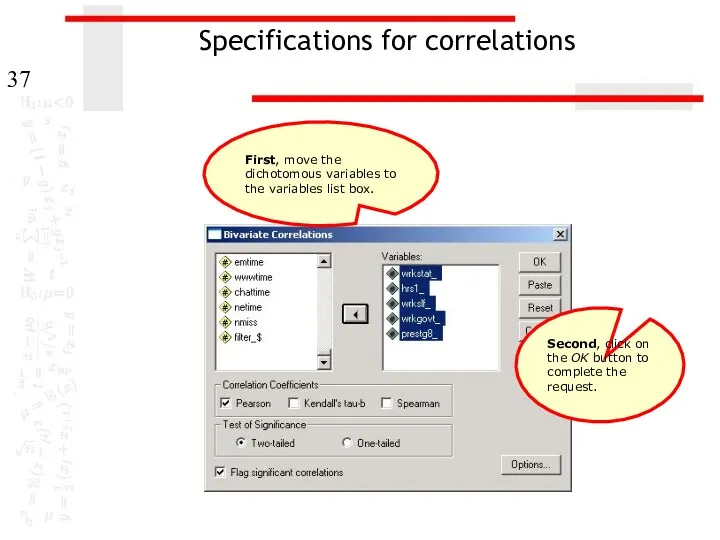
- 37. Specifications for correlations Second, click on the OK button to complete the request. First, move the
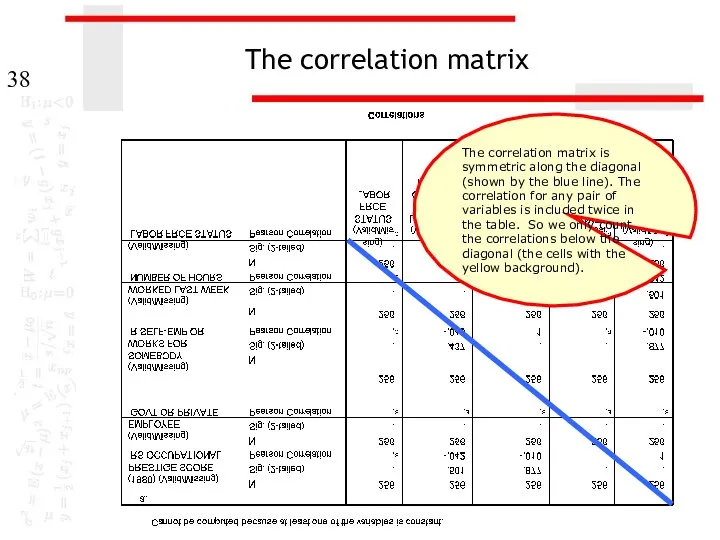
- 38. The correlation matrix The correlation matrix is symmetric along the diagonal (shown by the blue line).
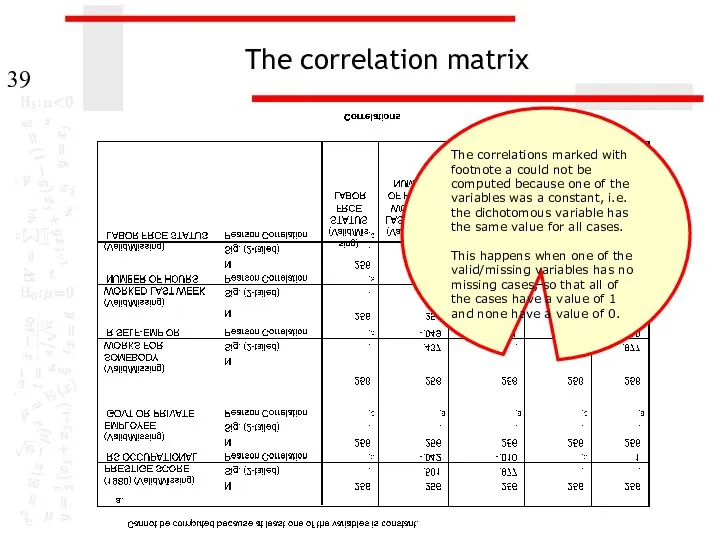
- 39. The correlation matrix The correlations marked with footnote a could not be computed because one of
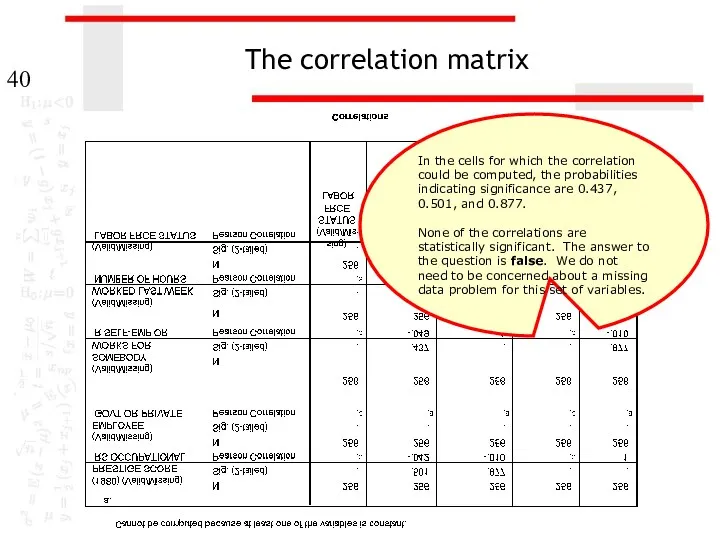
- 40. The correlation matrix In the cells for which the correlation could be computed, the probabilities indicating
- 41. Using scripts The process of evaluating missing data requires numerous SPSS procedures and outputs that are
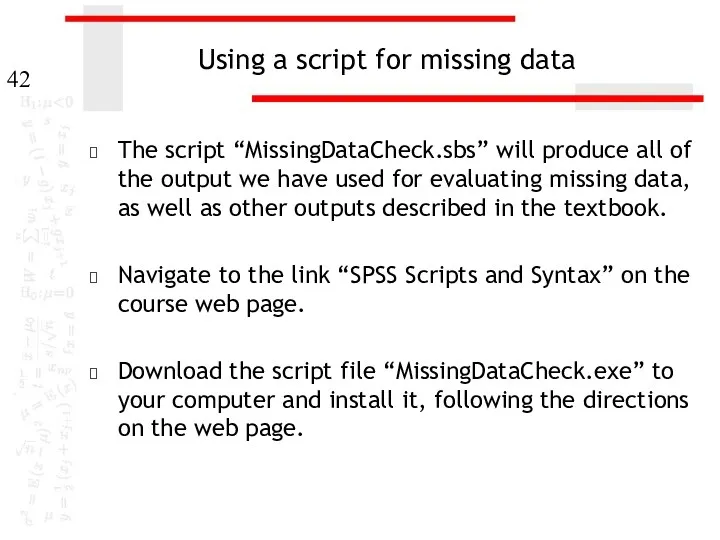
- 42. Using a script for missing data The script “MissingDataCheck.sbs” will produce all of the output we
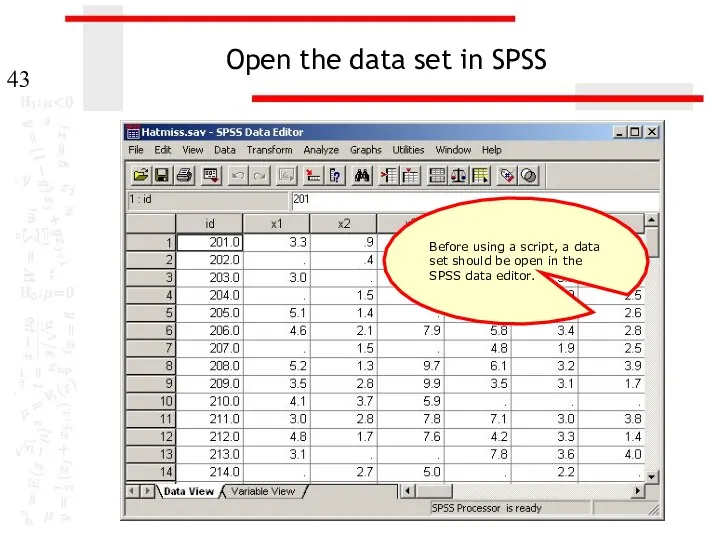
- 43. Open the data set in SPSS Before using a script, a data set should be open
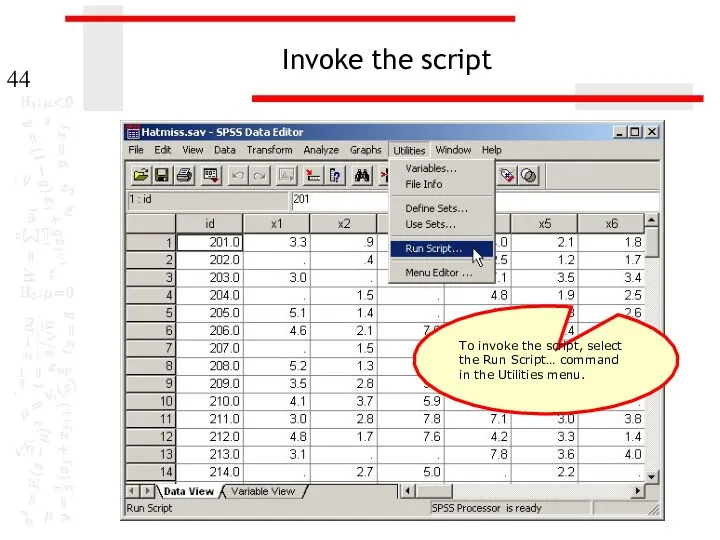
- 44. Invoke the script To invoke the script, select the Run Script… command in the Utilities menu.
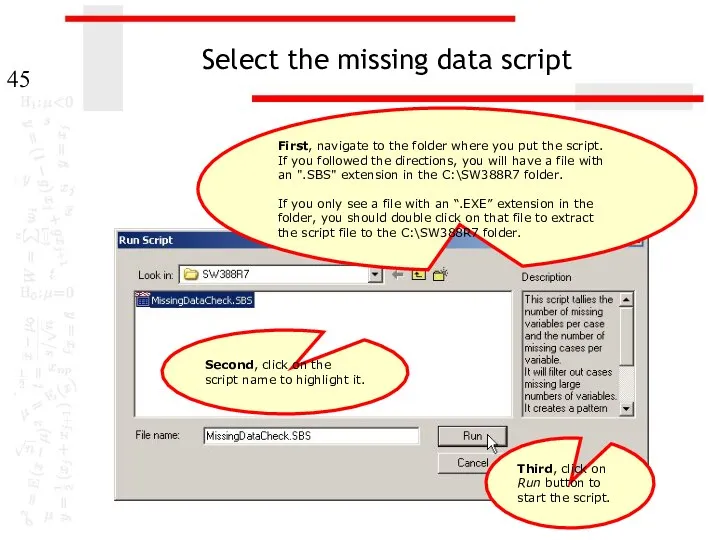
- 45. Select the missing data script First, navigate to the folder where you put the script. If
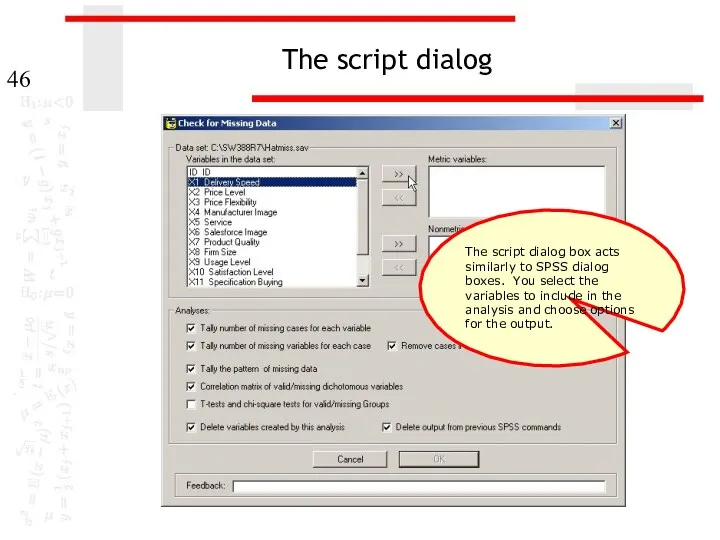
- 46. The script dialog The script dialog box acts similarly to SPSS dialog boxes. You select the
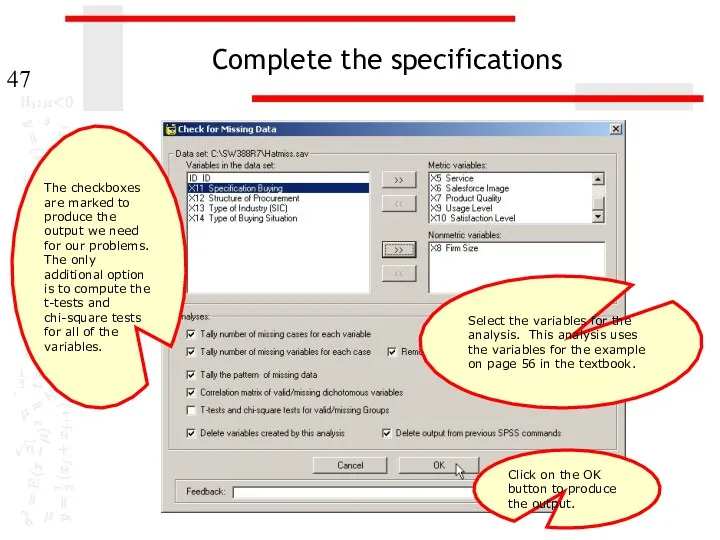
- 47. Complete the specifications Select the variables for the analysis. This analysis uses the variables for the
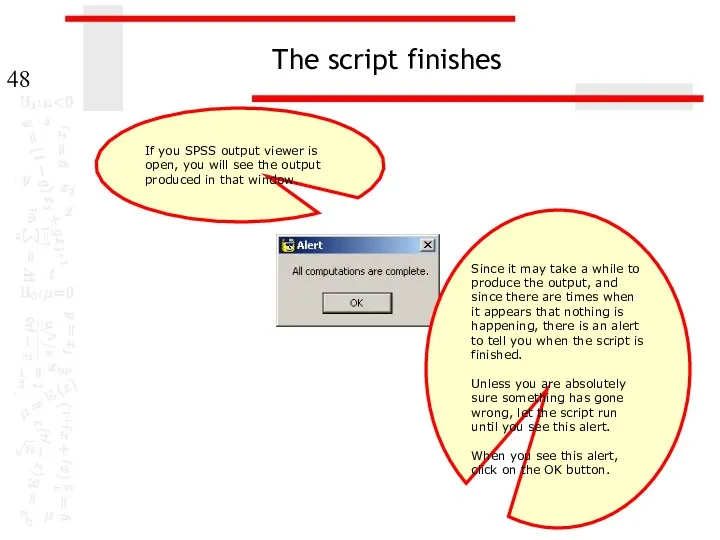
- 48. The script finishes If you SPSS output viewer is open, you will see the output produced
- 50. Скачать презентацию
Missing data and data analysis
Missing data is a problem in multivariate
Missing data and data analysis
Missing data is a problem in multivariate
Tools for evaluating missing data
SPSS has a specific package for evaluating
Tools for evaluating missing data
SPSS has a specific package for evaluating
Key issues in missing data analysis
We will focus on three key
Key issues in missing data analysis
We will focus on three key
Problem 1
1. Based on a missing data analysis for the variables
Problem 1
1. Based on a missing data analysis for the variables
Identifying the number of cases in the data set
This problem wants
Identifying the number of cases in the data set
This problem wants
Request frequency distributions
We will use the output for frequency distributions to
Request frequency distributions
We will use the output for frequency distributions to
Completing the specification for frequencies
Second, click on the OK button to
Completing the specification for frequencies
Second, click on the OK button to
Number of missing cases for each variable
In the table of statistics
Number of missing cases for each variable
In the table of statistics
Problem 2
2. Based on a missing data analysis for the variables
Problem 2
2. Based on a missing data analysis for the variables
Create a variable that counts missing data
We want to know how
Create a variable that counts missing data
We want to know how
Enter specifications for new variable
Third, click on the up arrow button
Enter specifications for new variable
Third, click on the up arrow button
Enter specifications for new variable
The NMISS function is moved into the
Enter specifications for new variable
The NMISS function is moved into the
Enter specifications for new variable
First, before we add another variable to
Enter specifications for new variable
First, before we add another variable to
Complete specifications for new variable
Continue adding variables to function until all
Complete specifications for new variable
Continue adding variables to function until all
The nmiss variable in the data editor
If we scroll the worksheet
The nmiss variable in the data editor
If we scroll the worksheet
A frequency distribution for nmiss
To answer the question of how many
A frequency distribution for nmiss
To answer the question of how many
Completing the specification for frequencies
Second, click on the OK button to
Completing the specification for frequencies
Second, click on the OK button to
The frequency distribution
SPSS produces a frequency distribution for the nmiss variable.
170
The frequency distribution
SPSS produces a frequency distribution for the nmiss variable.
170
Answering the problem
The problem asked whether or not 14 cases had
Answering the problem
The problem asked whether or not 14 cases had
Problem 3
3. Based on a missing data analysis for the variables
Problem 3
3. Based on a missing data analysis for the variables
Compute valid/missing dichotomous variables
To evaluate the pattern of missing data, we
Compute valid/missing dichotomous variables
To evaluate the pattern of missing data, we
Enter specifications for new variable
First, move the first variable in the
Enter specifications for new variable
First, move the first variable in the
Enter specifications for new variable
Next, type the label for the new
Enter specifications for new variable
Next, type the label for the new
Enter specifications for new variable
To specify the values for the new
Enter specifications for new variable
To specify the values for the new
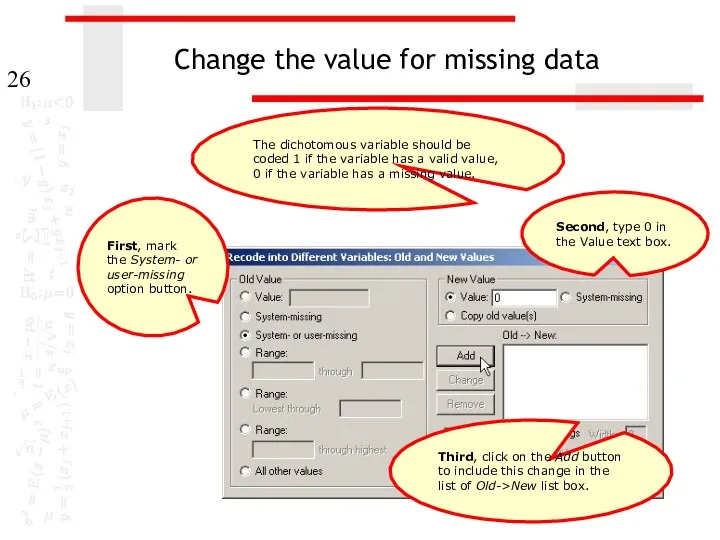
Change the value for missing data
The dichotomous variable should be coded
Change the value for missing data
The dichotomous variable should be coded
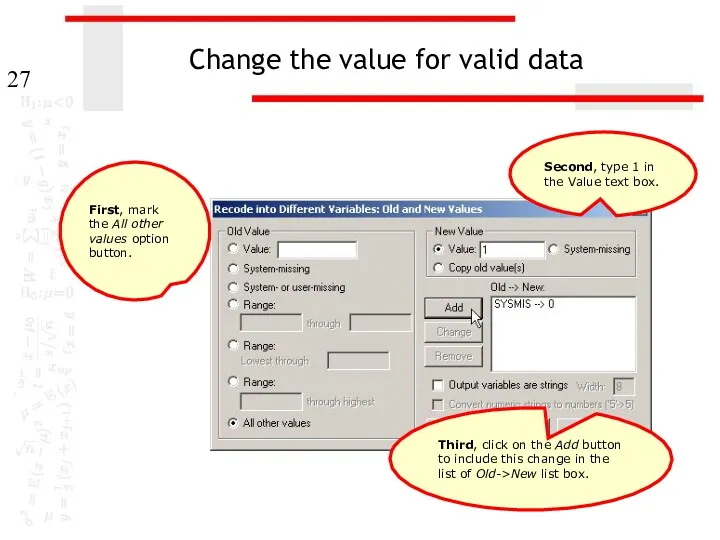
Change the value for valid data
First, mark the All other values
Change the value for valid data
First, mark the All other values
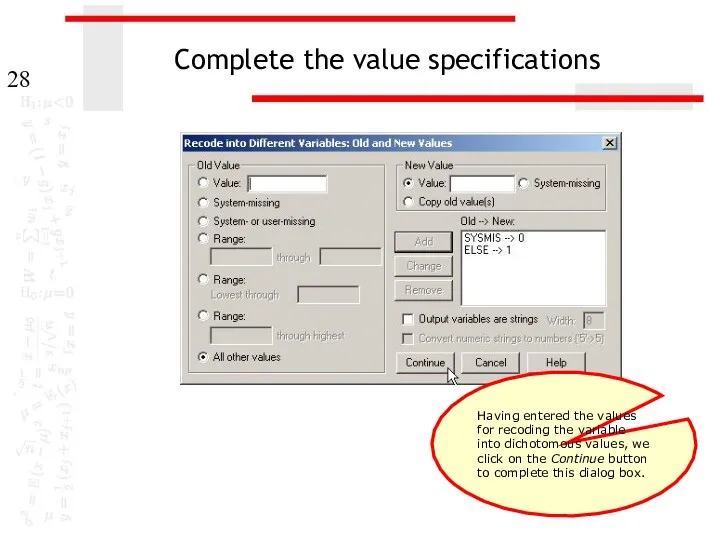
Complete the value specifications
Having entered the values for recoding the variable
Complete the value specifications
Having entered the values for recoding the variable
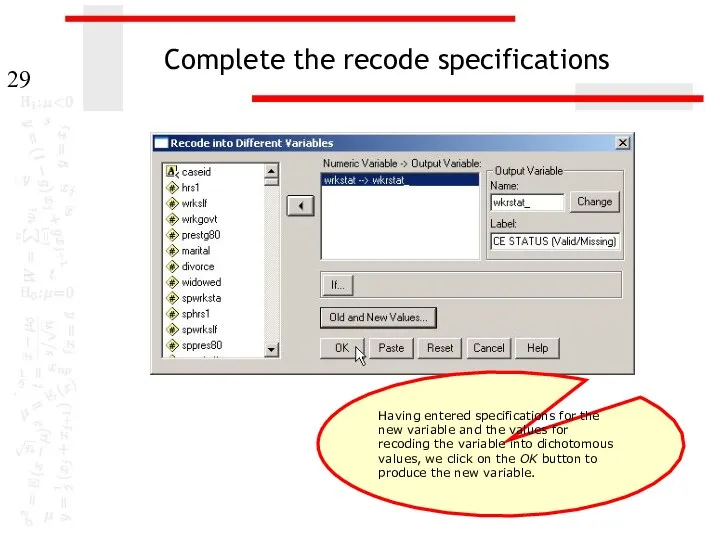
Complete the recode specifications
Having entered specifications for the new variable and
Complete the recode specifications
Having entered specifications for the new variable and
The dichotomous variable
The procedure for creating a dichotomous valid/missing variable is
The dichotomous variable
The procedure for creating a dichotomous valid/missing variable is
Filtering cases with excessive missing variables
To filter cases included in further
Filtering cases with excessive missing variables
To filter cases included in further
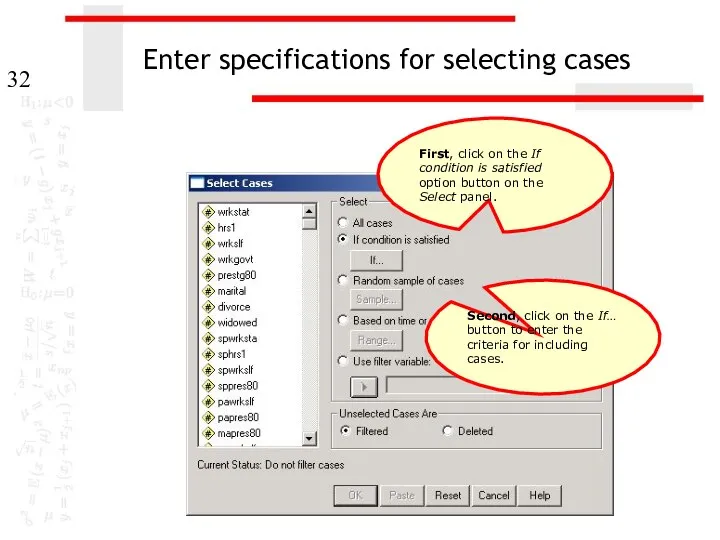
Enter specifications for selecting cases
Second, click on the If… button to
Enter specifications for selecting cases
Second, click on the If… button to
Enter specifications for selecting cases
Second, click on the Continue button to
Enter specifications for selecting cases
Second, click on the Continue button to
Complete the specifications for selecting cases
To complete the specifications, click on
Complete the specifications for selecting cases
To complete the specifications, click on
Cases excluded from further analyses
SPSS marks the cases that will not
Cases excluded from further analyses
SPSS marks the cases that will not
Correlating the dichotomous variables
To compute a correlation matrix for the dichotomous
Correlating the dichotomous variables
To compute a correlation matrix for the dichotomous
Specifications for correlations
Second, click on the OK button to complete the
Specifications for correlations
Second, click on the OK button to complete the
The correlation matrix
The correlation matrix is symmetric along the diagonal (shown
The correlation matrix
The correlation matrix is symmetric along the diagonal (shown
The correlation matrix
The correlations marked with footnote a could not be
The correlation matrix
The correlations marked with footnote a could not be
The correlation matrix
In the cells for which the correlation could be
The correlation matrix
In the cells for which the correlation could be
Using scripts
The process of evaluating missing data requires numerous SPSS procedures
Using scripts
The process of evaluating missing data requires numerous SPSS procedures
Using a script for missing data
The script “MissingDataCheck.sbs” will produce all
Using a script for missing data
The script “MissingDataCheck.sbs” will produce all
Open the data set in SPSS
Before using a script, a data
Open the data set in SPSS
Before using a script, a data
Invoke the script
To invoke the script, select the Run Script… command
Invoke the script
To invoke the script, select the Run Script… command
Select the missing data script
First, navigate to the folder where you
Select the missing data script
First, navigate to the folder where you
The script dialog
The script dialog box acts similarly to SPSS dialog
The script dialog
The script dialog box acts similarly to SPSS dialog
Complete the specifications
Select the variables for the analysis. This analysis uses
Complete the specifications
Select the variables for the analysis. This analysis uses
The script finishes
If you SPSS output viewer is open, you will
The script finishes
If you SPSS output viewer is open, you will
 Методы доступа к среде передачи данных. Метод доступа CSMA/CD. Этапы доступа к среде. Возникновение коллизии
 Викторина по информатике (презентация)
 Азбука журналистики
 презентация Алгебра логики. Основные понятия алгебры логики
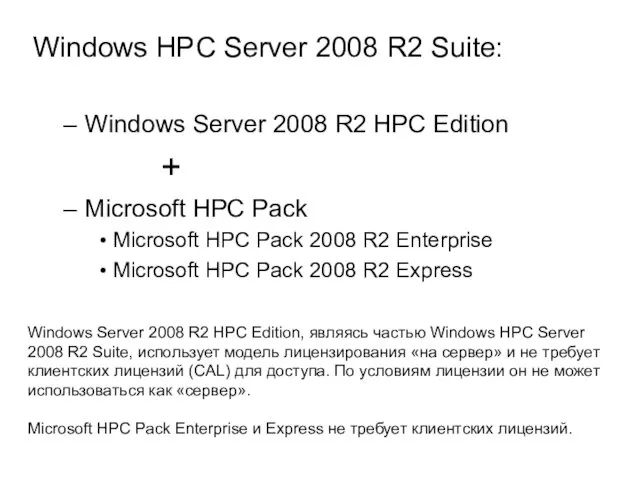 Win-кластер
 Поколения ЭВМ
 Как уберечься от недостоверной информации?
 Introduction of the ILS/VOR/DME
 Технология ATM. (Лекция 3)
 компьютерный тест по теме Устройства компьютера (информатика по программе Горячева А.В., 3 класс)
 Використання колонтитулів
 Информатика. Часть 1. Лекции по Microsoft Excel
 Intranet технологии. Электронный бизнес и коммерция
 Создание буклетов.
 Направления исследований. Протоколы USN
 Продвижение в инстаграм
 Отчет по производственной практике
 Защита от вредоносных программ
 Определение информационной безопасности. Классификация угроз безопасности. Лекция №1
 Лекция №6 Безопасность сети. Средства обеспечения безопасности сети
 Программирование циклов в Паскале
 Загадочный мир кодов. 5 класс
 Что же такое информатика
 Внеклассное мероприятия Компьютер –мой друг. 2 класс
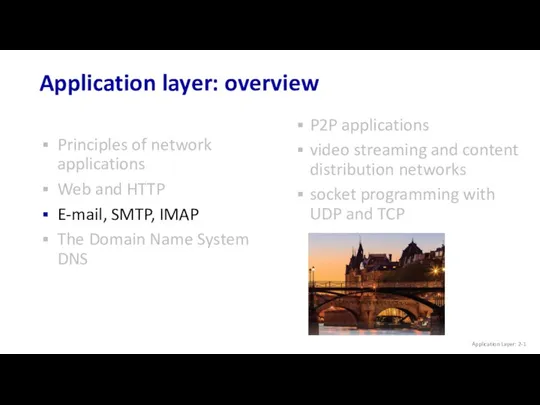 Application layer: overview
 Восприятие цвета человеком и цветовые модели
 Методика и дидактика мультимедийных уроков
 Офисные пакеты с учётом требований