- CCSv6 Tips & Tricks

Содержание
- 2. Tips and Tricks General Workspaces Getting Started views ‘Simple’ Perspective Windows and Views (basics) Installing Eclipse
- 3. GENERAL
- 4. Eclipse Concept: Workspaces Main working folder for CCS Contains information to manage all the projects defined
- 5. Use Multiple Workspaces Multiple Users: Keep separate workspaces for each user on a shared machine Custom
- 6. (Occasionally) Clean Your Workspace The workspace folder can get corrupted over time Good idea to periodically
- 7. View: Getting Started Access a variety of resources from the Getting Started page: Code examples Support
- 8. View: TI Resource Explorer Easily access a broad selection of software packages including: controlSUITE MSP430ware TivaWare
- 9. View: App Center Access a variety of TI content from the CCS App Center page Browse/install
- 10. Perspective: Simple Single perspective that combines just the most common features of the CCS Edit and
- 11. WINDOWS AND VIEWS
- 12. Window Types Tab Group: Several windows grouped together Editor: Only editor windows are part of this
- 13. Windowing Tips Double-clicking on the title bar of a window will maximize the window Double-clicking again
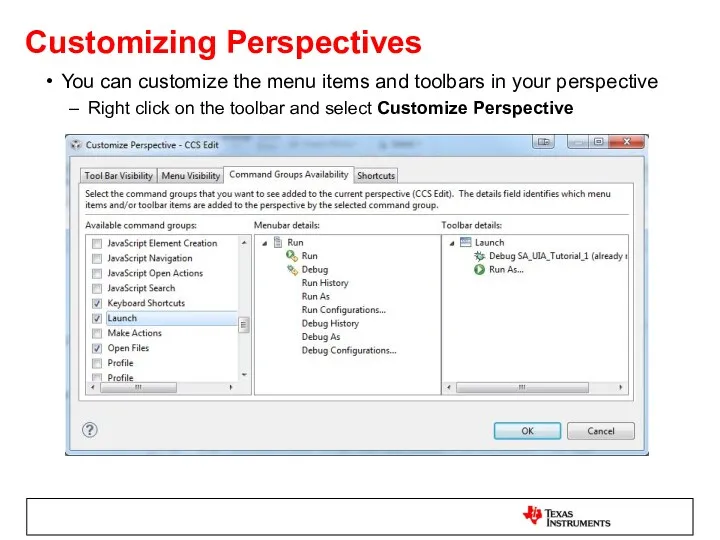
- 14. Customizing Perspectives You can customize the menu items and toolbars in your perspective Right click on
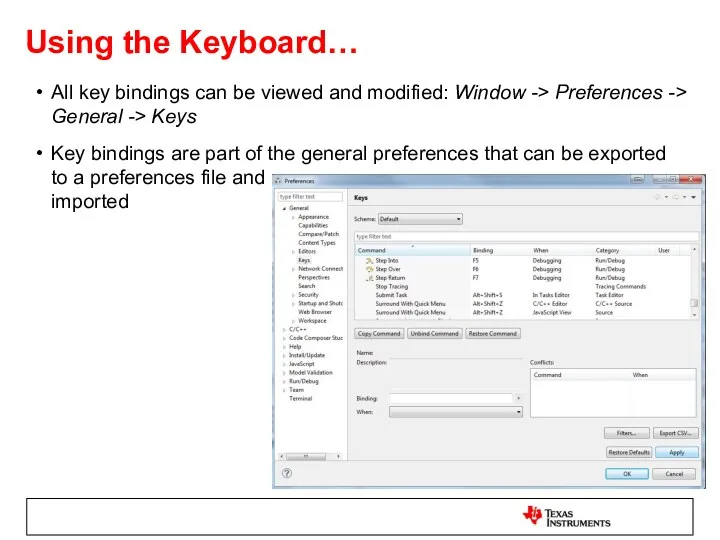
- 15. Using the Keyboard… All key bindings can be viewed and modified: Window -> Preferences -> General
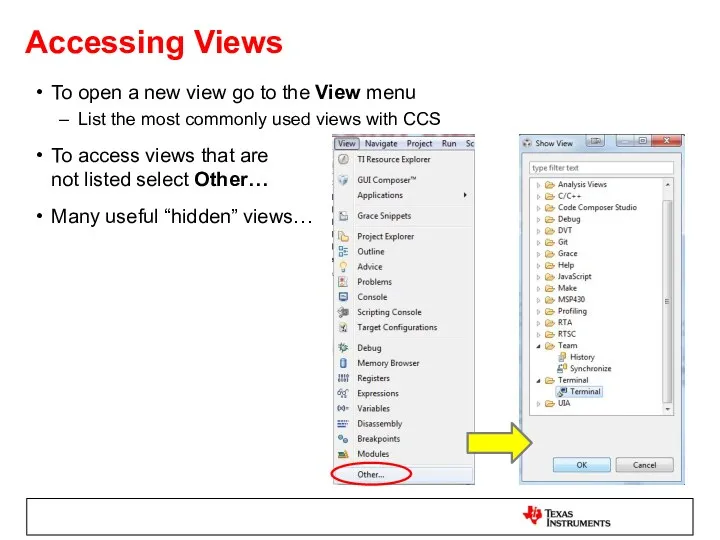
- 16. Accessing Views To open a new view go to the View menu List the most commonly
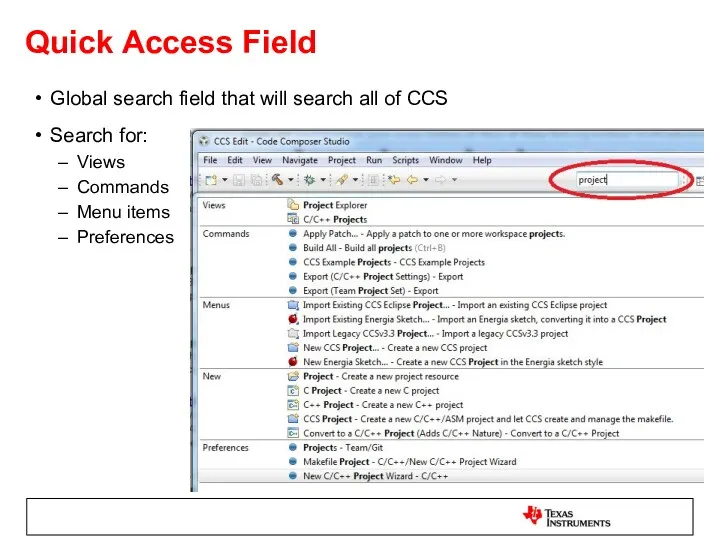
- 17. Quick Access Field Global search field that will search all of CCS Search for: Views Commands
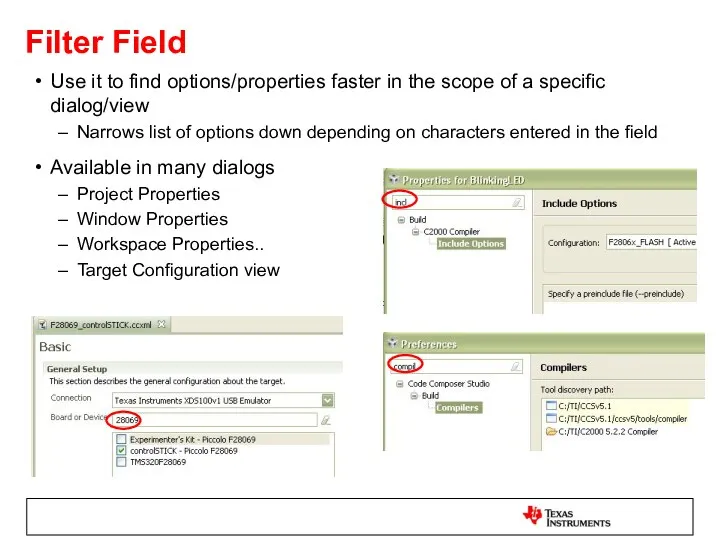
- 18. Filter Field Use it to find options/properties faster in the scope of a specific dialog/view Narrows
- 19. ECLIPSE PLUG-INS
- 20. Eclipse Plug-ins - Basics CCSv6 is based on Eclipse and is able to leverage many of
- 21. Eclipse Plug-ins - Marketplace Find additional Eclipse plug-ins from within CCS with the Eclipse Marketplace plug-in
- 22. Eclipse Plug-ins - Installation Use the Eclipse Update Manager to install plug-ins if the plug-in update
- 23. PROJECTS
- 24. Working Sets (1) Use working sets to group projects inside the Project Explorer Useful for multi-core
- 25. Working Sets (2) Select C/C++ as the type of working set and click Next Give your
- 26. Working Sets (3) Then go through the process again for the next working set. Once you
- 27. Parallel Builds Have a multi-core PC? Take advantage of all those cores to speed up your
- 28. Source Code Editor CCS comes with an excellent, feature rich editor Code Completion (CTRL+SPACE for suggestions)
- 29. Advanced Editor Features Code Completion Complete word Auto-member information Auto-parameter information Navigation Back/Forward buttons Back to
- 30. Advanced Editor Features Right-click in the editor margin to: Toggle line numbers in the editor margin
- 31. Edit Markers If you have the line number column on, it also indicates changes in your
- 32. Variable Highlighting Highlighting a variable in the editor will highlight all instances of the variable in
- 33. Source Templates CCS provides code templates Ex: Hello World Type in h in the editor and
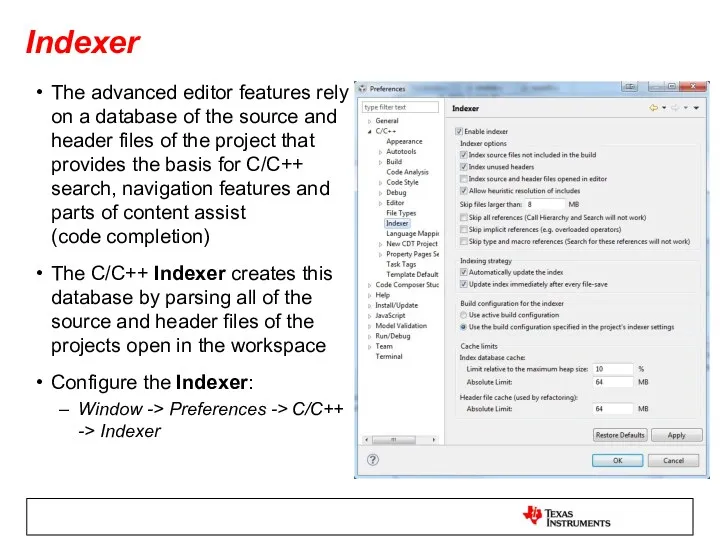
- 34. Indexer The advanced editor features rely on a database of the source and header files of
- 35. Indexer The Indexer can also be configured on a per project basis in the project properties
- 36. Performance Tip: Turn off the Indexer Don’t use the CCS editor or don’t need the advanced
- 37. Troubleshooting Tip: Rebuild the Index Advanced editor feature not working right? Code completion not working or
- 38. View: History CCS keeps a local history of source changes Switch to the CCS Edit perspective
- 39. Local History - Project CCS keeps a local history of files for the project Recover files
- 40. View: Outline Displays an outline of a structured file that is currently open in the editor
- 41. View: Include Browser Which header files is this source file including? Who is including this header
- 42. View: Call Hierarchy Displays callers and callees for a selected function Right-click on a function and
- 43. DEBUGGING
- 44. Debug Configurations Debug information created when a debug session is first launched for a project or
- 45. Debug Configurations Interface to manage existing configuration or to create new ones Existing debug configurations are
- 46. Debug Configurations – Main Options Use the Main tab to: Which target configuration to use Use
- 47. Debug Configurations – Program Options Use the Program tab to: Specify which CPU to load the
- 48. Debug Configurations – Target Options The Target tab can be used to set a variety of
- 49. Debug Configurations – Source Options The Source tab allows you to add additional source lookup search
- 50. Debug Configurations – Common Options The Common tab contains a collection of miscellaneous options Can specify
- 51. Troubleshooting Tip: Debug Configuration Having some strange debugger issues? Having problems launching a debug session? Can’t
- 52. Having target connection issues? Validate your physical JTAG connection to the device from the driver Use
- 53. Debugging Without a Project For project-less debug sessions, CCS will look for source files using relative
- 54. Method #1 (Recommended) If a source file cannot be found during debug, it will be indicated
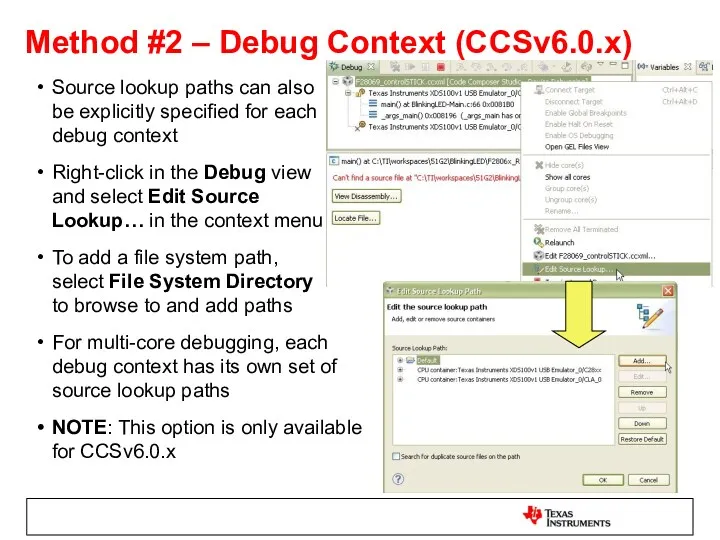
- 55. Method #2 – Debug Context (CCSv6.0.x) Source lookup paths can also be explicitly specified for each
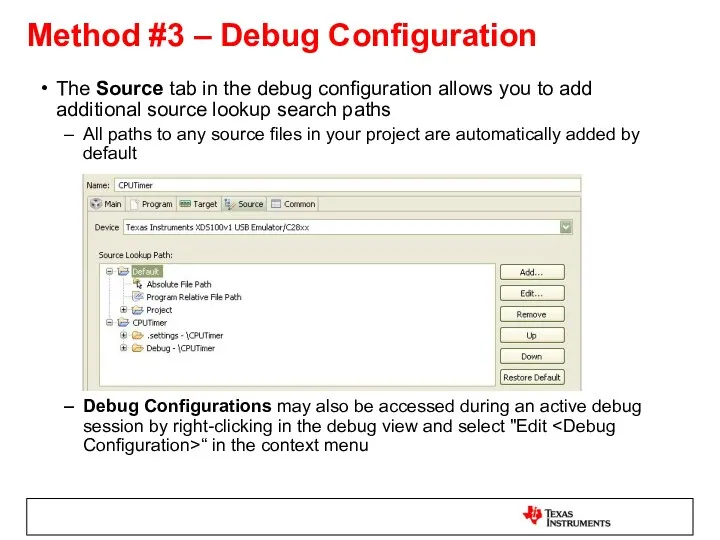
- 56. The Source tab in the debug configuration allows you to add additional source lookup search paths
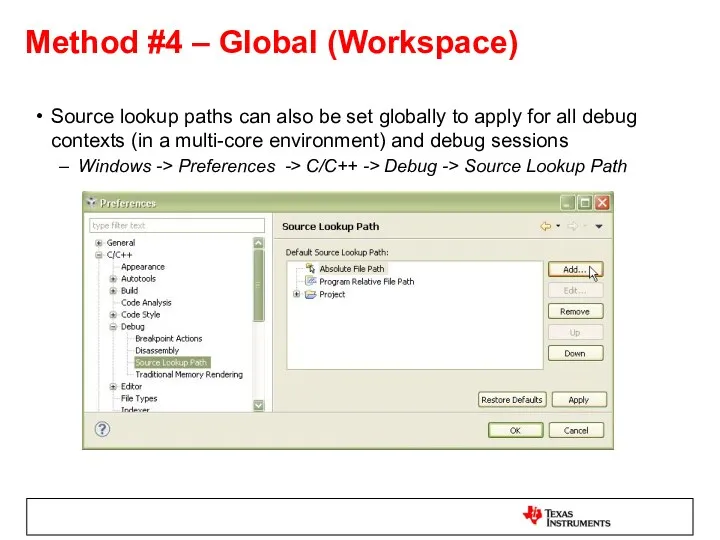
- 57. Method #4 – Global (Workspace) Source lookup paths can also be set globally to apply for
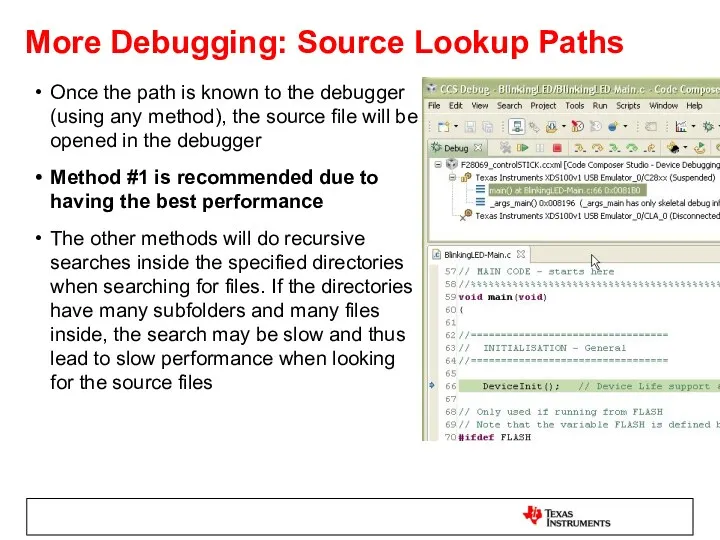
- 58. More Debugging: Source Lookup Paths Once the path is known to the debugger (using any method),
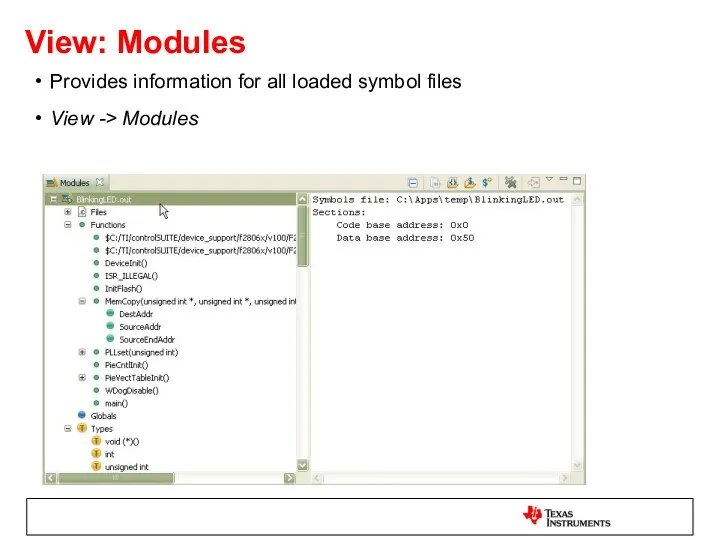
- 59. View: Modules Provides information for all loaded symbol files View -> Modules
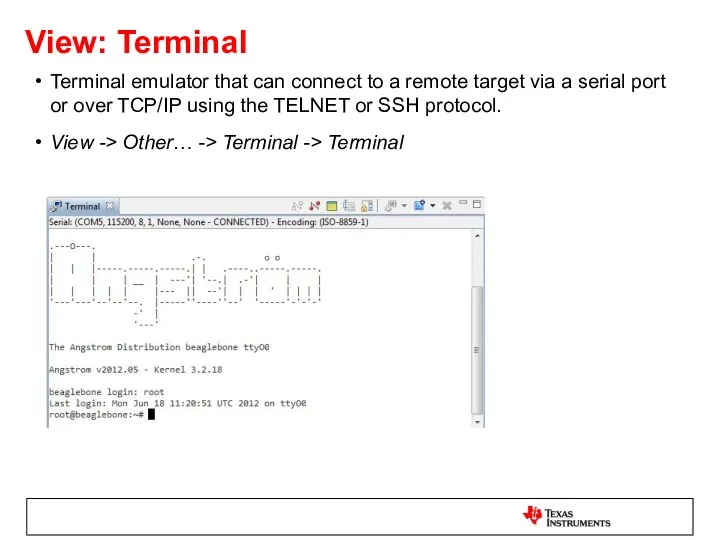
- 60. View: Terminal Terminal emulator that can connect to a remote target via a serial port or
- 62. Скачать презентацию
Tips and Tricks
General
Workspaces
Getting Started views
‘Simple’ Perspective
Windows and Views (basics)
Installing Eclipse Plug-ins
Projects
Working
Tips and Tricks
General
Workspaces
Getting Started views
‘Simple’ Perspective
Windows and Views (basics)
Installing Eclipse Plug-ins
Projects
Working
GENERAL
GENERAL
Eclipse Concept: Workspaces
Main working folder for CCS
Contains information to manage all
Eclipse Concept: Workspaces
Main working folder for CCS
Contains information to manage all
Use Multiple Workspaces
Multiple Users: Keep separate workspaces for each user on
Use Multiple Workspaces
Multiple Users: Keep separate workspaces for each user on
(Occasionally) Clean Your Workspace
The workspace folder can get corrupted over time
Good
(Occasionally) Clean Your Workspace
The workspace folder can get corrupted over time
Good
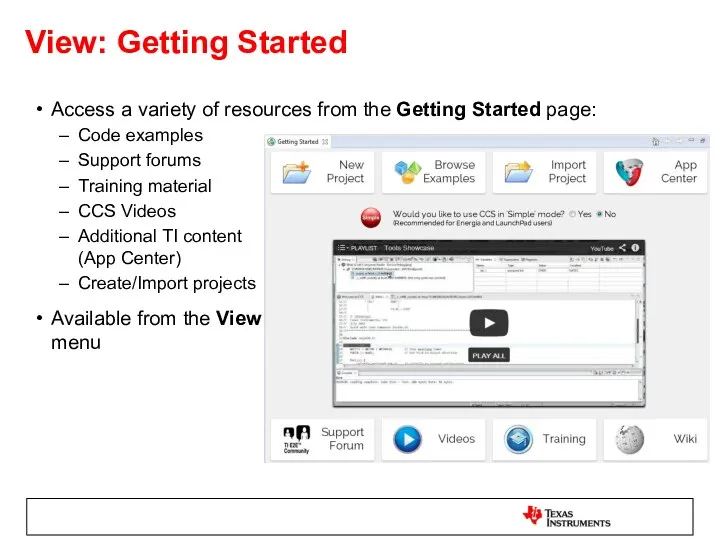
View: Getting Started
Access a variety of resources from the Getting Started
View: Getting Started
Access a variety of resources from the Getting Started
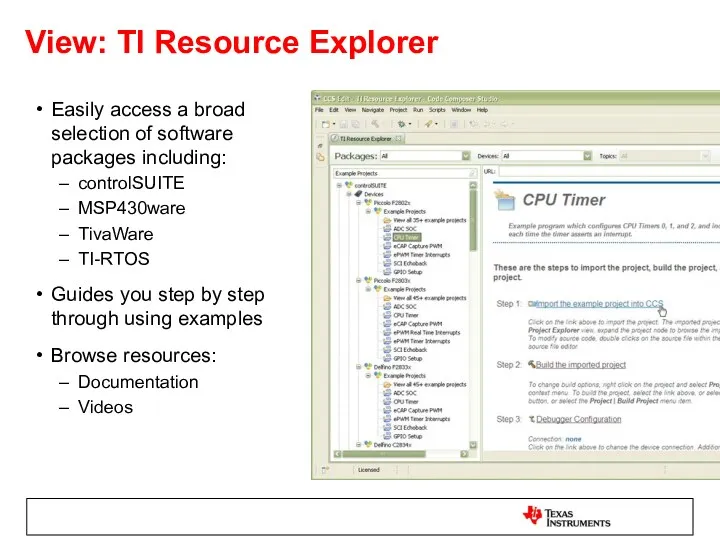
View: TI Resource Explorer
Easily access a broad selection of software packages
View: TI Resource Explorer
Easily access a broad selection of software packages
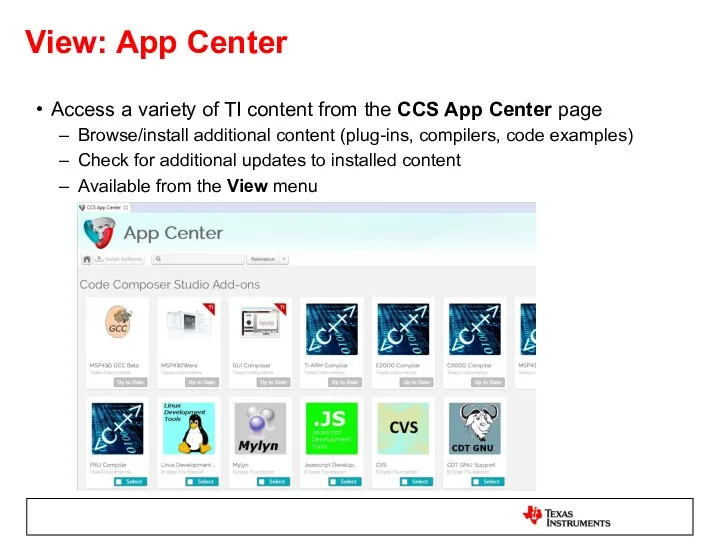
View: App Center
Access a variety of TI content from the CCS
View: App Center
Access a variety of TI content from the CCS
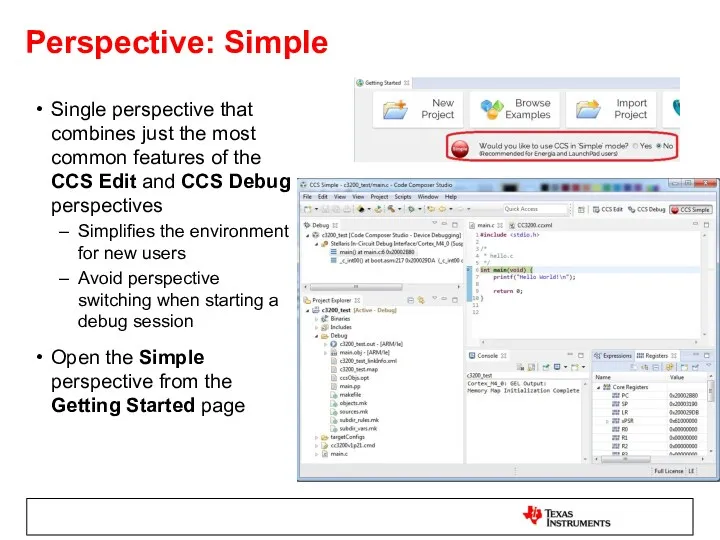
Perspective: Simple
Single perspective that combines just the most common features of
Perspective: Simple
Single perspective that combines just the most common features of
WINDOWS AND VIEWS
WINDOWS AND VIEWS
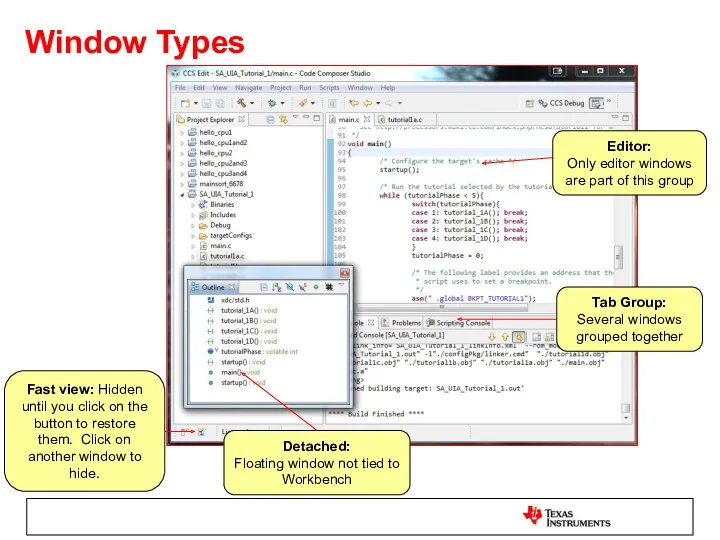
Window Types
Tab Group:
Several windows
grouped together
Editor:
Only editor windows are part
Window Types
Tab Group:
Several windows
grouped together
Editor: Only editor windows are part
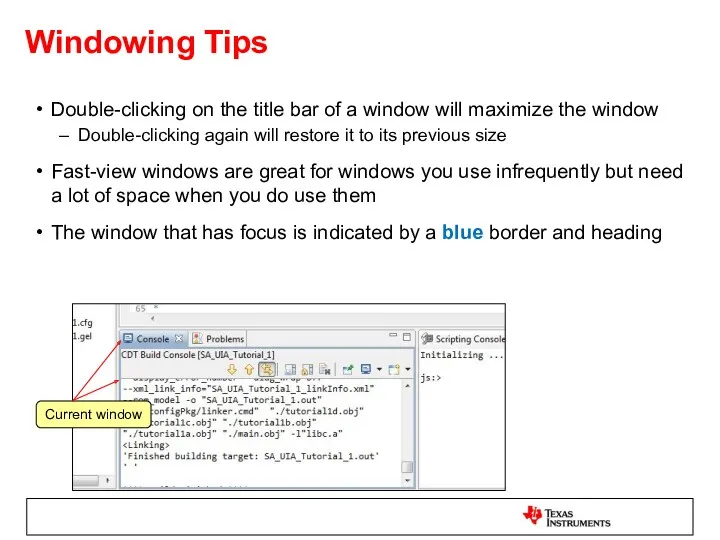
Windowing Tips
Double-clicking on the title bar of a window will maximize
Windowing Tips
Double-clicking on the title bar of a window will maximize
Customizing Perspectives
You can customize the menu items and toolbars in your
Customizing Perspectives
You can customize the menu items and toolbars in your
Using the Keyboard…
All key bindings can be viewed and modified: Window
Using the Keyboard…
All key bindings can be viewed and modified: Window
Accessing Views
To open a new view go to the View menu
List
Accessing Views
To open a new view go to the View menu
List
Quick Access Field
Global search field that will search all of CCS
Search
Quick Access Field
Global search field that will search all of CCS
Search
Filter Field
Use it to find options/properties faster in the scope of
Filter Field
Use it to find options/properties faster in the scope of
ECLIPSE PLUG-INS
ECLIPSE PLUG-INS
Eclipse Plug-ins - Basics
CCSv6 is based on Eclipse and is able
Eclipse Plug-ins - Basics
CCSv6 is based on Eclipse and is able
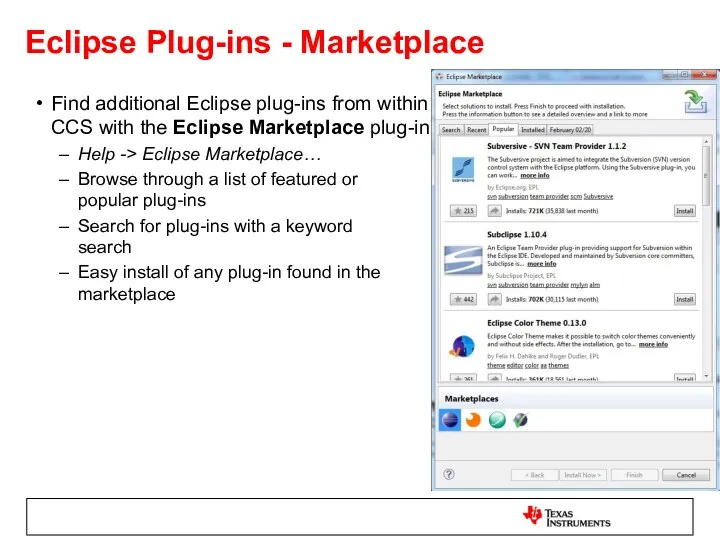
Eclipse Plug-ins - Marketplace
Find additional Eclipse plug-ins from within
CCS with the
Eclipse Plug-ins - Marketplace
Find additional Eclipse plug-ins from within CCS with the
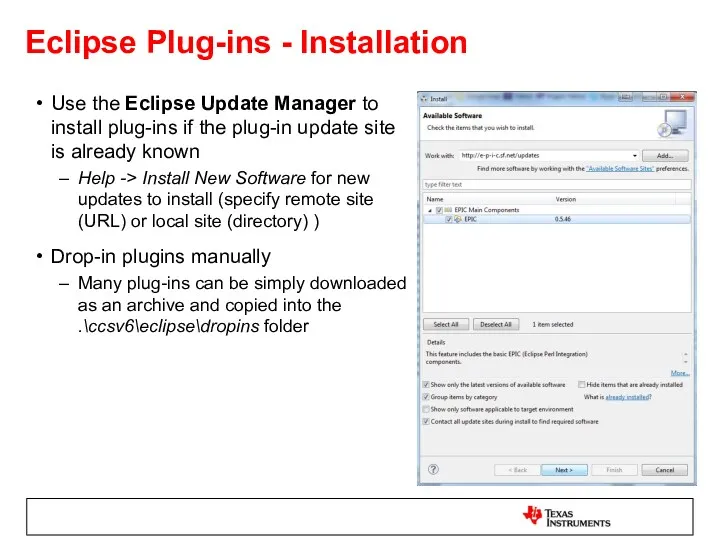
Eclipse Plug-ins - Installation
Use the Eclipse Update Manager to
install plug-ins if
Eclipse Plug-ins - Installation
Use the Eclipse Update Manager to install plug-ins if
PROJECTS
PROJECTS
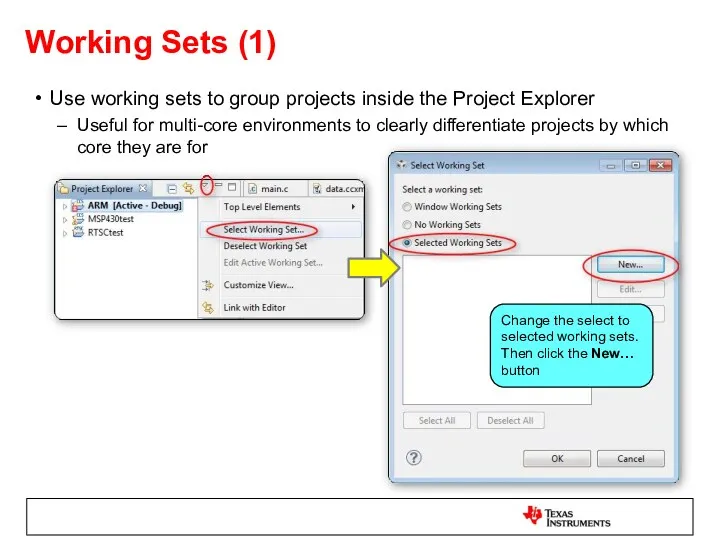
Working Sets (1)
Use working sets to group projects inside the Project
Working Sets (1)
Use working sets to group projects inside the Project
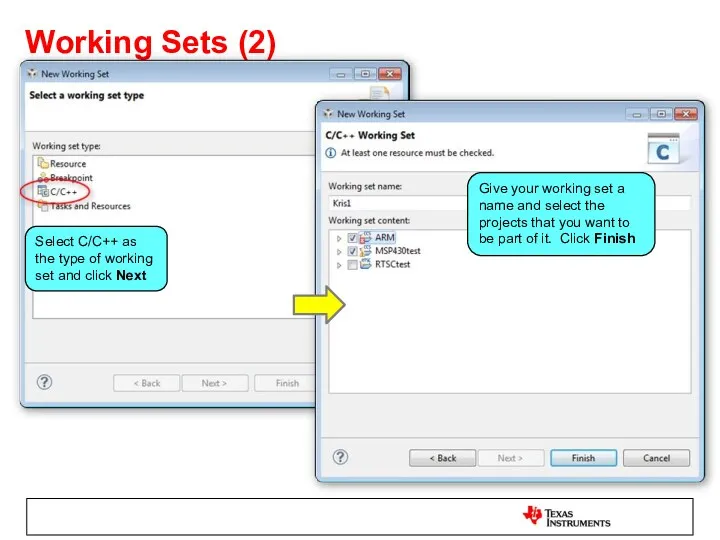
Working Sets (2)
Select C/C++ as the type of working set and
Working Sets (2)
Select C/C++ as the type of working set and
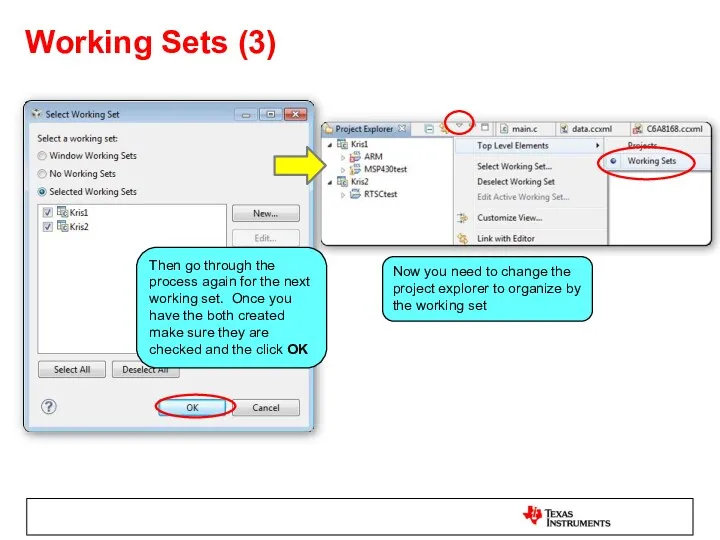
Working Sets (3)
Then go through the process again for the next
Working Sets (3)
Then go through the process again for the next
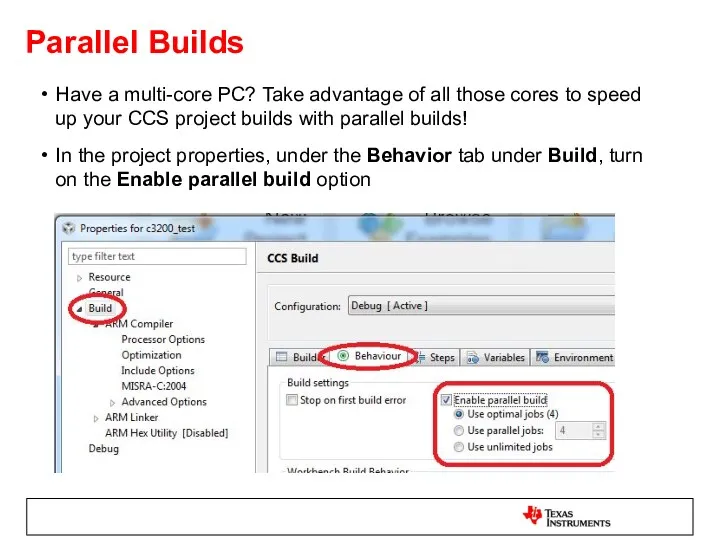
Parallel Builds
Have a multi-core PC? Take advantage of all those cores
Parallel Builds
Have a multi-core PC? Take advantage of all those cores
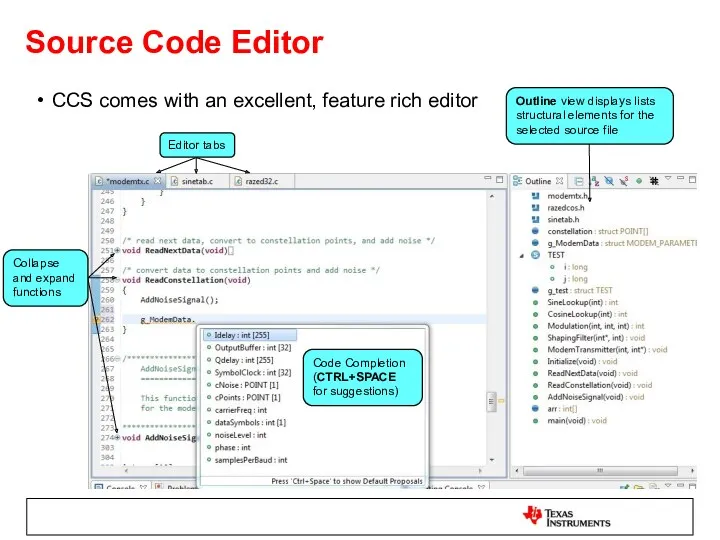
Source Code Editor
CCS comes with an excellent, feature rich editor
Code Completion
Source Code Editor
CCS comes with an excellent, feature rich editor
Code Completion
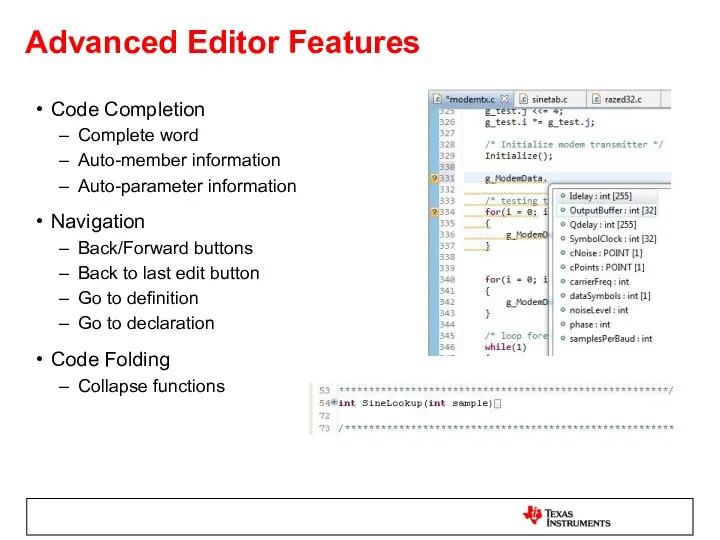
Advanced Editor Features
Code Completion
Complete word
Auto-member information
Auto-parameter information
Navigation
Back/Forward buttons
Back to last edit
Advanced Editor Features
Code Completion
Complete word
Auto-member information
Auto-parameter information
Navigation
Back/Forward buttons
Back to last edit
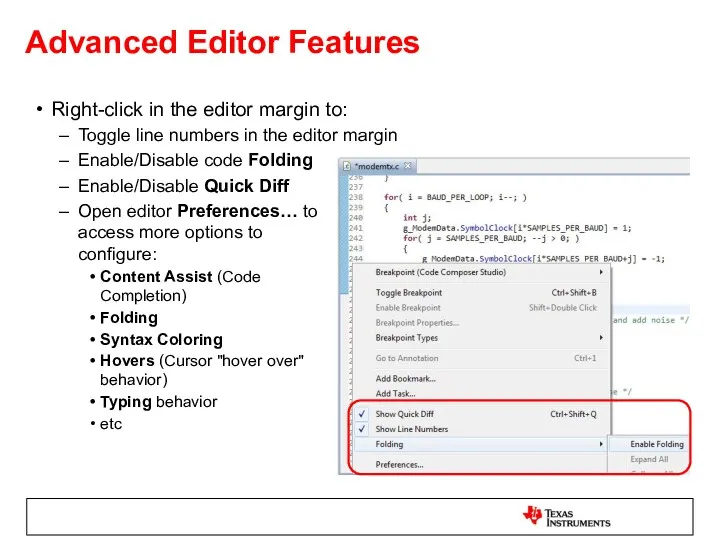
Advanced Editor Features
Right-click in the editor margin to:
Toggle line numbers in
Advanced Editor Features
Right-click in the editor margin to:
Toggle line numbers in
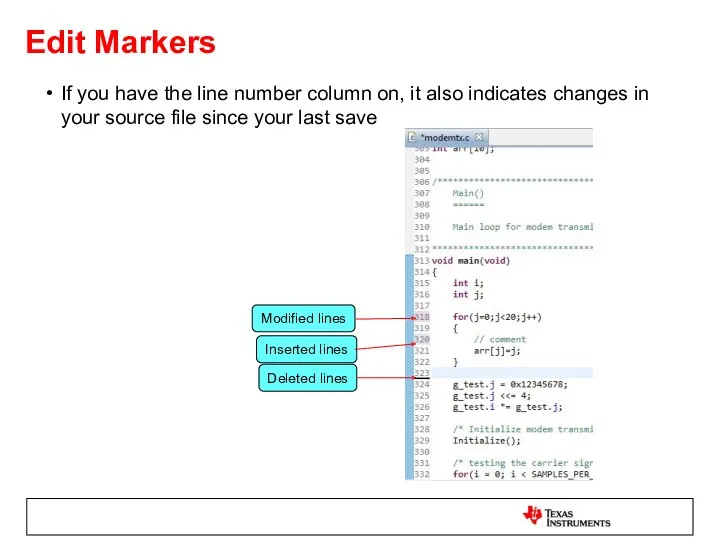
Edit Markers
If you have the line number column on, it also
Edit Markers
If you have the line number column on, it also
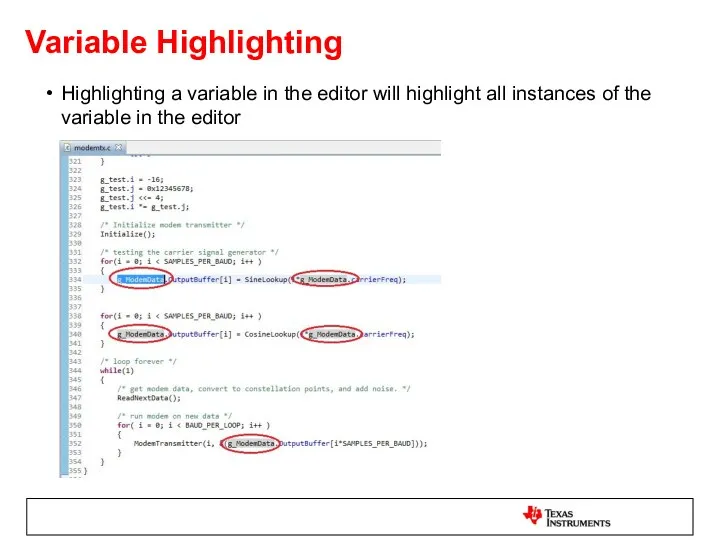
Variable Highlighting
Highlighting a variable in the editor will highlight all instances
Variable Highlighting
Highlighting a variable in the editor will highlight all instances
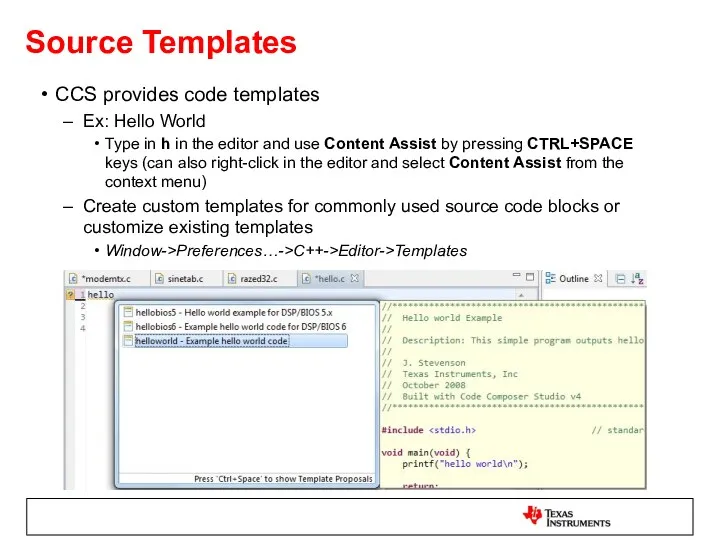
Source Templates
CCS provides code templates
Ex: Hello World
Type in h in
Source Templates
CCS provides code templates
Ex: Hello World
Type in h in
Indexer
The advanced editor features rely
on a database of the source and
Indexer
The advanced editor features rely on a database of the source and
Indexer
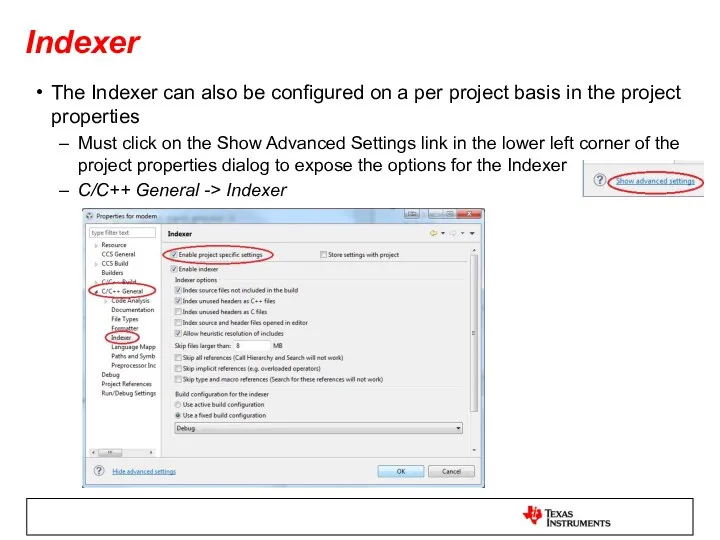
The Indexer can also be configured on a per project basis
Indexer
The Indexer can also be configured on a per project basis
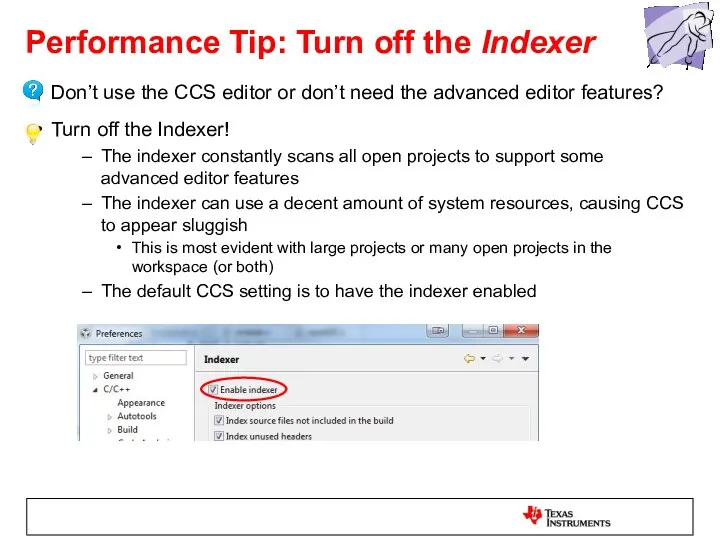
Performance Tip: Turn off the Indexer
Don’t use the CCS editor or
Performance Tip: Turn off the Indexer
Don’t use the CCS editor or
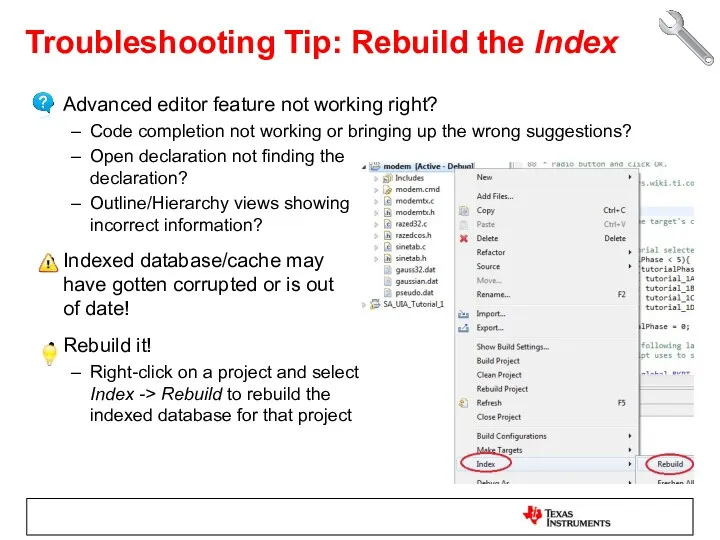
Troubleshooting Tip: Rebuild the Index
Advanced editor feature not working right?
Code completion
Troubleshooting Tip: Rebuild the Index
Advanced editor feature not working right?
Code completion
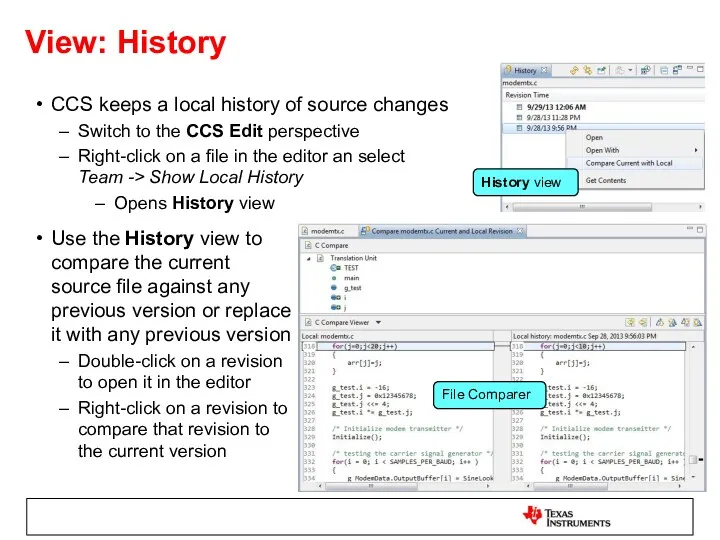
View: History
CCS keeps a local history of source changes
Switch to the
View: History
CCS keeps a local history of source changes
Switch to the
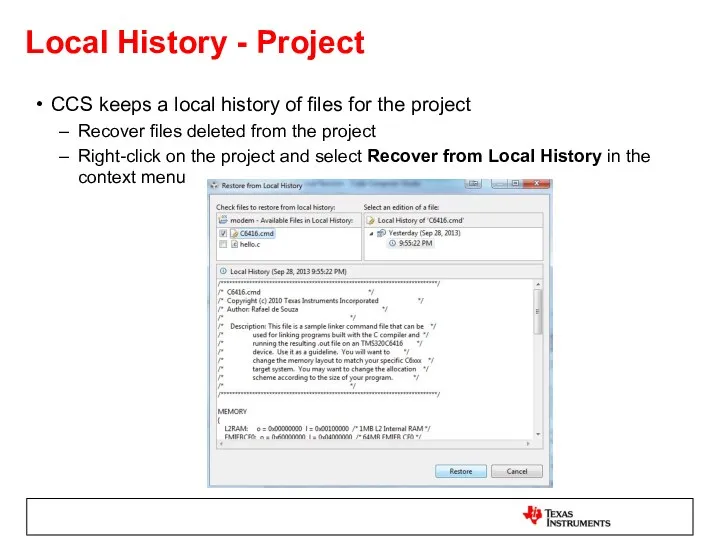
Local History - Project
CCS keeps a local history of files for
Local History - Project
CCS keeps a local history of files for
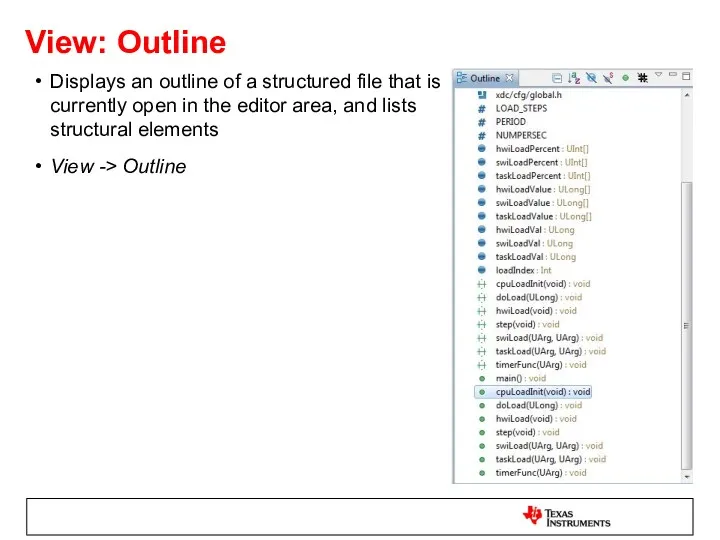
View: Outline
Displays an outline of a structured file that is
currently
View: Outline
Displays an outline of a structured file that is currently
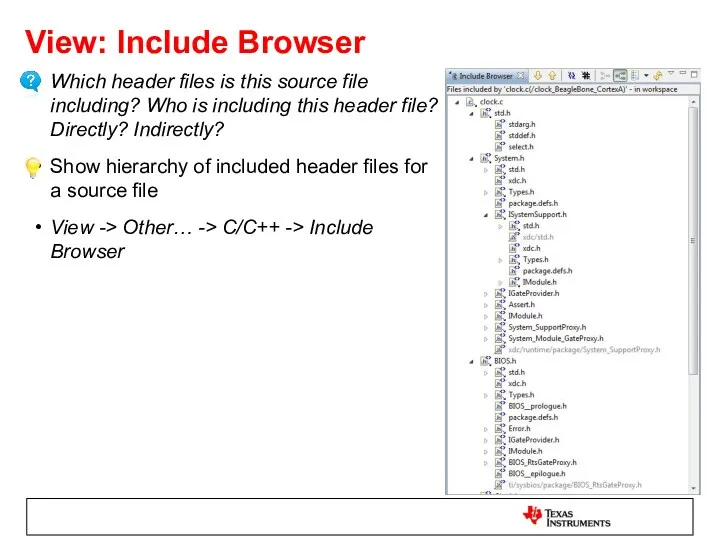
View: Include Browser
Which header files is this source file
including? Who
View: Include Browser
Which header files is this source file including? Who
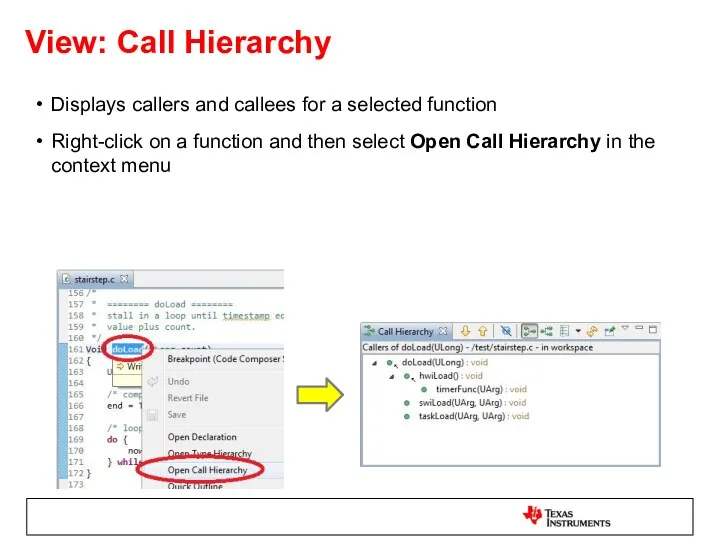
View: Call Hierarchy
Displays callers and callees for a selected function
Right-click on
View: Call Hierarchy
Displays callers and callees for a selected function
Right-click on

DEBUGGING
DEBUGGING
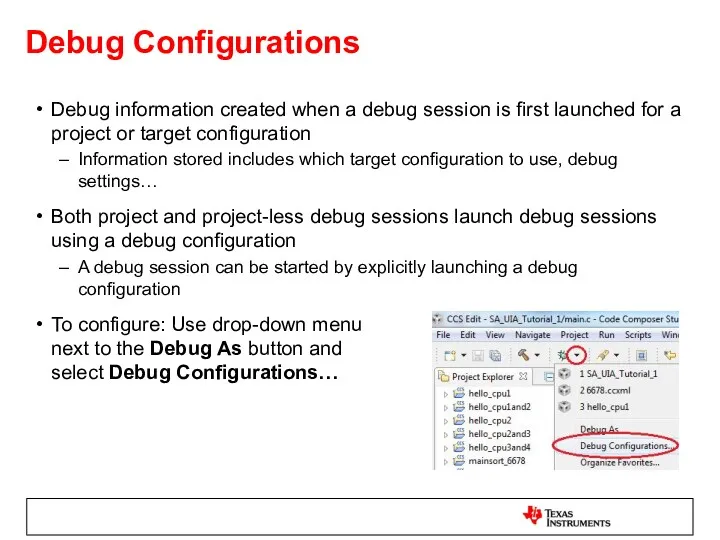
Debug Configurations
Debug information created when a debug session is first launched
Debug Configurations
Debug information created when a debug session is first launched
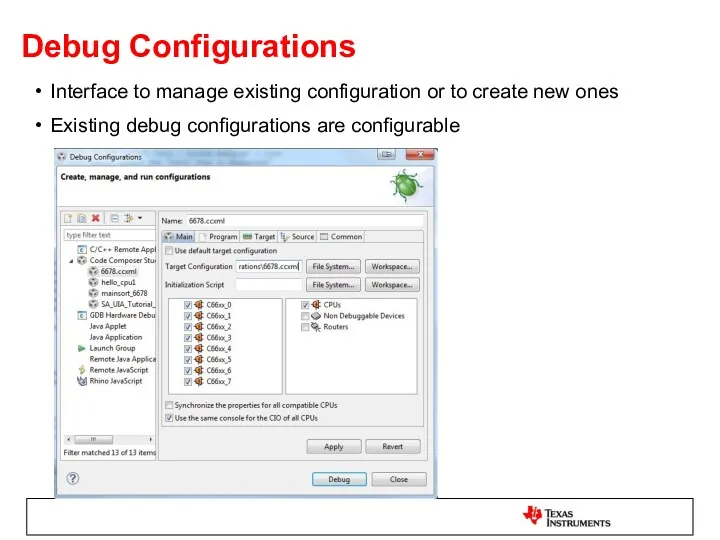
Debug Configurations
Interface to manage existing configuration or to create new ones
Existing
Debug Configurations
Interface to manage existing configuration or to create new ones
Existing
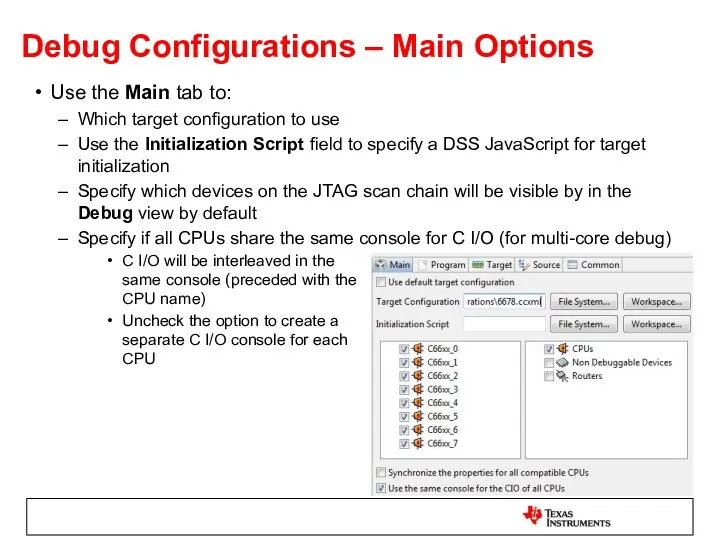
Debug Configurations – Main Options
Use the Main tab to:
Which target configuration
Debug Configurations – Main Options
Use the Main tab to:
Which target configuration
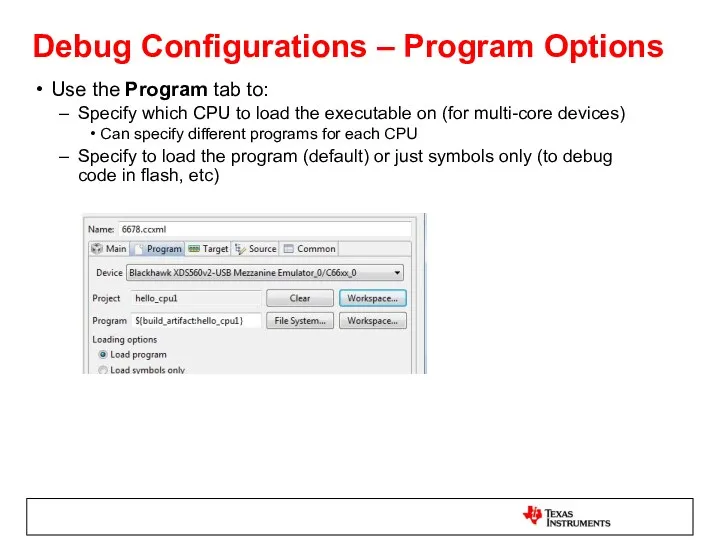
Debug Configurations – Program Options
Use the Program tab to:
Specify which
Debug Configurations – Program Options
Use the Program tab to:
Specify which
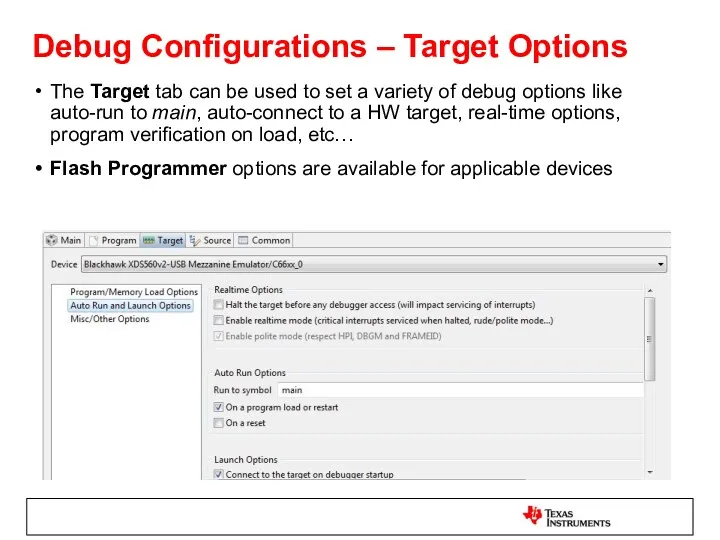
Debug Configurations – Target Options
The Target tab can be used to
Debug Configurations – Target Options
The Target tab can be used to
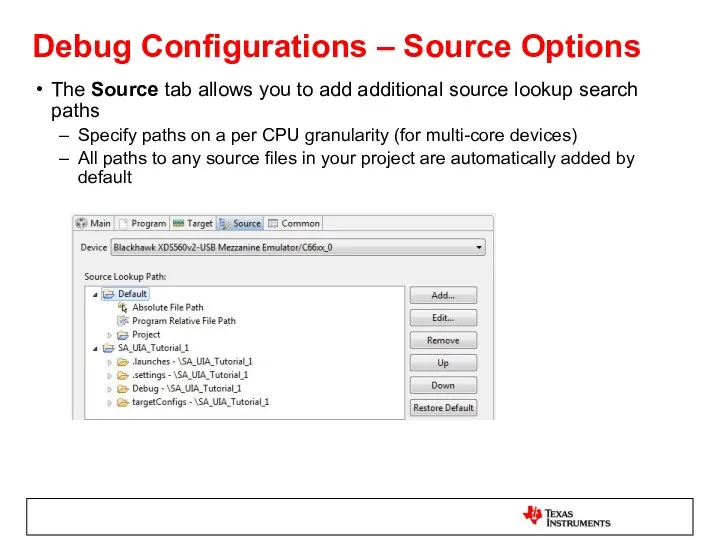
Debug Configurations – Source Options
The Source tab allows you to add
Debug Configurations – Source Options
The Source tab allows you to add
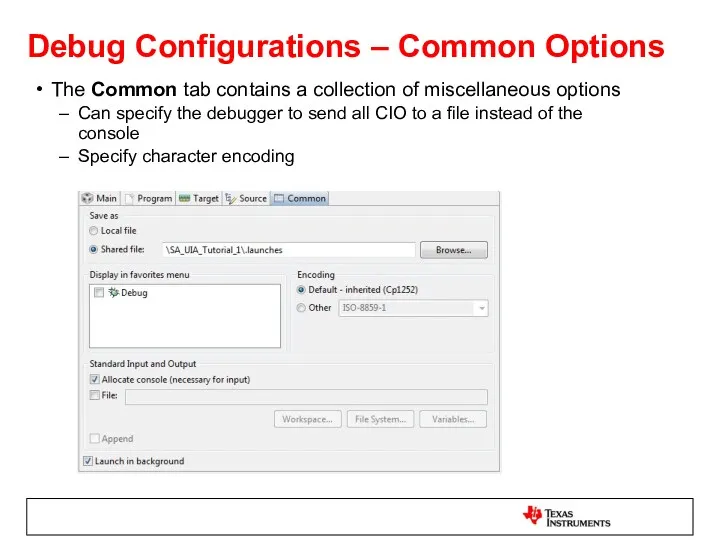
Debug Configurations – Common Options
The Common tab contains a collection of
Debug Configurations – Common Options
The Common tab contains a collection of
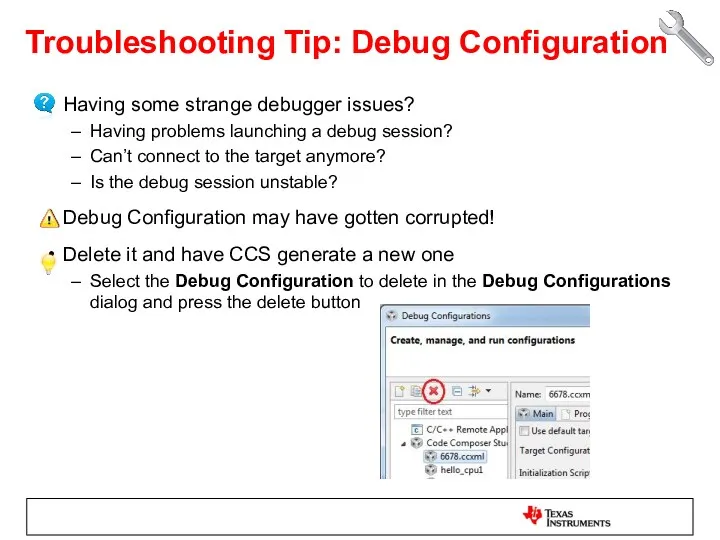
Troubleshooting Tip: Debug Configuration
Having some strange debugger issues?
Having problems launching
Troubleshooting Tip: Debug Configuration
Having some strange debugger issues?
Having problems launching
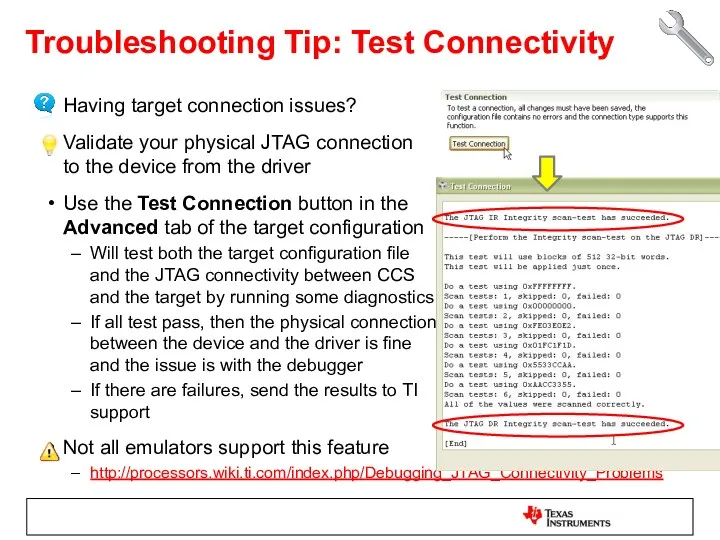
Having target connection issues?
Validate your physical JTAG connection
to the device from
Having target connection issues?
Validate your physical JTAG connection
to the device from
Debugging Without a Project
For project-less debug sessions, CCS will look for
Debugging Without a Project
For project-less debug sessions, CCS will look for
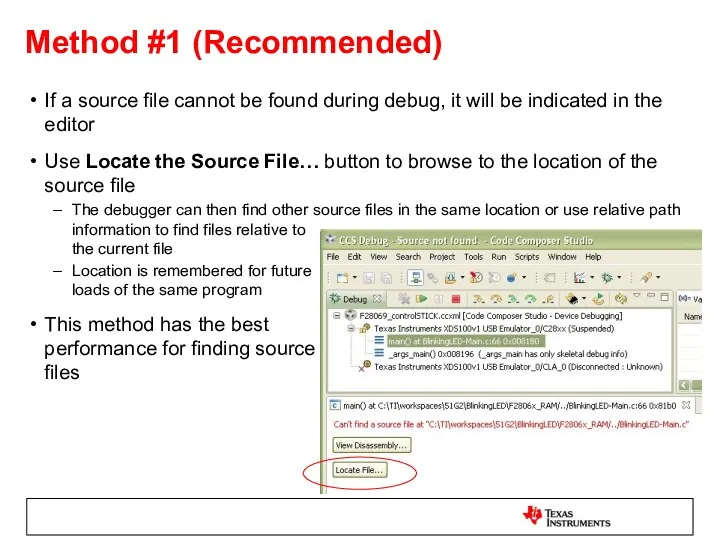
Method #1 (Recommended)
If a source file cannot be found during debug,
Method #1 (Recommended)
If a source file cannot be found during debug,
Method #2 – Debug Context (CCSv6.0.x)
Source lookup paths can also
be
Method #2 – Debug Context (CCSv6.0.x)
Source lookup paths can also be
The Source tab in the debug configuration allows you to add
The Source tab in the debug configuration allows you to add
Method #4 – Global (Workspace)
Source lookup paths can also be set
Method #4 – Global (Workspace)
Source lookup paths can also be set
More Debugging: Source Lookup Paths
Once the path is known to the
More Debugging: Source Lookup Paths
Once the path is known to the
View: Modules
Provides information for all loaded symbol files
View -> Modules
View: Modules
Provides information for all loaded symbol files
View -> Modules
View: Terminal
Terminal emulator that can connect to a remote target via
View: Terminal
Terminal emulator that can connect to a remote target via
 Algebra relacyjna. Wprowadzenie do systemów baz danych
 Создание форм и отчетов в СУБД Access
 Створення тематичних карт
 Задачи на графы
 Внутреннее устройство компьютера
 Информационная безопасность. Методы защиты информации
 Хакерство и его проявление в сфере информационных технологий
 Портал для автоматизированного создания реестров экспресс грузов
 Rapid Application Development. (Быстрая разработка приложений)
 Сайт Министерства культуры РФ
 Создание Web-сайта. Коммуникационные технологии
 Introduction to the course. Managing the application life cycle
 Электронное пособие по русскому языку
 Скрипты предложения продукта ШПД и работа с возражениями
 Текстовый процессор MS WORD
 ლექციათა კურსი ობიექტზე ორიენტირებული დაპროგრამება 1 (C++)
 Оформление КД. Генерация Gerber-файлов. Вывод чертежей на печать
 Профессия прграммист
 Особый правовой режим информации
 Моделирование и модели
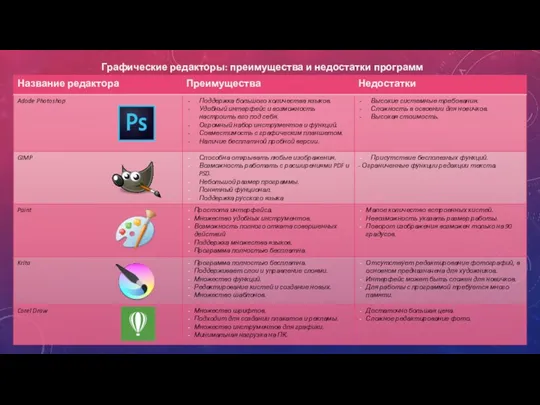 Графические редакторы. Преимущества и недостатки программ
 Рекомендации для создания презентации
 Системы электронного документооборота ( на примере Контур)
 Списки и строки
 Мультимедийные средства как вид информационных технологий. Достоинства и недостатки. Визуализация учебного материала
 Введение в системы управления базами данных (СУБД) и основные возможности реляционной СУБД MySQL
 Мова HTML. Практичні завдання: позиціювання
 АРМ Приёмосдатчика