- Computer Vision Problems

Содержание
- 2. Deep Learning on large images Cat? (0/1) 64x64
- 3. Computer Vision Problem vertical edges horizontal edges
- 4. Vertical edge detection 1 1 1 -1 -1 -1 0 0 0 1 1 1 -1
- 5. Vertical edge detection examples
- 6. Valid and Same convolutions “Valid”: “Same”: Pad so that output size is the same as the
- 7. Summary of convolutions padding p stride s
- 8. Multiple filters 6 x 6 x 3 4 x 4 3 x 3 x 3 3
- 9. Pooling layer: Max pooling
- 10. Pooling layer: Average pooling
- 11. Types of layer in a convolutional network: - Convolution - Pooling - Fully connected
- 12. Outline Classic networks: LeNet-5 ResNet Inception AlexNet VGG
- 13. LeNet - 5 120 84 f = 2 s = 2 avg pool avg pool f
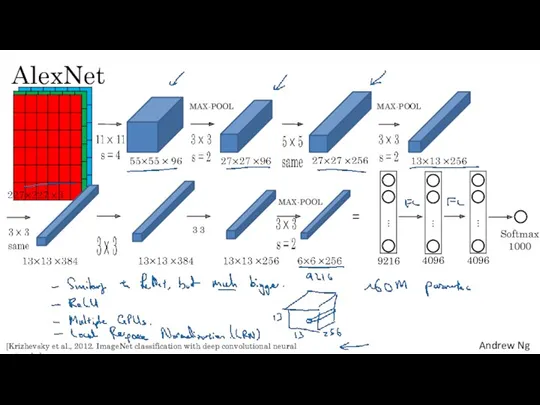
- 14. AlexNet = 9216 4096 4096 MAX-POOL MAX-POOL 3 3 MAX-POOL Softmax 1000 [Krizhevsky et al., 2012.
- 15. VGG - 16 224x224x 3 CONV = 33 filter, s = 1, same POOL [CONV 128]
- 16. Inception network [Szegedy et al., 2014, Going Deeper with Convolutions]
- 17. What are localization and detection? Image classification Classification with localization Detection
- 18. Classification with localization 1 - pedestrian 2 - car 3 - motorcycle 4 - background
- 19. Defining the target label y 1 - pedestrian 2 - car 3 - motorcycle 4 -
- 20. Sliding windows detection
- 21. Evaluating object localization “Correct” if IoU 0.5 More generally, IoU is a measure of the overlap
- 22. Non-max suppression example
- 23. Non-max suppression algorithm Discard all boxes with While there are any remaining boxes: Pick the box
- 24. Non-max suppression example 0.8 0.7 0.6 0.9 0.7
- 26. Скачать презентацию
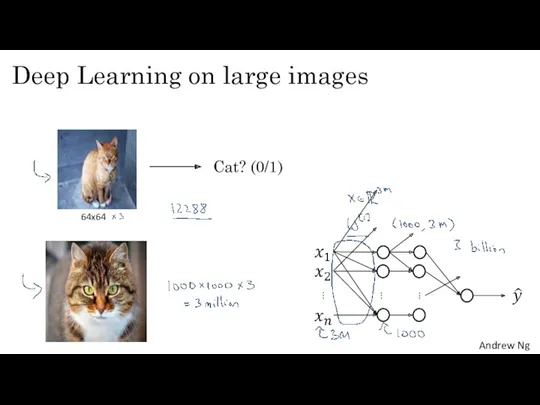
Deep Learning on large images
Cat? (0/1)
64x64
Deep Learning on large images
Cat? (0/1)
64x64
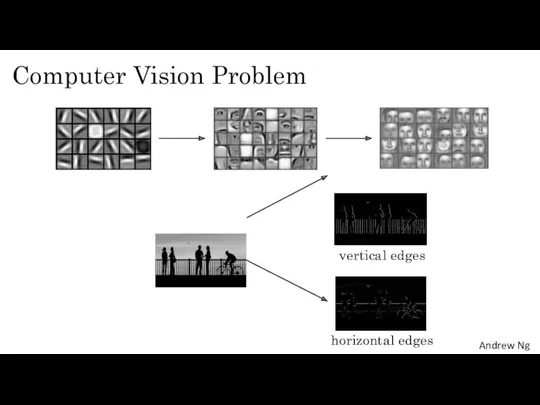
Computer Vision Problem
vertical edges
horizontal edges
Computer Vision Problem
vertical edges
horizontal edges
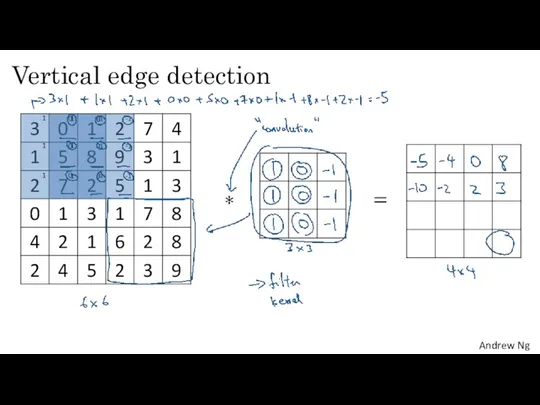
Vertical edge detection
1
1
1
-1
-1
-1
0
0
0
1
1
1
-1
-1
-1
0
0
0
Vertical edge detection
1
1
1
-1
-1
-1
0
0
0
1
1
1
-1
-1
-1
0
0
0
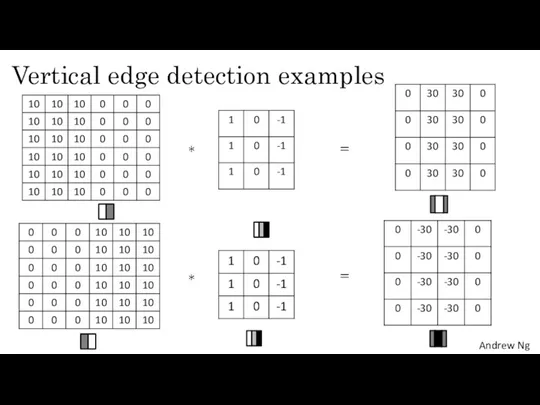
Vertical edge detection examples
Vertical edge detection examples
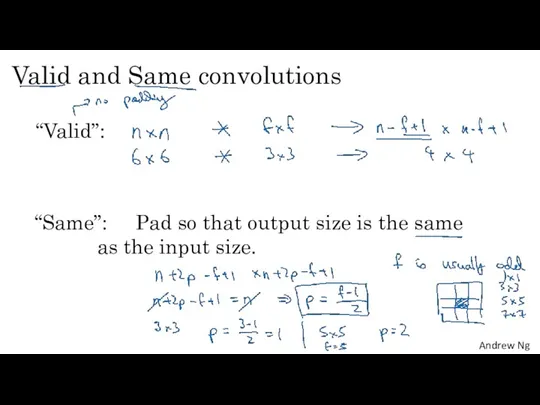
Valid and Same convolutions
“Valid”:
“Same”: Pad so that output size is the
Valid and Same convolutions
“Valid”:
“Same”: Pad so that output size is the
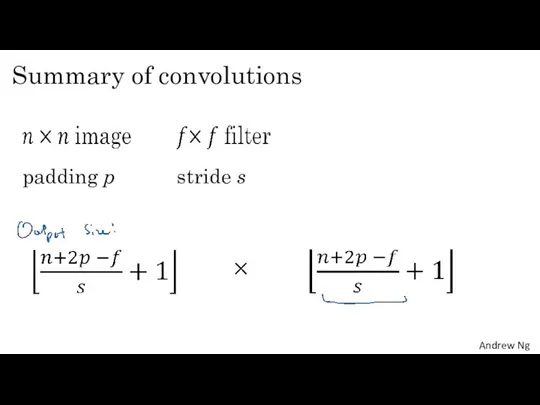
Summary of convolutions
padding p
stride s
Summary of convolutions
padding p
stride s
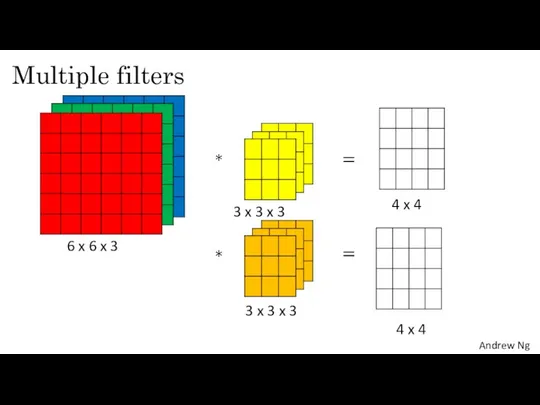
Multiple filters
6 x 6 x 3
4 x 4
3 x 3 x
Multiple filters
6 x 6 x 3
4 x 4
3 x 3 x
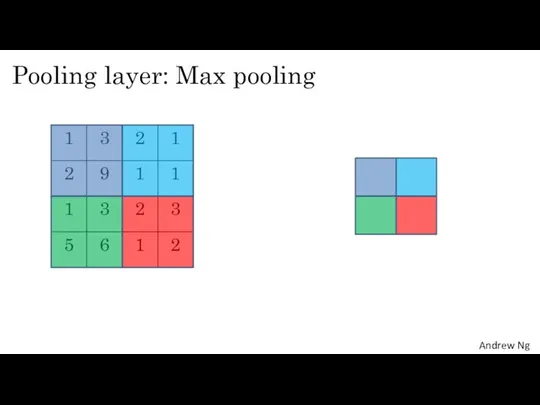
Pooling layer: Max pooling
Pooling layer: Max pooling
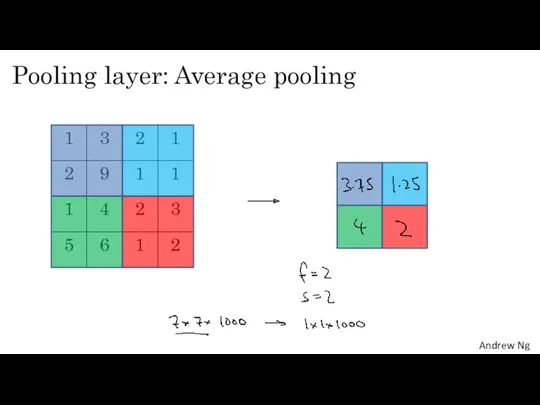
Pooling layer: Average pooling
Pooling layer: Average pooling
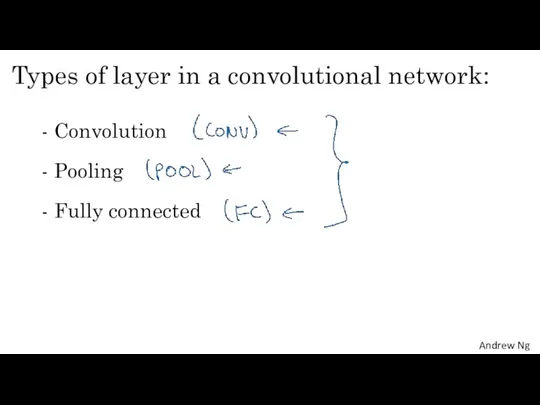
Types of layer in a convolutional network:
- Convolution
- Pooling
- Fully connected
Types of layer in a convolutional network:
- Convolution
- Pooling
- Fully connected
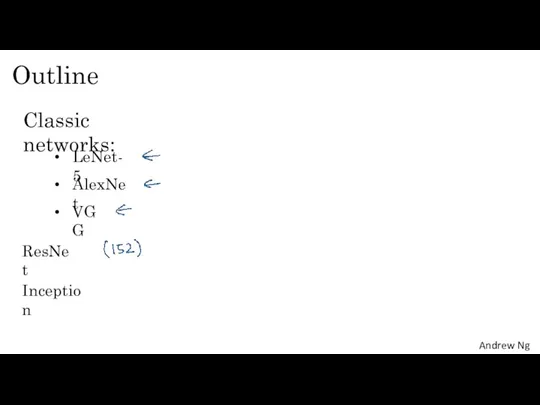
Outline
Classic networks:
LeNet-5
ResNet
Inception
AlexNet
VGG
Outline
Classic networks:
LeNet-5
ResNet
Inception
AlexNet
VGG
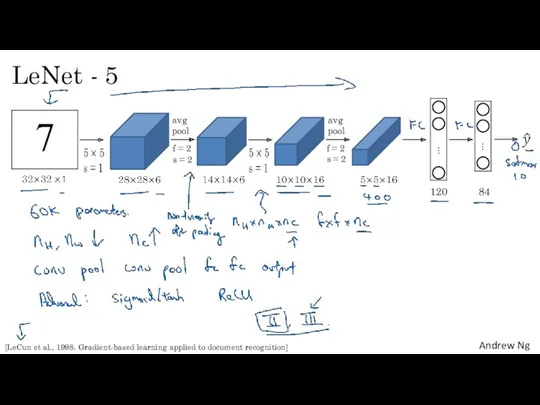
LeNet - 5
120
84
f = 2
s = 2
avg pool
avg pool
f = 2
s
LeNet - 5
120
84
f = 2
s = 2
avg pool
avg pool
f = 2
s
AlexNet
=
9216
4096
4096
MAX-POOL
MAX-POOL
3 3
MAX-POOL
Softmax
1000
[Krizhevsky et al., 2012. ImageNet classification with deep convolutional neural
AlexNet
=
9216
4096
4096
MAX-POOL
MAX-POOL
3 3
MAX-POOL
Softmax
1000
[Krizhevsky et al., 2012. ImageNet classification with deep convolutional neural
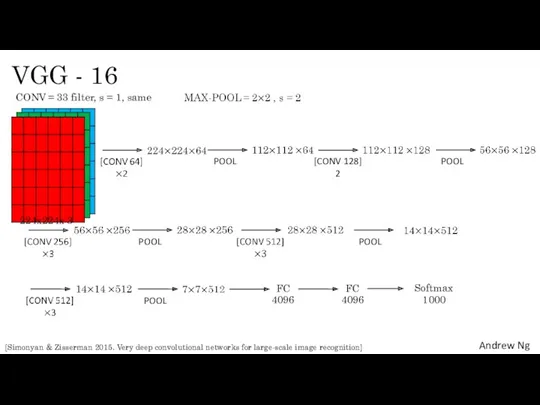
VGG - 16
224x224x 3
CONV = 33 filter, s = 1, same
VGG - 16
224x224x 3
CONV = 33 filter, s = 1, same
![Inception network [Szegedy et al., 2014, Going Deeper with Convolutions]](/_ipx/f_webp&q_80&fit_contain&s_1440x1080/imagesDir/jpg/213190/slide-15.jpg)
Inception network
[Szegedy et al., 2014, Going Deeper with Convolutions]
Inception network
[Szegedy et al., 2014, Going Deeper with Convolutions]
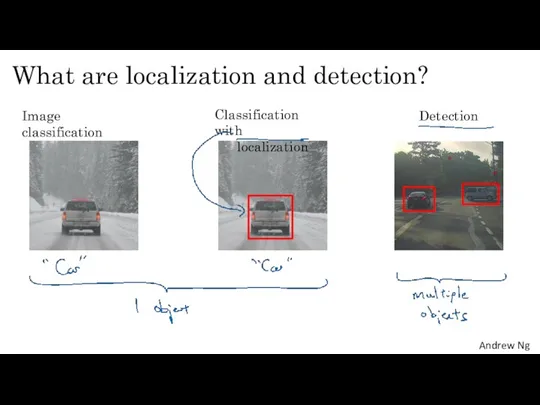
What are localization and detection?
Image classification
Classification with
localization
Detection
What are localization and detection?
Image classification
Classification with
localization
Detection
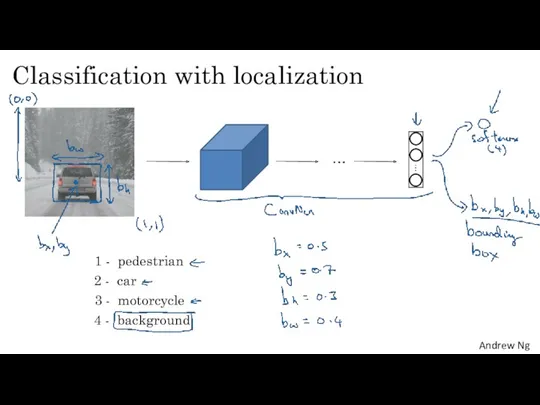
Classification with localization
1 - pedestrian
2 - car
3 - motorcycle
4 - background
Classification with localization
1 - pedestrian
2 - car
3 - motorcycle
4 - background
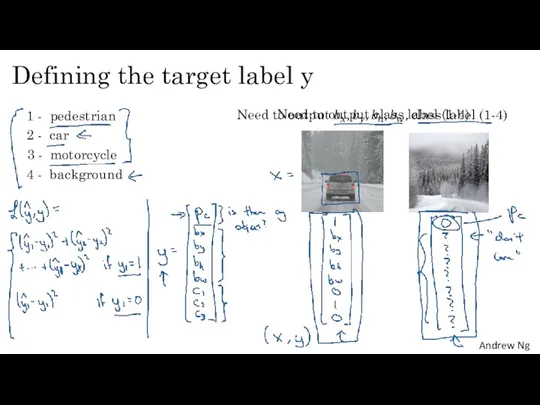
Defining the target label y
1 - pedestrian
2 - car
3 - motorcycle
4
Defining the target label y
1 - pedestrian
2 - car
3 - motorcycle
4
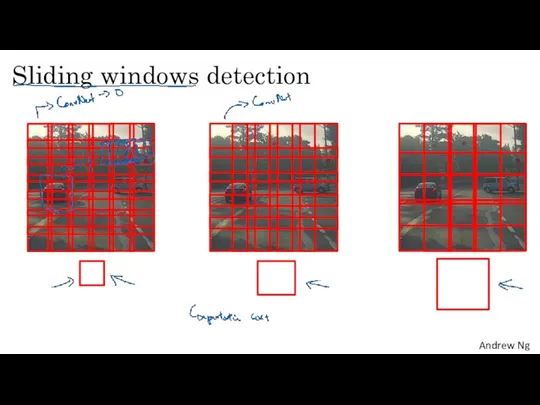
Sliding windows detection
Sliding windows detection
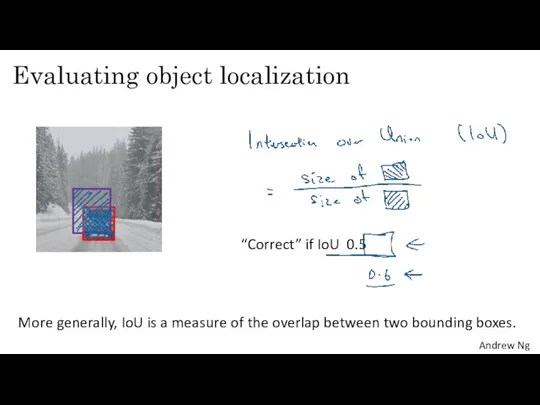
Evaluating object localization
“Correct” if IoU 0.5
More generally, IoU is a measure
Evaluating object localization
“Correct” if IoU 0.5
More generally, IoU is a measure
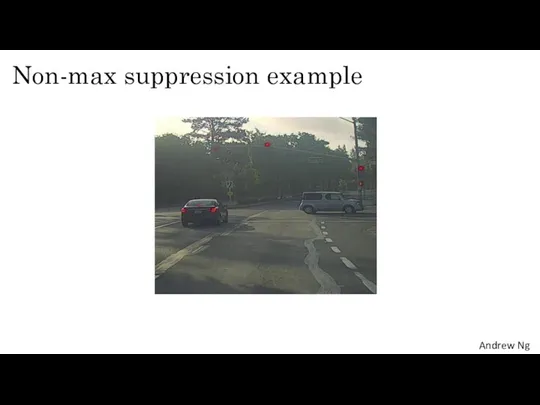
Non-max suppression example
Non-max suppression example
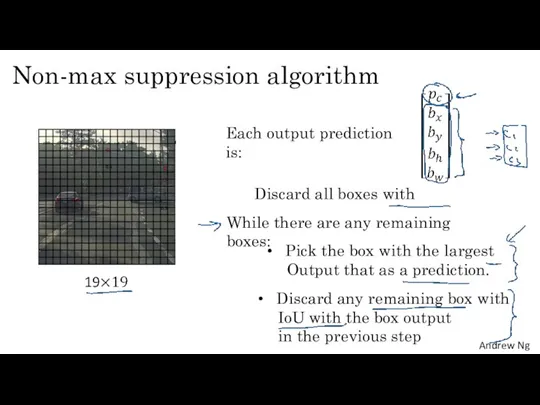
Non-max suppression algorithm
Discard all boxes with
While there are any remaining
Non-max suppression algorithm
Discard all boxes with
While there are any remaining
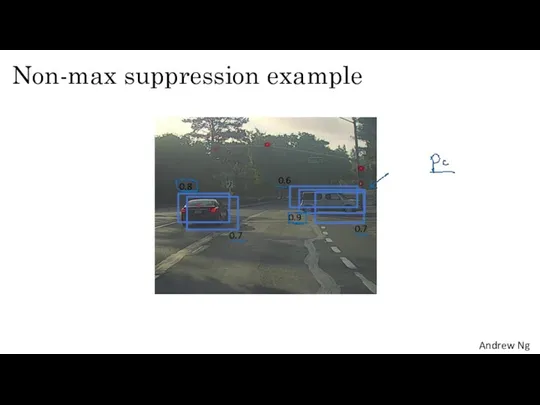
Non-max suppression example
0.8
0.7
0.6
0.9
0.7
Non-max suppression example
0.8
0.7
0.6
0.9
0.7
 Искусственный интеллект (ИИ)
 Знакомство с Paint.NET
 Принципы организации вычислительных сетей
 Введение в UML
 Информация. Классификация информации
 Алгоритм и его формальное исполнение
 Устройство пк
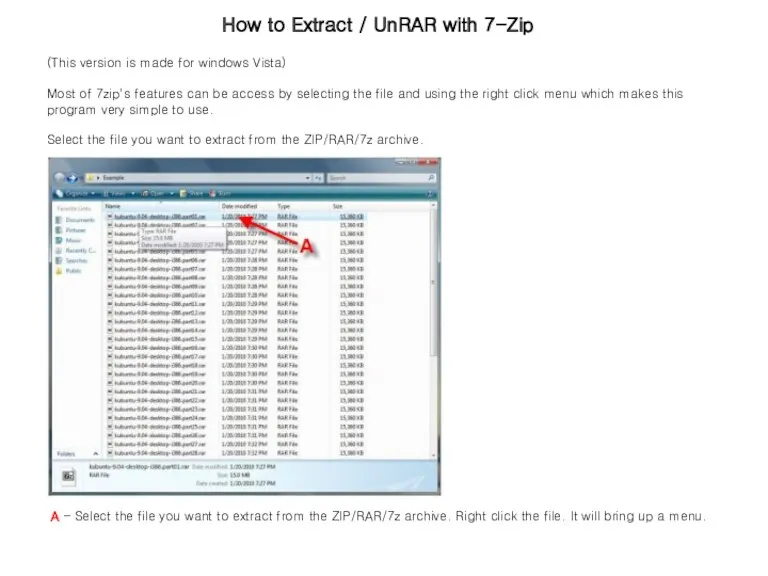 How to extract file with 7-Zip
 Эффективное сопровождение образовательного процесса, используя АИС СГО
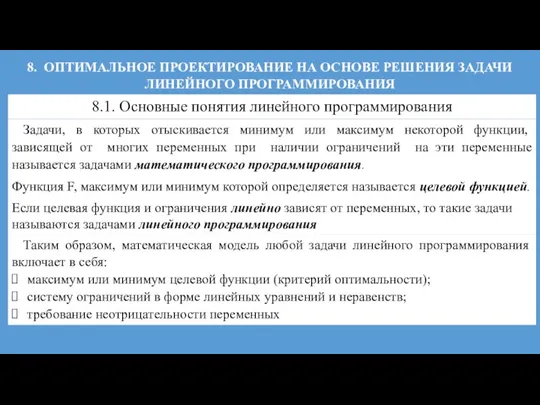 Оптимальное проектирование на основе решения задачи линейного программирования
 Ролевая игра Mass Effect
 Преобразование ER- модели в реляционную
 Что такое 3D-моделирование и где оно применяется
 Напрямки та інструменти веб-дизайну
 Графика в C++
 Принципы переноса ранее разработанных приложенийна смартфон. Лекция 4
 Голосовые мессенджеры
 Язык РНР Управляющие конструкции
 Кодирование звуковой информации
 Разработка сайта с применением Framework Bootstrap
 Развитие автомобильных телеканалов в 2019 г
 Компьютерные программные продукты для разработки бизнес-планов (Project Expert, COMFAR, Альт-Инвест, PROPSPIN)
 Analysis and Design of Data Systems. General Definitions of 2NF & 3NF Boyce-Codd Normal Form (Lecture 16)
 Автоматизированная компьютерная система Умный дом
 Кроссворд про школу (с клавиатурой)
 Optimizarea activităţii de prestare a serviciilor de transport prin aplicarea modelelor matematice şi sistemelor informatice
 Моделирование как метод познания. Моделирование и формализация. Информатика. 9 класс
 Введение в программную инженерию. Лекция №1