- Dashboard Spec Aspen Sales Force

Содержание
- 2. Log in details for new server REMOTE DESKTOP LOGIN IP: 41.76.209.124 Username: OWLAFRICA2\Administrator Password: nBvU392@ MSSQL
- 3. [Dim_Aspen Employee List Sales] is the table that is used to loop through and mailed to
- 4. PHCY - CLICKS Indep - East Rand : Basket : Independent 1 Date: 14 Oct 2016
- 5. Dashboard page one data information Display the date that the report is generated Dataset 1 -
- 6. Dashboard page one data information 12. Dataset 1 - SELECT count(distinct([Manufacturer_Product_Code])) FROM [AspenHQ].[dbo].[Rep_SSD_Daily_Sales_Sum] where Tran_YearMonths =
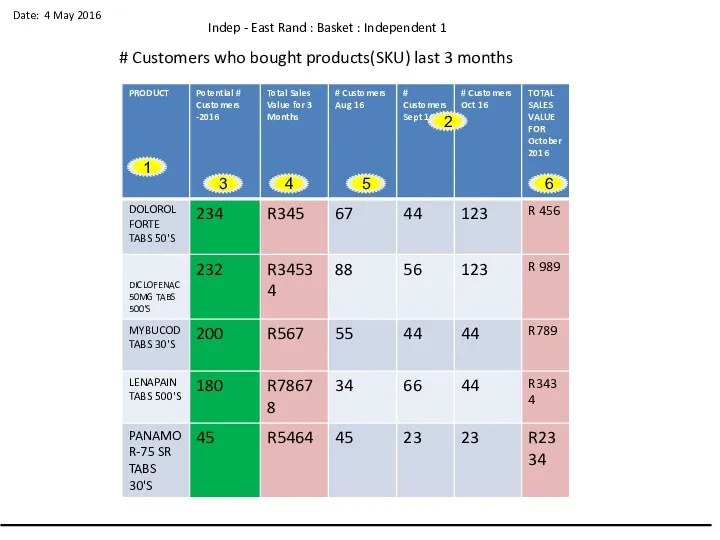
- 7. Date: 4 May 2016 Indep - East Rand : Basket : Independent 1 # Customers group
- 8. Dashboard page one data information Dataset 2 – Display list of [ASPEN CLASSIFICATION] groups that are
- 9. Date: 4 May 2016 Indep - East Rand : Basket : Independent 1 # Customers who
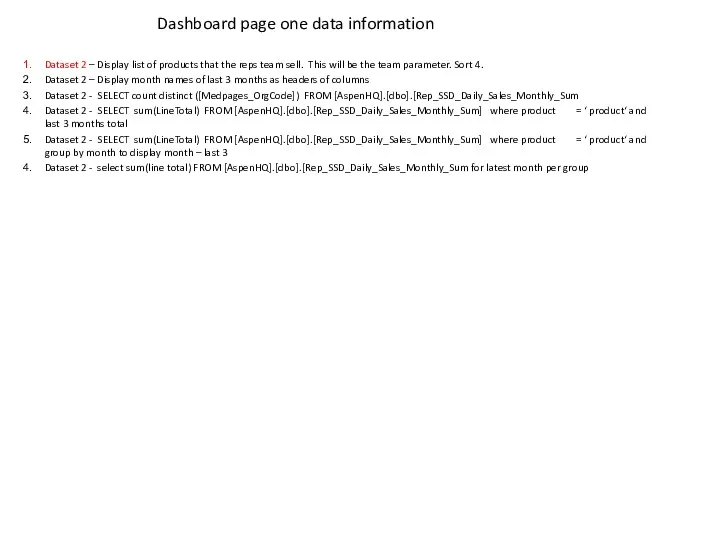
- 10. Dashboard page one data information Dataset 2 – Display list of products that the reps team
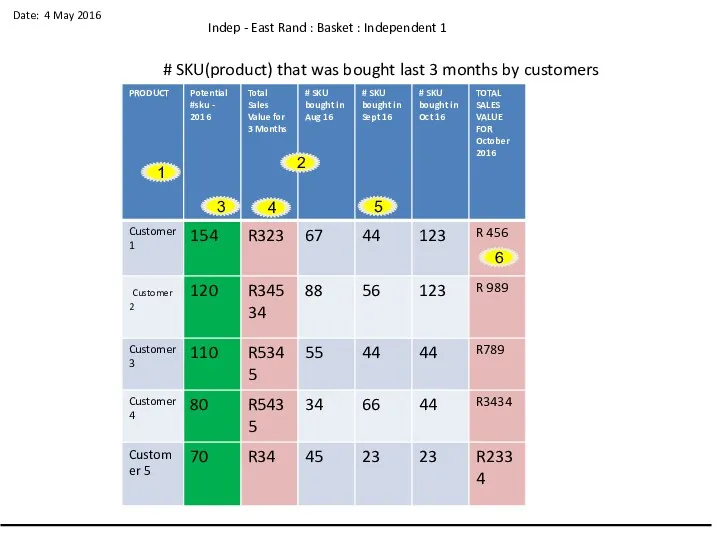
- 11. Date: 4 May 2016 Indep - East Rand : Basket : Independent 1 # SKU(product) that
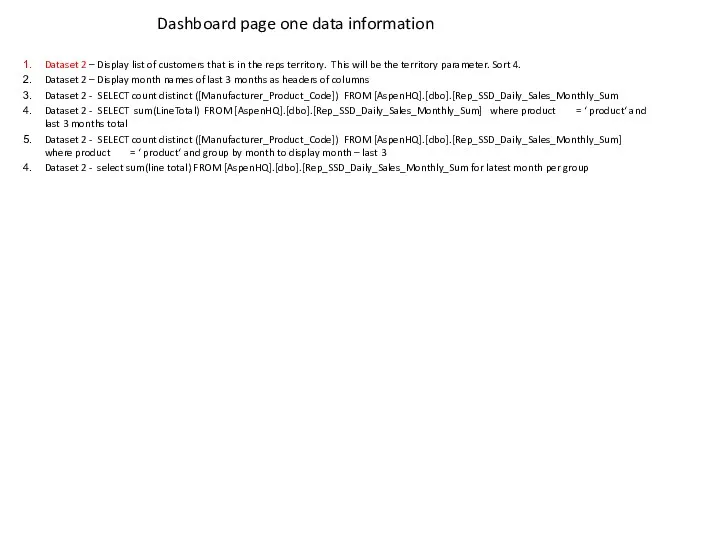
- 12. Dashboard page one data information Dataset 2 – Display list of customers that is in the
- 14. Скачать презентацию
Log in details for new server
REMOTE DESKTOP LOGIN
IP: 41.76.209.124
Username: OWLAFRICA2\Administrator
Password: nBvU392@
MSSQL SERVER LOGIN
Log in details for new server
REMOTE DESKTOP LOGIN
IP: 41.76.209.124
Username: OWLAFRICA2\Administrator
Password: nBvU392@
MSSQL SERVER LOGIN
[Dim_Aspen Employee List Sales] is the table that is used to loop through
[Dim_Aspen Employee List Sales] is the table that is used to loop through
![[Dim_Aspen Employee List Sales] is the table that is used to loop through](/_ipx/f_webp&q_80&fit_contain&s_1440x1080/imagesDir/jpg/145623/slide-2.jpg)
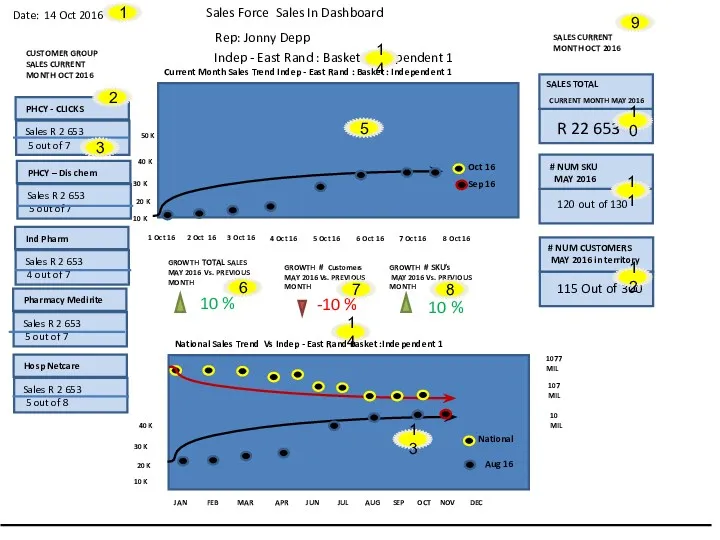
PHCY - CLICKS
Indep - East Rand : Basket : Independent 1
Date: 14 Oct
PHCY - CLICKS
Indep - East Rand : Basket : Independent 1
Date: 14 Oct
Dashboard page one data information
Display the date that the report is generated
Dataset 1
Dashboard page one data information
Display the date that the report is generated
Dataset 1
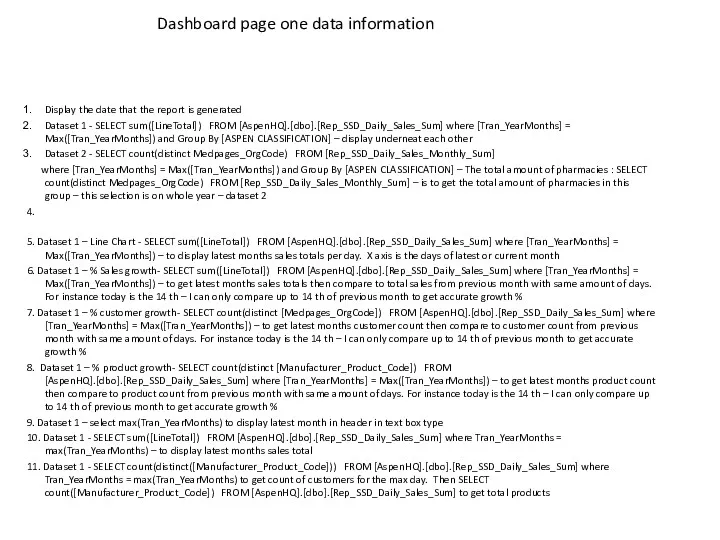
Dashboard page one data information
12. Dataset 1 - SELECT count(distinct([Manufacturer_Product_Code])) FROM [AspenHQ].[dbo].[Rep_SSD_Daily_Sales_Sum] where
Dashboard page one data information
12. Dataset 1 - SELECT count(distinct([Manufacturer_Product_Code])) FROM [AspenHQ].[dbo].[Rep_SSD_Daily_Sales_Sum] where
![Dashboard page one data information 12. Dataset 1 - SELECT count(distinct([Manufacturer_Product_Code])) FROM [AspenHQ].[dbo].[Rep_SSD_Daily_Sales_Sum]](/_ipx/f_webp&q_80&fit_contain&s_1440x1080/imagesDir/jpg/145623/slide-5.jpg)
Date: 4 May 2016
Indep - East Rand : Basket : Independent 1
# Customers
Date: 4 May 2016
Indep - East Rand : Basket : Independent 1
# Customers
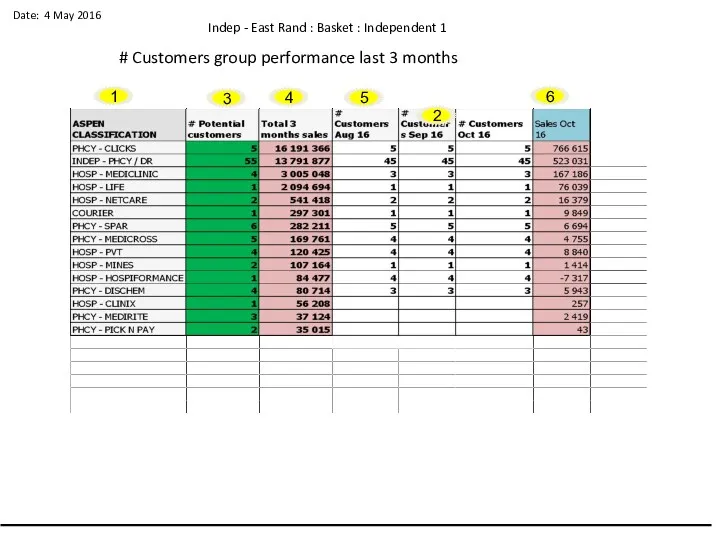
Dashboard page one data information
Dataset 2 – Display list of [ASPEN CLASSIFICATION] groups
Dashboard page one data information
Dataset 2 – Display list of [ASPEN CLASSIFICATION] groups
![Dashboard page one data information Dataset 2 – Display list of [ASPEN CLASSIFICATION]](/_ipx/f_webp&q_80&fit_contain&s_1440x1080/imagesDir/jpg/145623/slide-7.jpg)
Date: 4 May 2016
Indep - East Rand : Basket : Independent 1
# Customers
Date: 4 May 2016
Indep - East Rand : Basket : Independent 1
# Customers
Dashboard page one data information
Dataset 2 – Display list of products that the
Dashboard page one data information
Dataset 2 – Display list of products that the
Date: 4 May 2016
Indep - East Rand : Basket : Independent 1
# SKU(product)
Date: 4 May 2016
Indep - East Rand : Basket : Independent 1
# SKU(product)
Dashboard page one data information
Dataset 2 – Display list of customers that is
Dashboard page one data information
Dataset 2 – Display list of customers that is
 Функционирование ЭВМ с канальной организацией
 Ключевые слова и хэштеги. Урок 6
 АТЖ-нің құрылу принципі
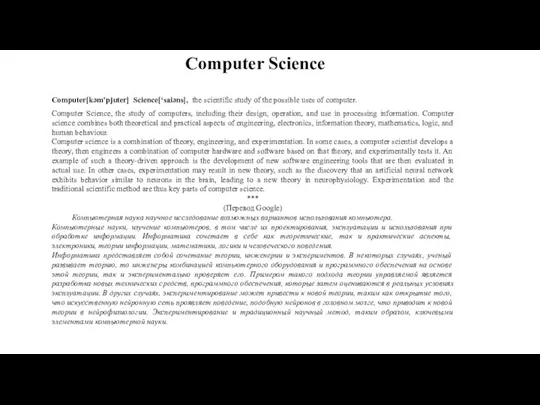 Computer Science
 Внедрение SQL-кода
 Управление исполнителем чертёжник
 Информация и информационные процессы
 Схема архитектуры программы Дерево объектов
 Использование сервиса КМИС для записи к узким специалистам
 Применение ИКТ в рамках предмета Информатика.
 Базы данных
 Программирование (Python). Введение
 Урок 20
 Основы языка Си
 Продвижение продуктов и брендов вместе с сomfy.ua
 Презентация Локальные сети + самостоятельная работа
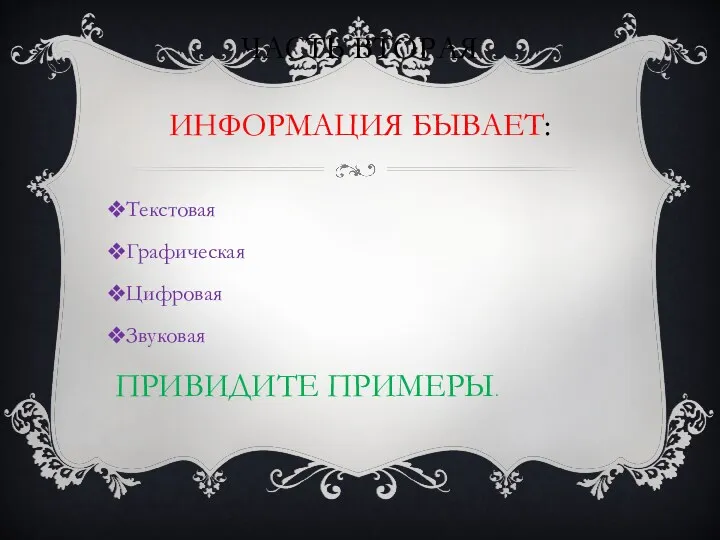 Понятие информация. Виды информации. Основные информационные
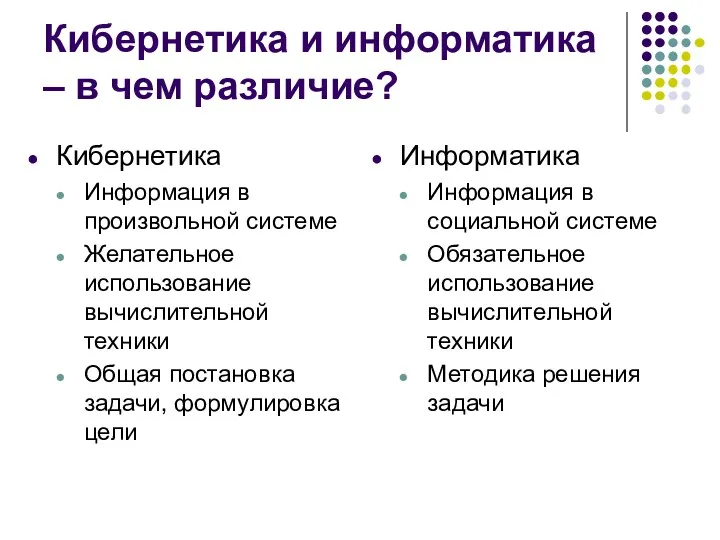 Кибернетика и информатика – в чем различие?
 Многофункциональный Telegram-бот
 Учимся создавать электронное портфолио
 Способы передачи аргументов в функции в языке Си
 Арифметические основы компьютерной схемотехники
 Алгоритмическая конструкция ветвление
 Понятие таргетинг
 Електронні таблиці та їх об’єкти
 Тестировщик ПО. Блок 5. Нефункциональное тестирование
 Информатика. Введение и общие положения
 Алгоритм с ветвящейся структурой