- Editing Slides With Polaris Office

Содержание
- 2. You can insert an object. You can adjust the properties of an object. ‘Insert’ ‘Properties’ You
- 3. Adding Slides To add a slide, click the add icon on the bottom side of the
- 4. Slide Show To execute a slide show, click the ‘Menu’ icon in the Title bar and
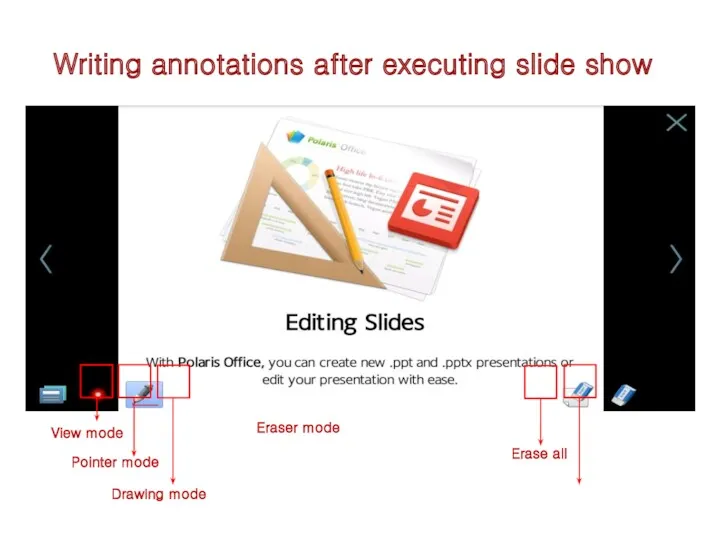
- 5. View mode Pointer mode Drawing mode Eraser mode Erase all Writing annotations after executing slide show
- 6. After executing slide show, you can write annotations you want by choosing between 'pointer mode' and
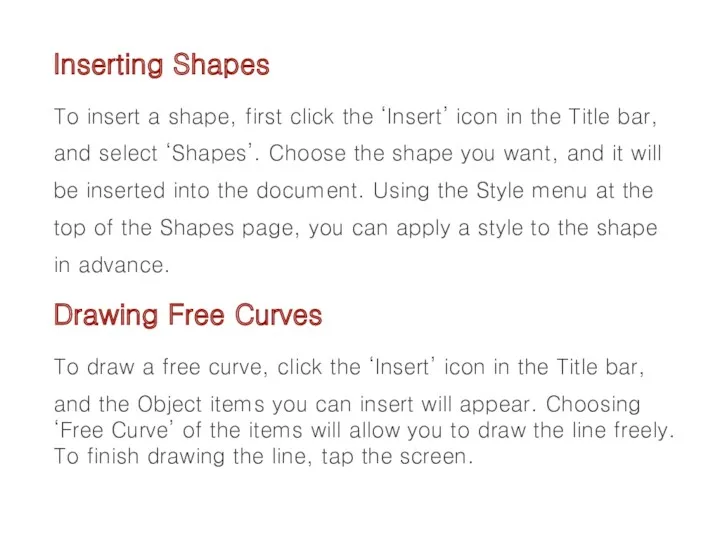
- 7. Inserting Shapes To insert a shape, first click the ‘Insert’ icon in the Title bar, and
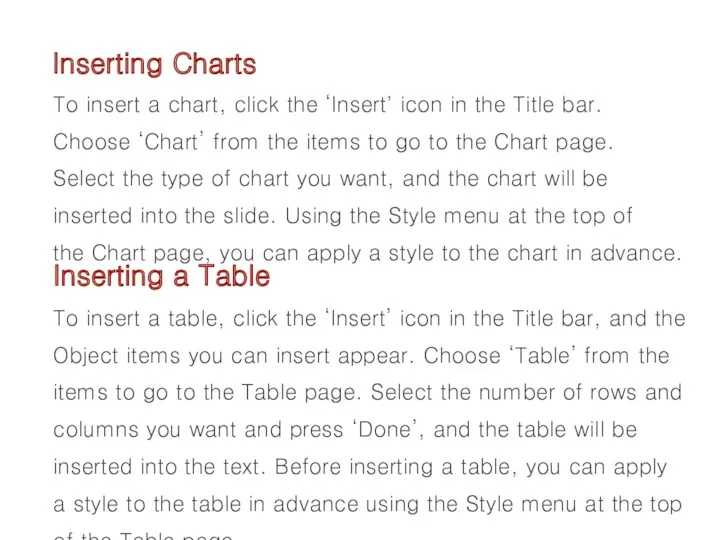
- 8. Inserting Charts To insert a chart, click the ‘Insert’ icon in the Title bar. Choose ‘Chart’
- 10. Скачать презентацию
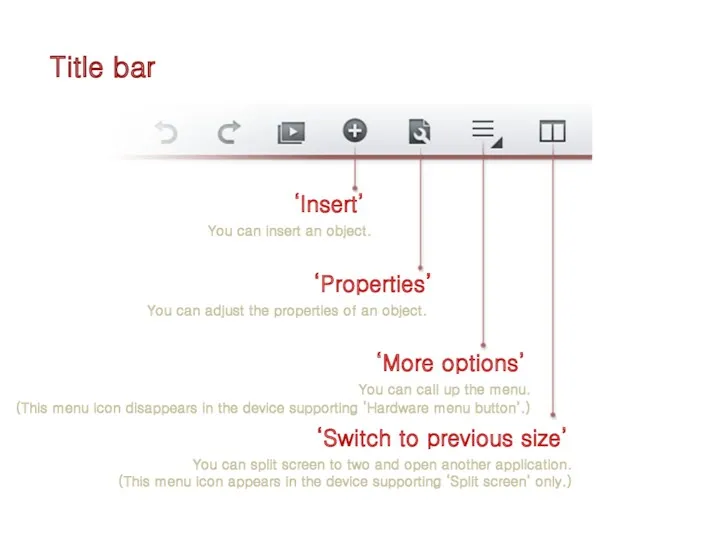
You can insert an object.
You can adjust the properties of
You can insert an object.
You can adjust the properties of
Adding Slides
To add a slide, click the add icon on the
Adding Slides
To add a slide, click the add icon on the
Slide Show
To execute a slide show, click the ‘Menu’ icon in
Slide Show
To execute a slide show, click the ‘Menu’ icon in
View mode
Pointer mode
Drawing mode
Eraser mode
Erase all
Writing annotations after executing slide show
View mode
Pointer mode
Drawing mode
Eraser mode
Erase all
Writing annotations after executing slide show
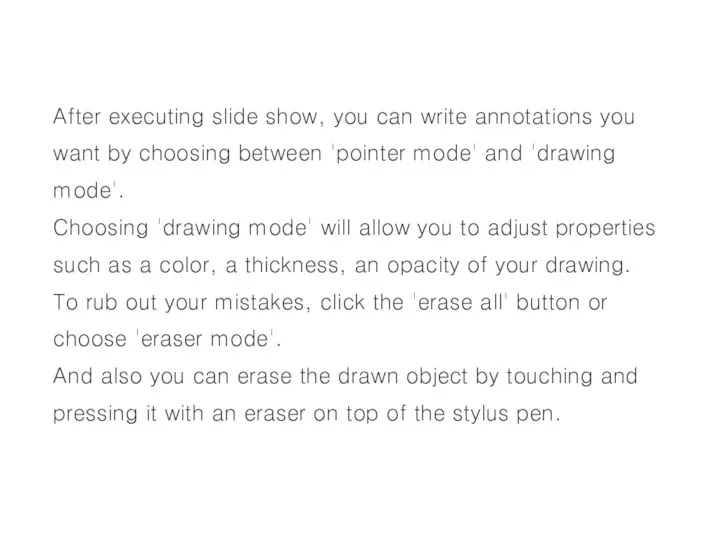
After executing slide show, you can write annotations you want by
After executing slide show, you can write annotations you want by
Inserting Shapes
To insert a shape, first click the ‘Insert’ icon in
Inserting Shapes
To insert a shape, first click the ‘Insert’ icon in
Inserting Charts
To insert a chart, click the ‘Insert’ icon in the
Inserting Charts
To insert a chart, click the ‘Insert’ icon in the
 Работа в книге макетов, перекрытия (ведомость напольных покрытий). План демонтажа и монтажа
 Настройка сетевой операционной системы
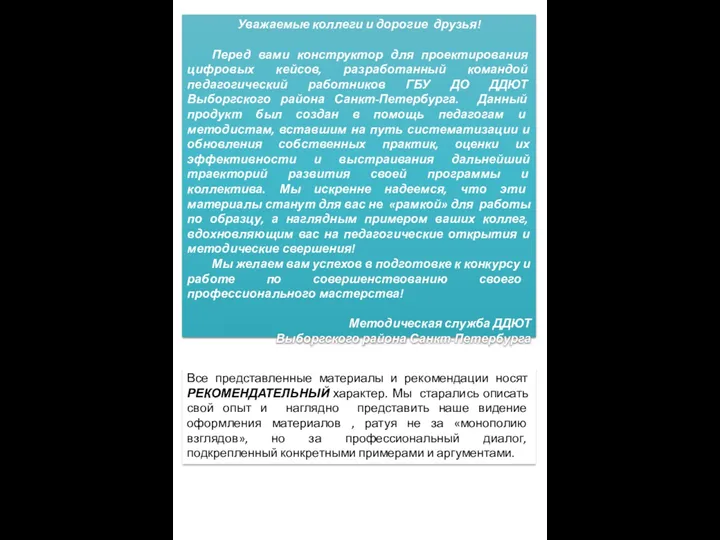 Шаблон кейса
 Текстовый редактор Microsoft office Word
 Разбор задач Всероссийской олимпиады по информатике
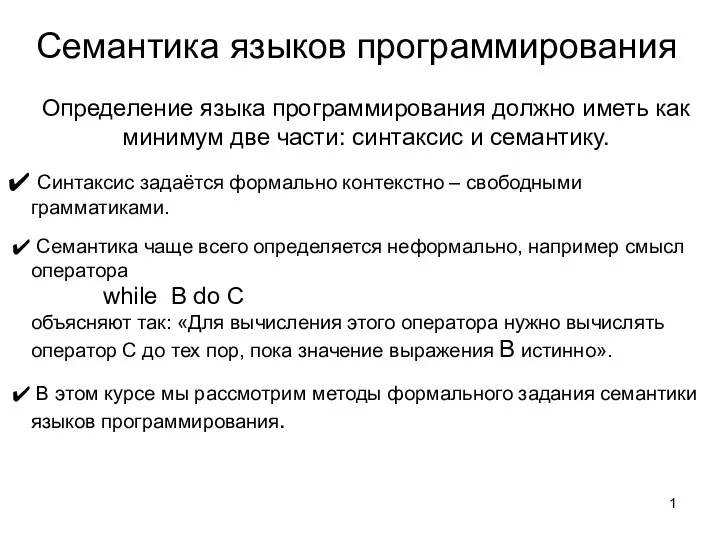 Семантика языков программирования
 Операционные системы
 Объектно-ориентированное программирование (ООП)
 Презентация Весна.
 Язык запросов SQL. Общий синтаксис команды SELECT
 Аппаратное обеспечение компьютера и сетевого оборудования для организации работы офисного здания
 Компьютерная графика. Графический редактор Paint. 5 класс
 Нейронные сети. Введение
 использование игр на уроке информатики в начальной школе
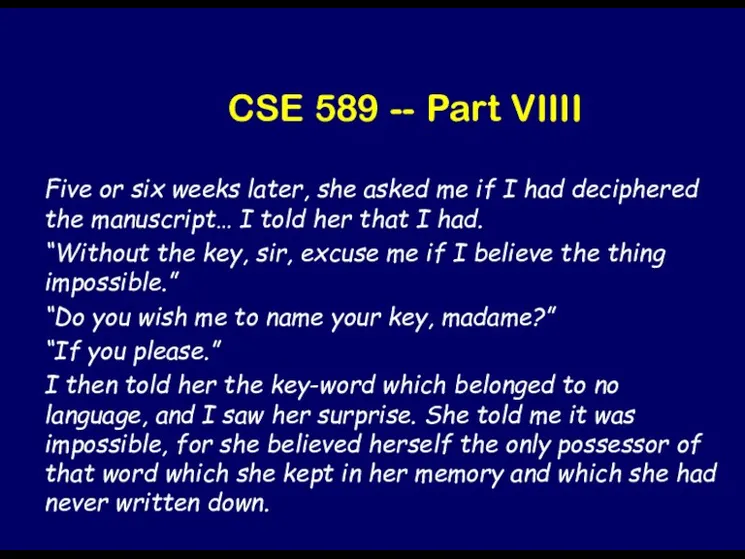 Cryptography Theory and Practice. Applied Cryptography
 Основы верстки
 Основные характеристики ЭВМ
 System software
 Введение в тестирование ПО
 Интернет мошенничество
 Introduction to C++
 Работа в Microsoft Excel
 Программирование. Рекурсия
 Стандарт HTML5. Урок 9
 Организация обучения информатике
 Web-страницы. Язык HTML и др
 Инструкция PackageAssistant. Помощник в настройке смартфонов
 Створення таблиць у базі даних Access