- ICT. Description of the process and its visualization

Содержание
- 2. Vocabulary Visualization Plots Charts and matrices Cards
- 3. Visualization is the first step to understand data. Analytical data uses a wide range of methods:
- 4. Definition of the visualization: 1. to make visual or visible; 2. to form a mental image;
- 5. Why is data visualization important? Because of the way the human brain processes information, using charts
- 6. Data Visualization Methods Graphs The easiest way to show the development of one or more data
- 7. Plots Graphs allow you to distribute two or more data sets in two-dimensional or even three-dimensional
- 8. Cards Cards are widely used in various industries. They allow you to place elements on the
- 9. Charts and matrices Charts are commonly used to demonstrate complex relationships and data relationships and include
- 10. Intelligence card This is a way to visualize the process of thinking by creating non-linear schemes.
- 11. DRAW.IO TASK. DRAW YOUR SYSTEM
- 13. Скачать презентацию
Vocabulary
Visualization
Plots
Charts and matrices
Cards
Vocabulary
Visualization
Plots
Charts and matrices
Cards
Visualization is the first step to understand data. Analytical data uses
Visualization is the first step to understand data. Analytical data uses
Definition of the visualization:
1. to make visual or visible;
2. to form a
Definition of the visualization: 1. to make visual or visible; 2. to form a
Why is data visualization important?
Because of the way the human brain
Why is data visualization important? Because of the way the human brain
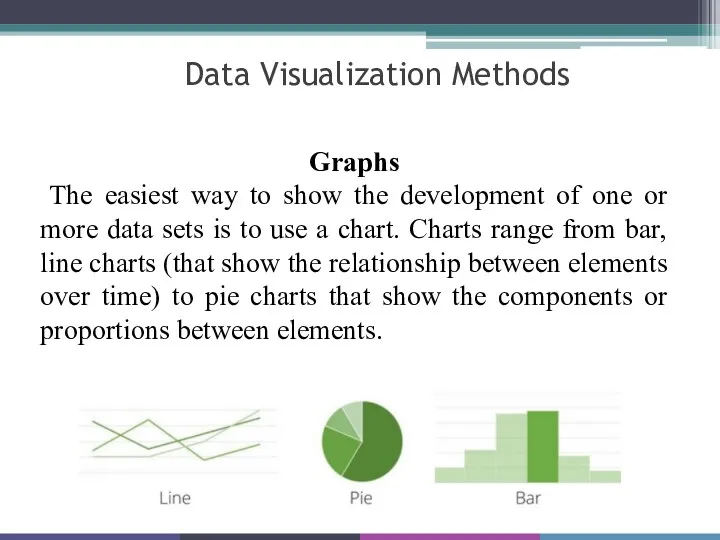
Data Visualization Methods
Graphs
The easiest way to show the development of
Data Visualization Methods
Graphs
The easiest way to show the development of
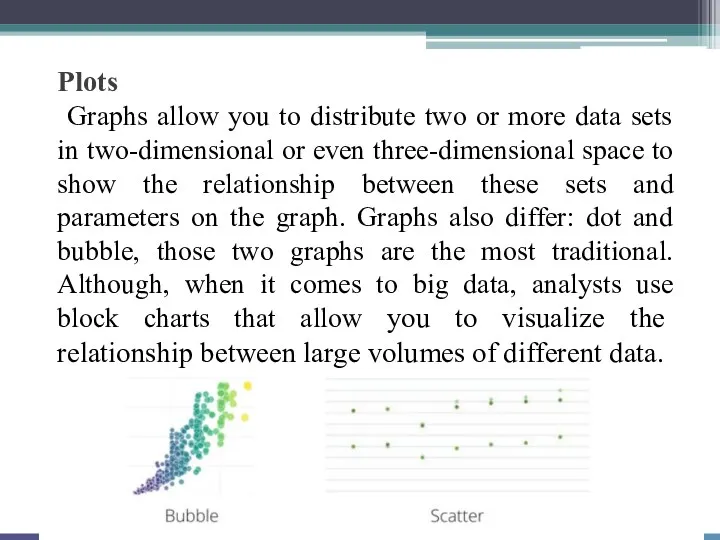
Plots
Graphs allow you to distribute two or more data sets
Plots Graphs allow you to distribute two or more data sets
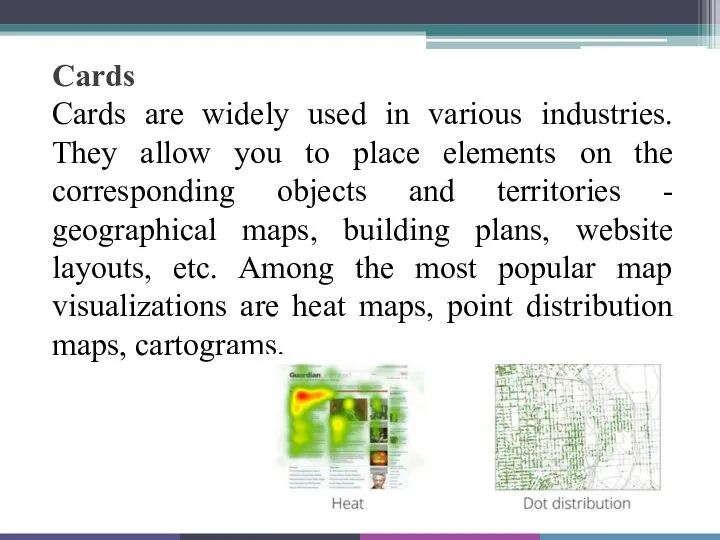
Cards
Cards are widely used in various industries. They allow you
Cards Cards are widely used in various industries. They allow you
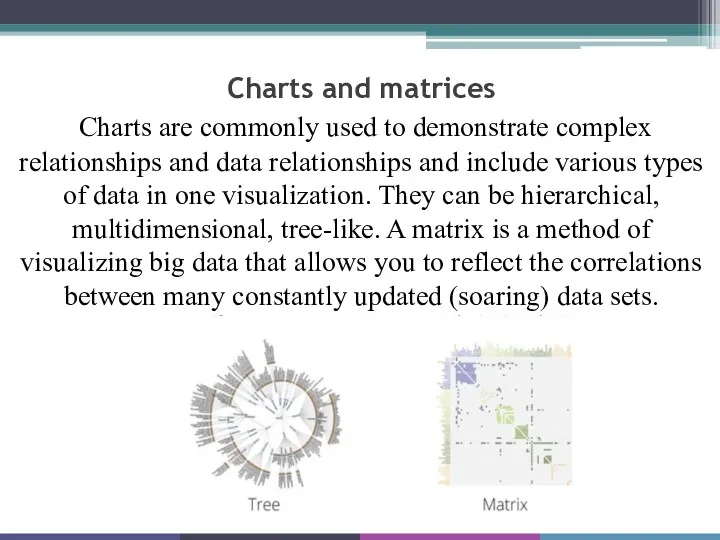
Charts and matrices
Charts are commonly used to demonstrate complex relationships
Charts and matrices Charts are commonly used to demonstrate complex relationships
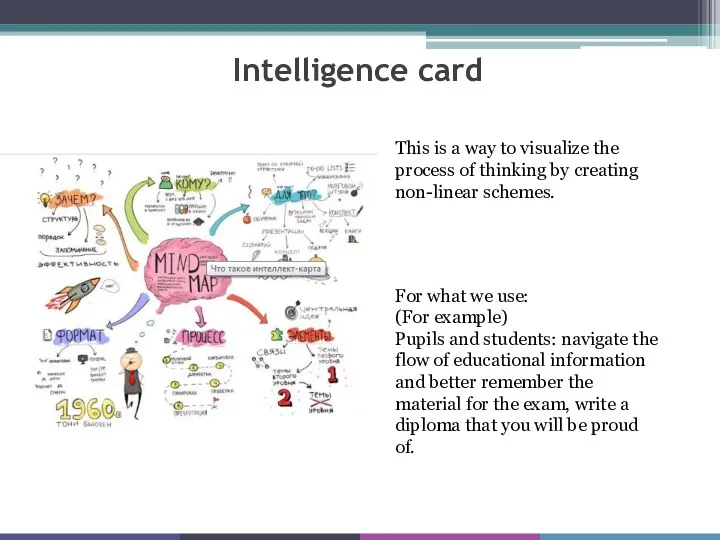
Intelligence card
This is a way to visualize the process of thinking
Intelligence card
This is a way to visualize the process of thinking
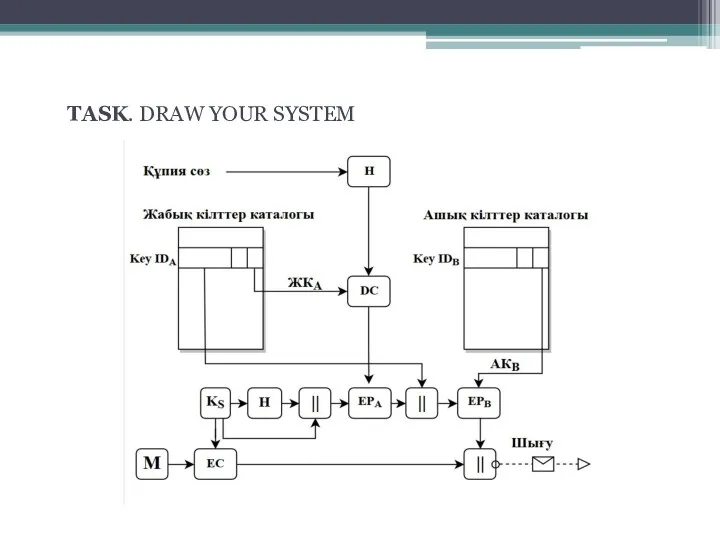
DRAW.IO
TASK. DRAW YOUR SYSTEM
DRAW.IO
TASK. DRAW YOUR SYSTEM
 Разработка базы данных Адвокатская контора
 Топология сети
 Расчетные методики ПП ЭкоСфера-предприятие. Расчет выбросов от автотранспорта (Аккумуляторная)
 Базы данных
 Слуга народу. Логобук
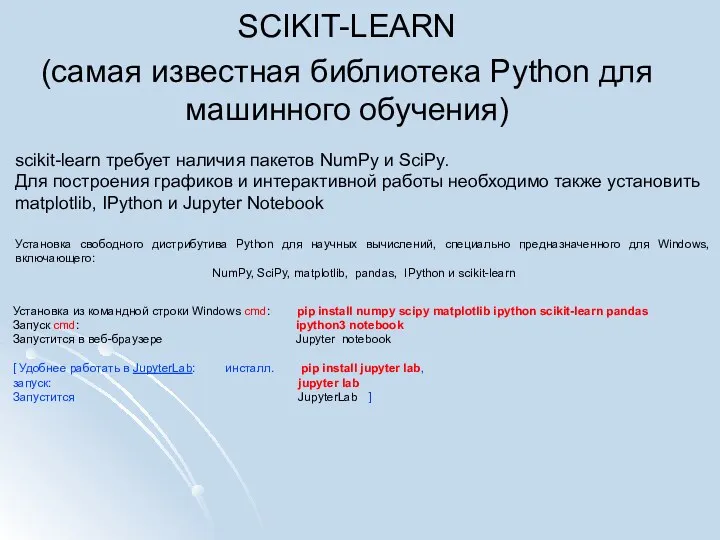 Scikit-Learn (самая известная библиотека Python для машинного обучения)
 3. Объекты и типы
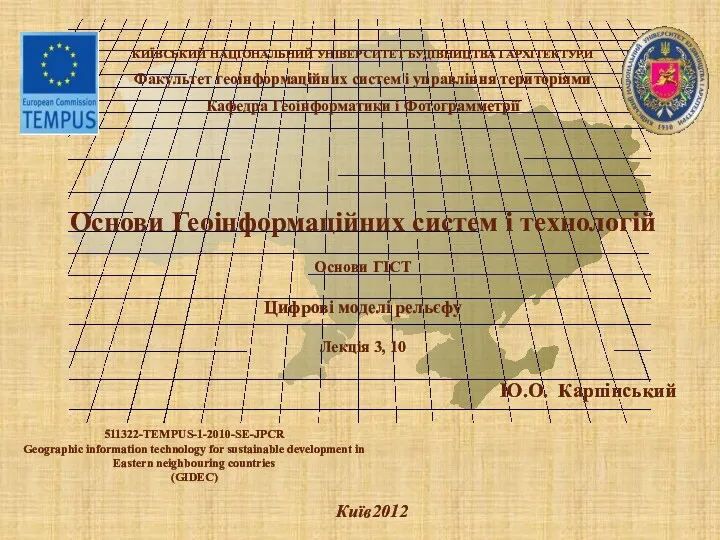 Цифрові моделі рельєфу
 Основы построения инфокоммуникационных систем и сетей. Лекция 3
 Основы безопасной учебы в НИУ ВШЭ
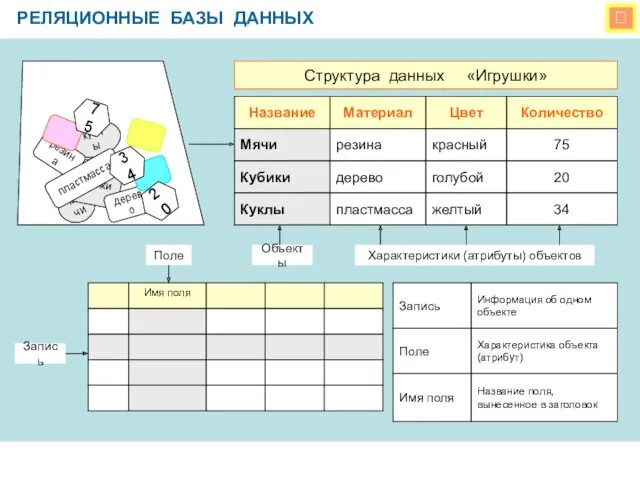 Реляционные базы данных
 Правила набора текста
 Influence of video name blurring onto its YouTube search result ranking - SeeZisLab
 Основы языка СИ. Литература
 Практика наставничества при организации проектной деятельности в рамках курсового проектирования
 Краткое руководство по использованию шаблона Teleport
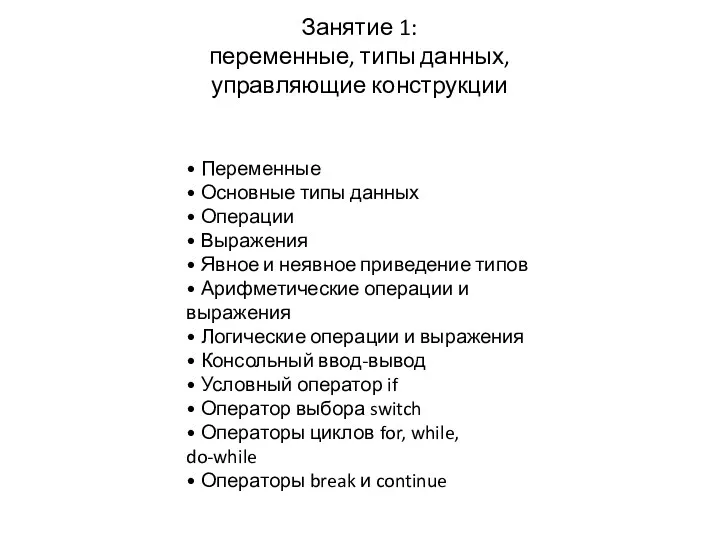 Переменные, типы данных, управляющие конструкции. Урок 1
 Үлестірілген жүйелер
 Схема состава объекта
 Информационные системы
 Технические средства и системы информатизации, устройство ПК
 Информационные технологии в системе дистанционного обучения
 Установка нового леса
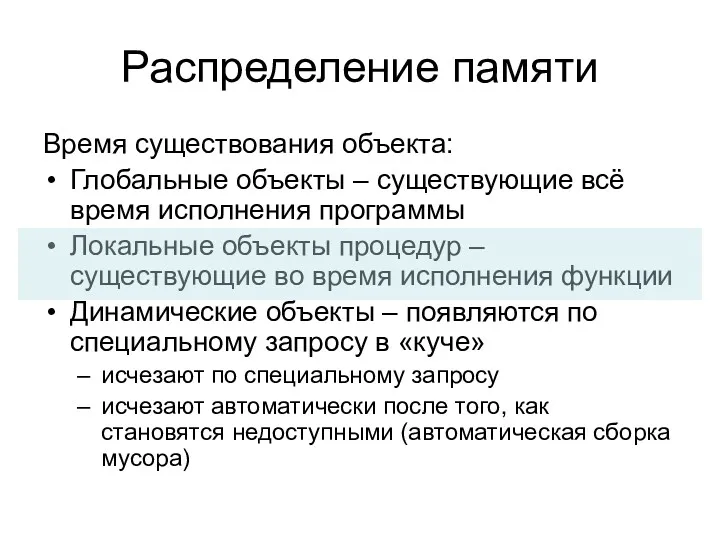 5. Распределение памяти
 Общие сведения о языке программирования Паскаль
 MS Access. Основные элементы главного окна Access
 Автоматизация работы отдела кадров, ОАО Бобруйский мясокомбинат
 Computer basics computer hardware and software