- Methods of graphical representation of information

Содержание
- 2. The purpose: to show what visualization tools and presentations of urban studies and design projects exist.
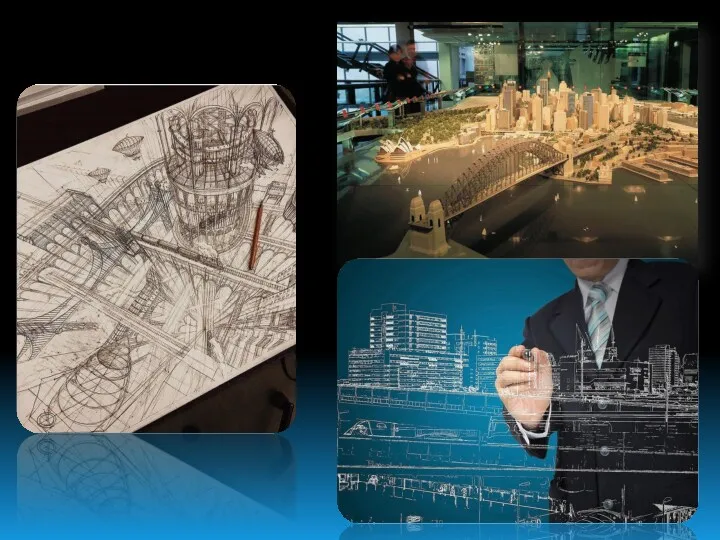
- 3. Tools for the visual presentation of a town planning object traditional hand graphics; volumetric modeling (layout);
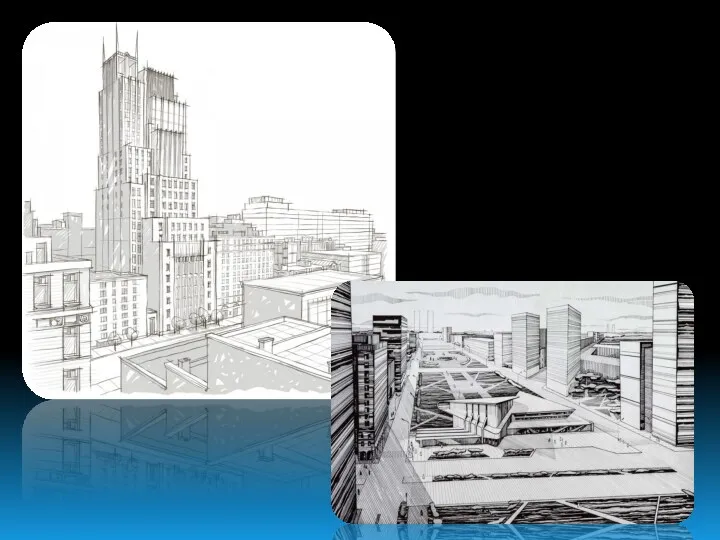
- 4. Traditional hand graphics It assumes knowledge of the method for performing graphic images of projected architectural
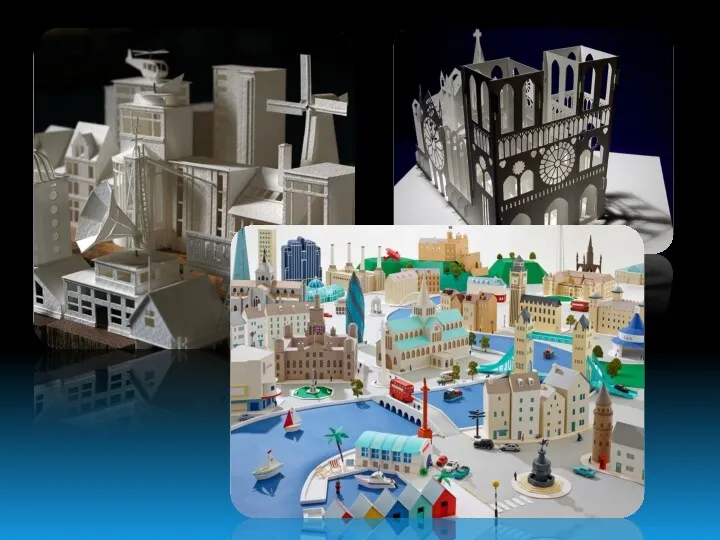
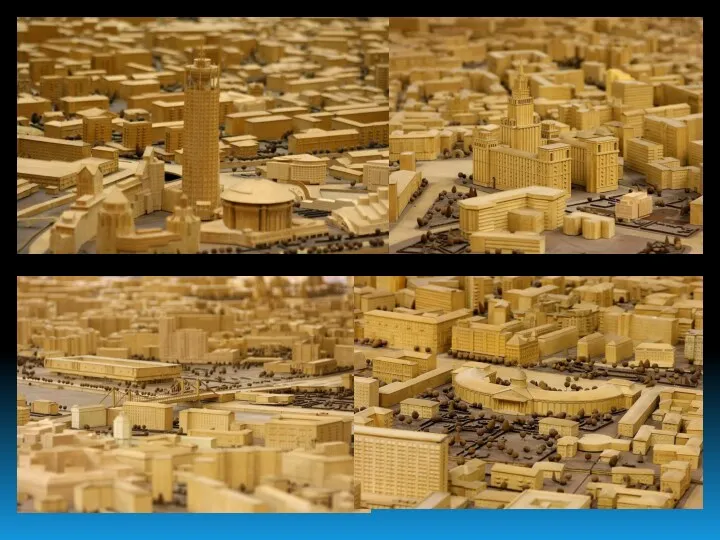
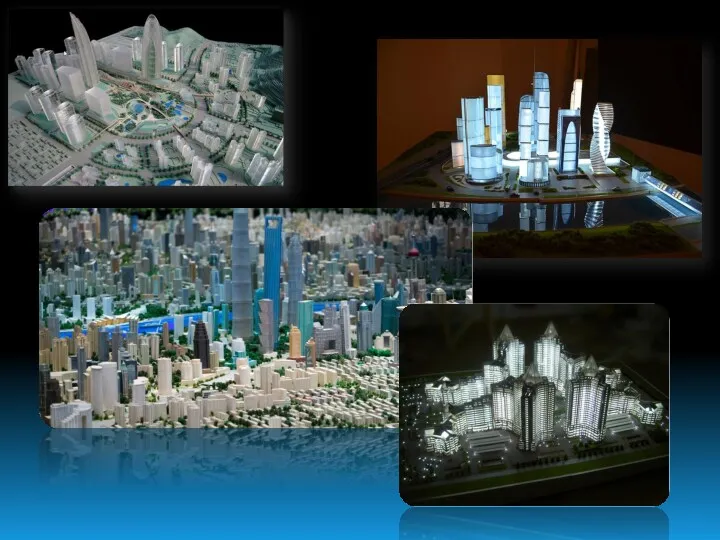
- 6. Volumetric modeling (layout) It consists in creating a tangible 3D model; Different tools and materials are
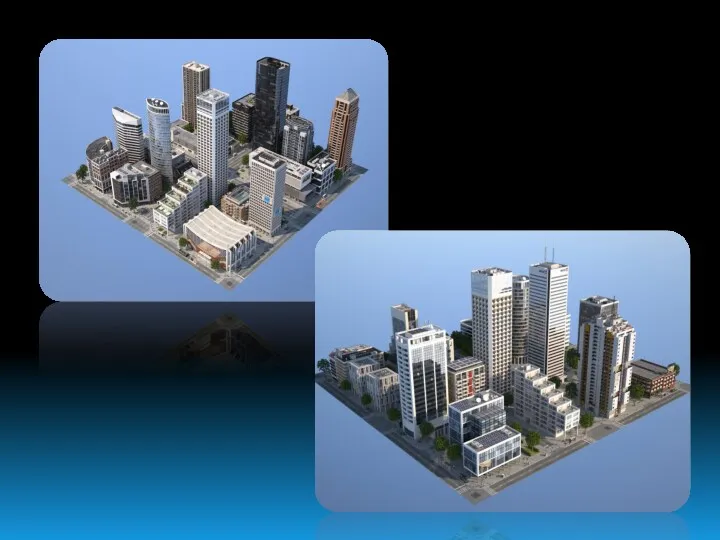
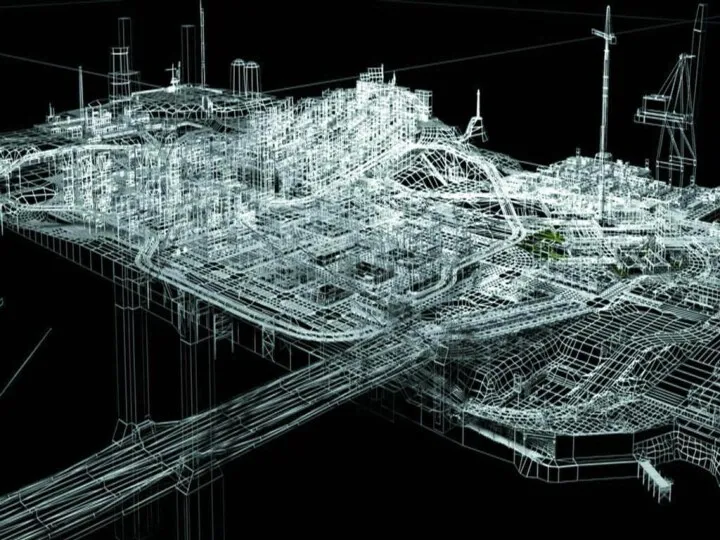
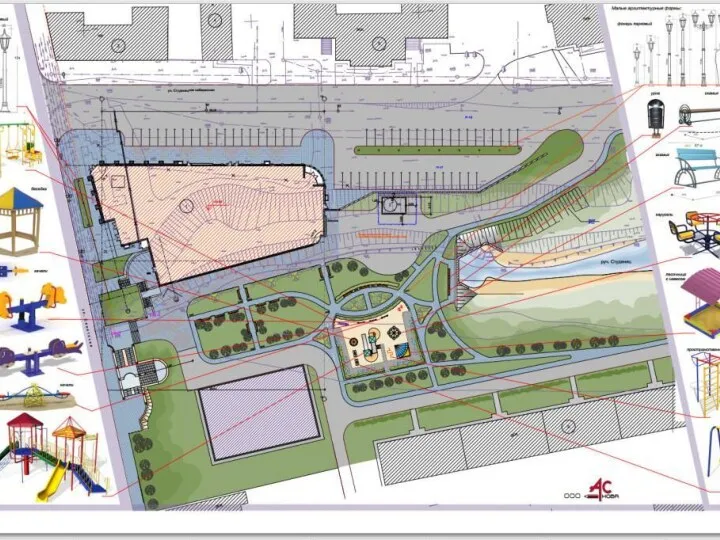
- 10. Modern computer graphics Implies the presence of necessary equipment, for example, computers, graphic tablets, etc; Requires
- 16. Скачать презентацию
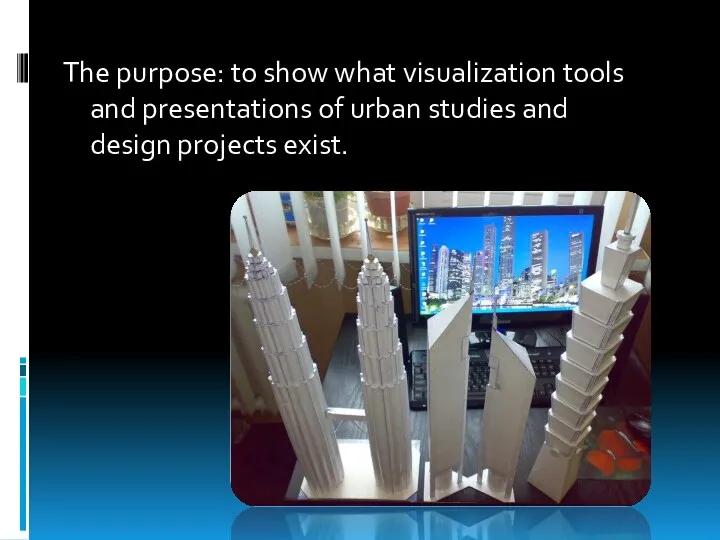
The purpose: to show what visualization tools and presentations of urban
The purpose: to show what visualization tools and presentations of urban
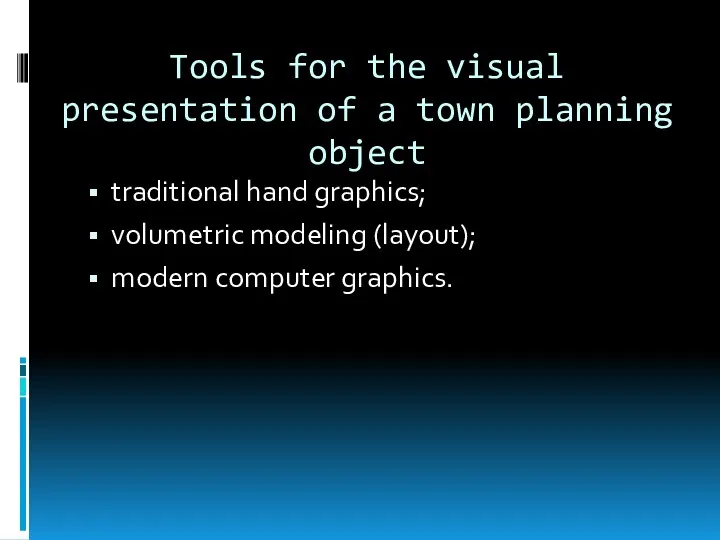
Tools for the visual presentation of a town planning object
traditional hand
Tools for the visual presentation of a town planning object
traditional hand
Traditional hand graphics
It assumes knowledge of the method for performing graphic
Traditional hand graphics
It assumes knowledge of the method for performing graphic
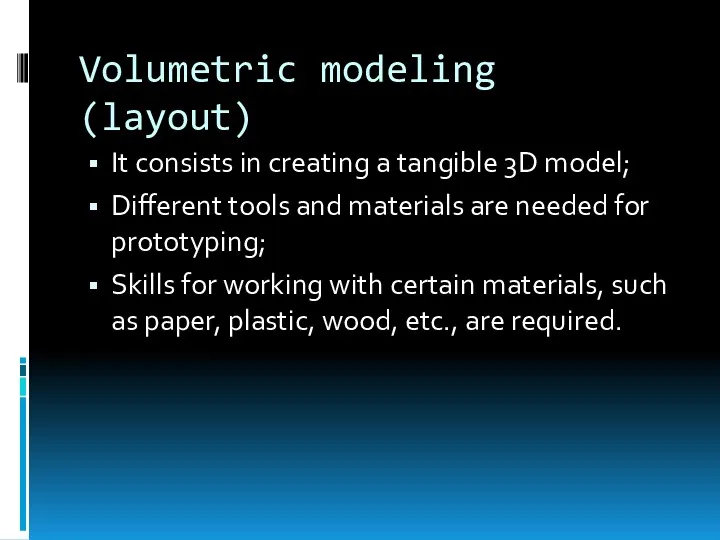
Volumetric modeling (layout)
It consists in creating a tangible 3D model;
Different tools
Volumetric modeling (layout)
It consists in creating a tangible 3D model;
Different tools
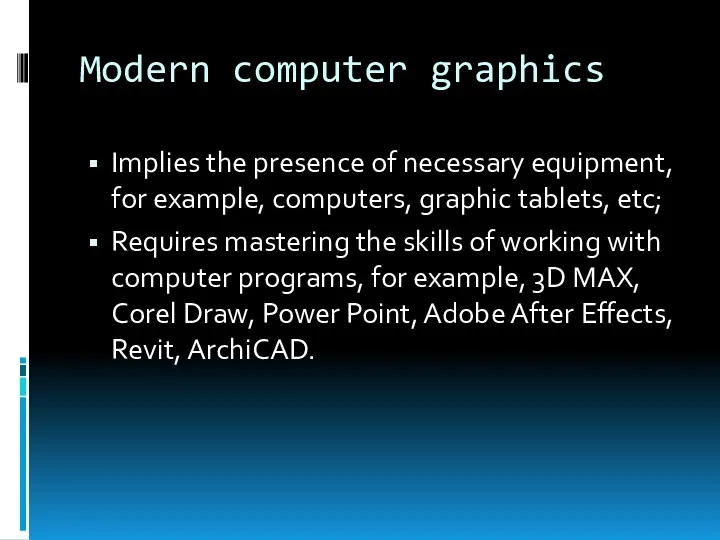
Modern computer graphics
Implies the presence of necessary equipment, for example, computers,
Modern computer graphics
Implies the presence of necessary equipment, for example, computers,
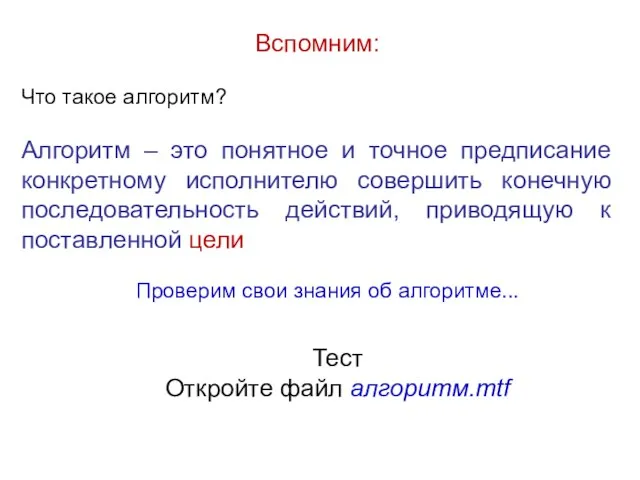 Алгоритм как модель деятельности
 История возникновения чисел
 Применение опросного метода сбора информации
 Нейрокомпьютерные сети
 Практикум по основам языка разметки гипертекстов HTML
 Життя з Інформаційними технологіями
 Ум компьютера - это ум человека, воплощенный в программе. Программное обеспечение
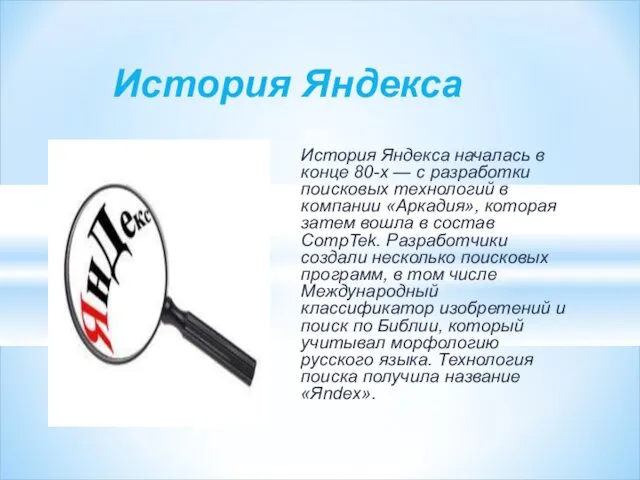 История Яндекса
 Продукты Oracle
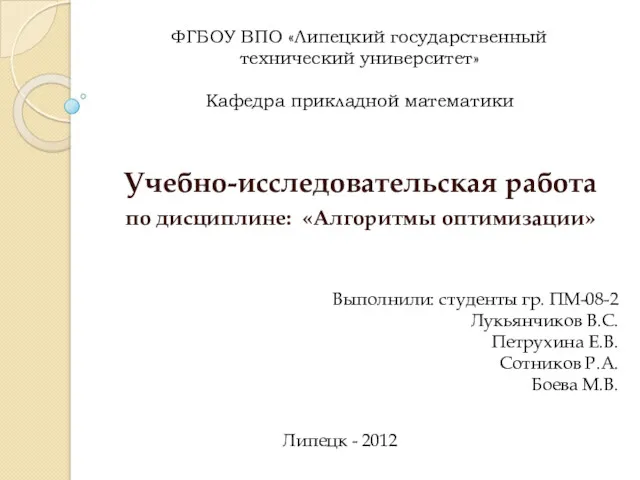 Алгоритмы оптимизации
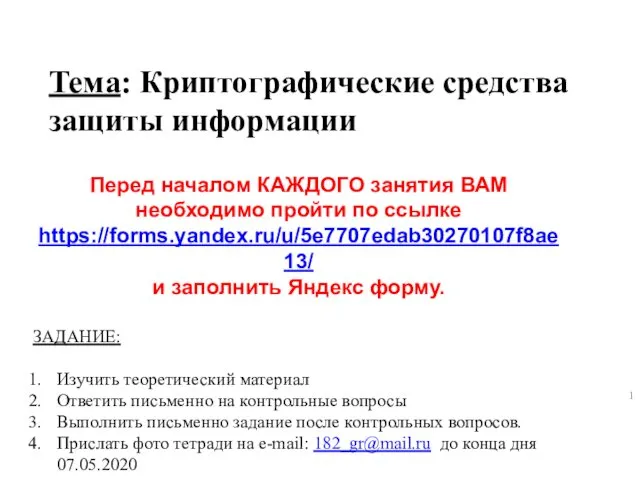 Криптографические средства защиты информации
 Технологические основы цифровой экономики (облачные вычисления, большие данные и интернет вещей)
 Создание собственных публикаций
 Русскоязычные сайты социального оценивания как платформа для развития гражданского общества в России
 Python. Символы и строки
 Язык программирования Python. Основы языка Python. Линейные программы
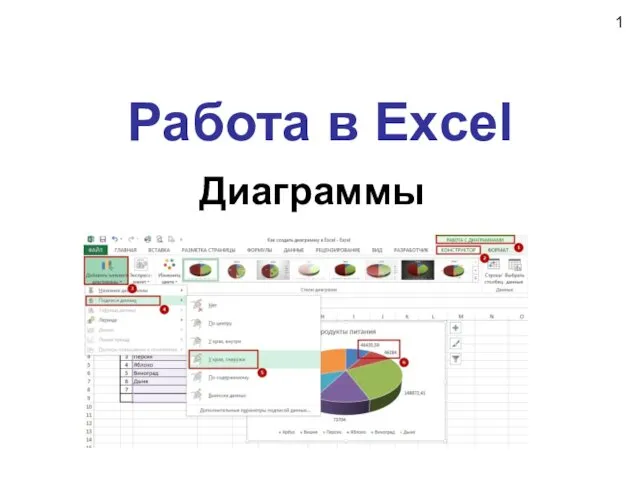 Диаграммы
 Методическая разработка урока Системная среда. 8 класс
 Интернет желісіне жалпы сипаттама
 Одномерные массивы. Вставка и удаление элемента
 Практическая работа в MS PowerPoint-2010
 Использование интернет и информационных технологий на уроках истории
 Состав и структура АИС
 Безопасность будущего (кибербезопасность)
 Антивирусная программа Dr.Web
 Технология создания программы с использованием алгоритмической структуры развилка
 Основные компоненты ПК
 Программирование (Python). Разветвляющиеся алгоритмы. Ветвление