- Reporting Workflow. Ink Usage Calculation and Reporting

Содержание
- 2. Overview Get ink usage and cost estimates on any print job-even before it prints. Supports all
- 3. Before You Print Highlight Printer, Click > Change > Conserve Media Manage Inventory Reorder Supplies Long
- 4. Check Reported Ink Usage Accuracy “Known vs. Reported” Fine Tune Correction Factor After You Print Cost
- 5. Configure Quick Set Report the Total Ink in NUMERIC values for use with your EXCEL data
- 6. Configure Printer Configure Printer > Ink Calculation Tab > Reporting Unit Select the type of reporting
- 7. Counting Dots Calculation of Ink Usage Ink Drop Size Manufacture Spec RIP-Queue Interprets the Job Accounts
- 8. Resolution 4X More than Acceptable Quality Efficient Material Management Make More Money Cheap/Fast vs. Expensive/Slow
- 9. Printer Reporting Front Panel Display Device Dependent Printed Report HP EPSON MUTOH COLORSPAN SEIKO AND OTHERS…
- 10. Printer Reporting Front Panel Display Usually in Terms of % Calculation Required Volume in Terms of
- 11. Reporting Functions Job Report RIP-Queue Buffer Queue Job Log Change Reporting to Displays New Units
- 12. Tracking Functions Job Log Printed Data Save As “.txt or .csv” Open with Excel File >
- 13. RIP Log Data in Excel Open “.csv” in Excel Remove Unwanted Data Format Data Sheet AutoSum
- 14. Correction Factor (CF) Activities That Consume Ink Making Prints Reported Ink Usage in RIP-Queue Printer Maintenance-Device
- 15. Compare Printer Report to RIP-Queue Report Contact printer manufacture for detailed instructions Extract the ink usage
- 16. Fine Tune Correction Factor Known Values (X) Reported Values (Y) X Divided By Y = New
- 17. Units of Measurements Units of Measurements Density = gram/ml Mass and Weight = ounces or grams
- 18. Hydrometer “Water Measurer” Wine Making Supply Store Make Your Own Densities for Common Liquids Water =
- 19. Calculations Before Print Session Calculations Known Mass How much the Cartridge Weights BEFORE (371.39 grams) Known
- 20. After Print Session Calculations Known Mass Weight Cartridge AFTER Unknown Volume How much Ink is LEFT
- 21. After Print Session Calculations Volume Before – Volume After = Volume Used 220-104 = 116 =
- 22. New Correction Factor Configure Printer > Ink Calculation Tab > Correction Factor Select Printer Resolution and
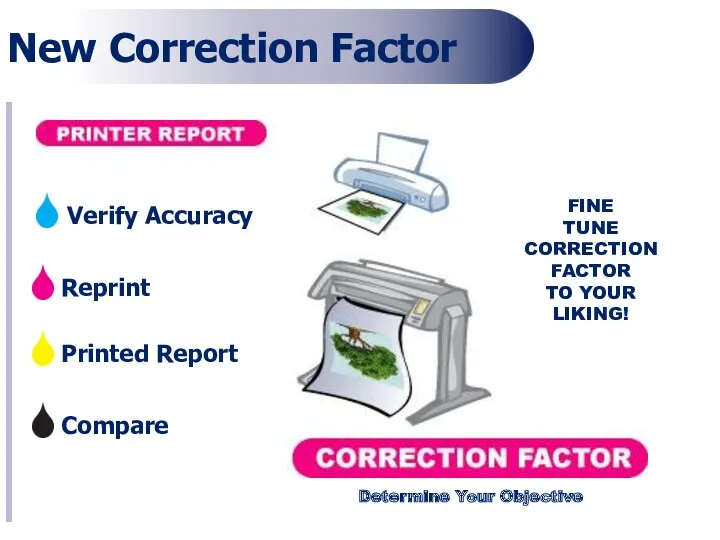
- 23. New Correction Factor Reprint Compare Printed Report FINE TUNE CORRECTION FACTOR TO YOUR LIKING! Determine Your
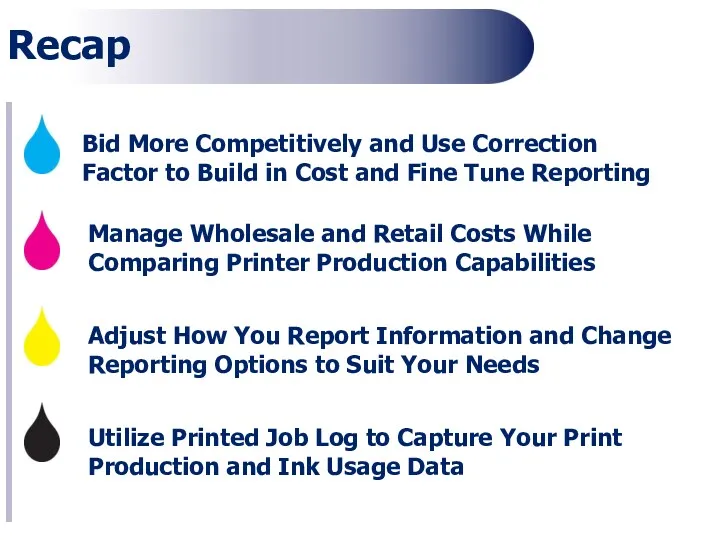
- 24. Recap Bid More Competitively and Use Correction Factor to Build in Cost and Fine Tune Reporting
- 25. Configure a Quick Set > Advanced Button > Output Tab > Calculate Ink Usage Configure a
- 26. Questions?
- 28. Скачать презентацию
Overview
Get ink usage and cost estimates on any print job-even before
Overview
Get ink usage and cost estimates on any print job-even before
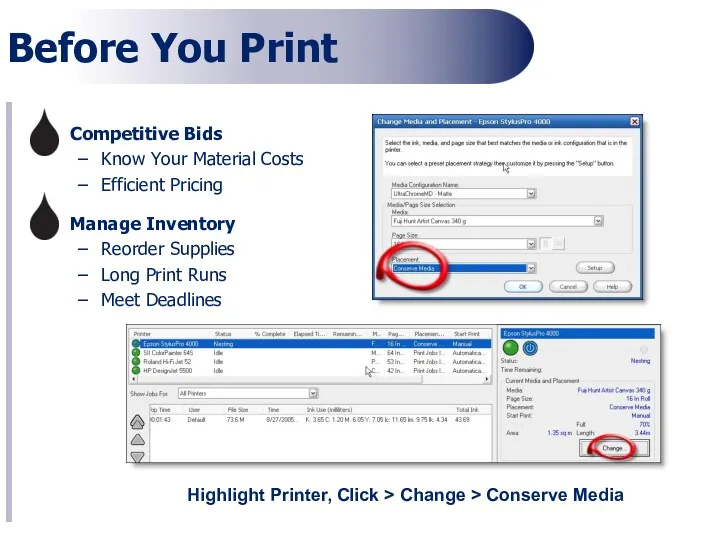
Before You Print
Highlight Printer, Click > Change > Conserve Media
Manage Inventory
Reorder
Before You Print
Highlight Printer, Click > Change > Conserve Media
Manage Inventory
Reorder
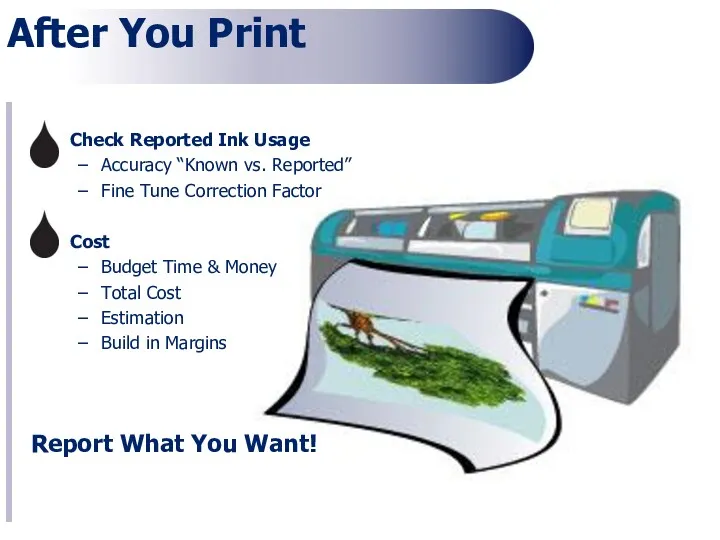
Check Reported Ink Usage
Accuracy “Known vs. Reported”
Fine Tune Correction Factor
After You
Check Reported Ink Usage
Accuracy “Known vs. Reported”
Fine Tune Correction Factor
After You
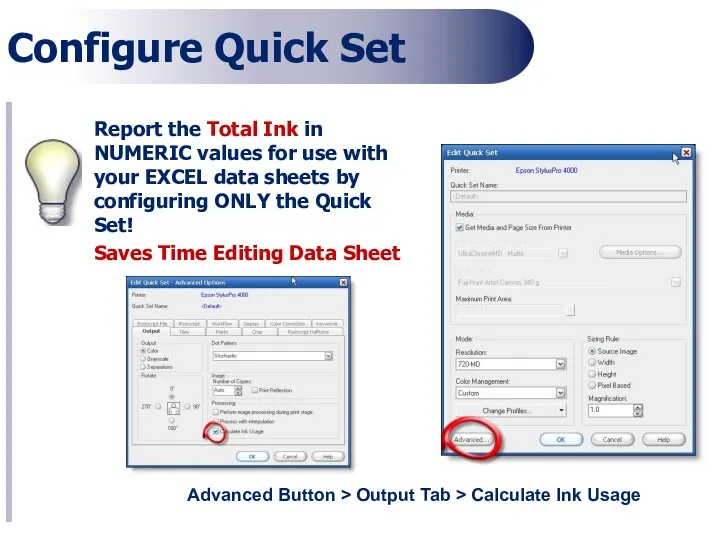
Configure Quick Set
Report the Total Ink in NUMERIC values for use
Configure Quick Set
Report the Total Ink in NUMERIC values for use
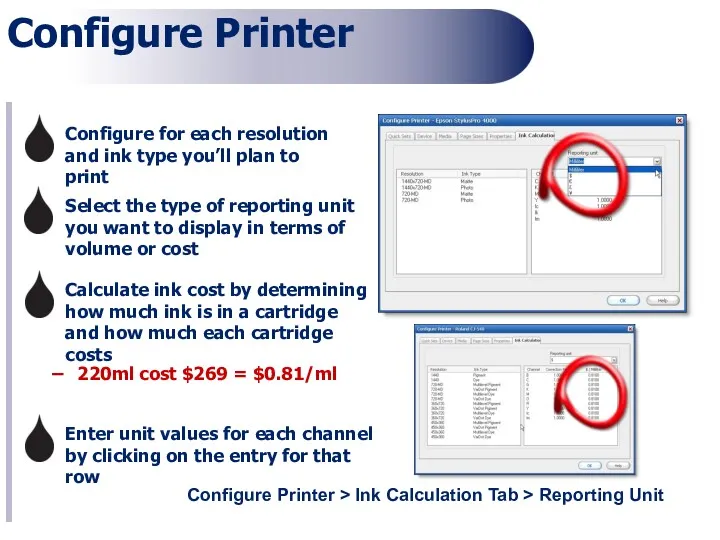
Configure Printer
Configure Printer > Ink Calculation Tab > Reporting Unit
Select the
Configure Printer
Configure Printer > Ink Calculation Tab > Reporting Unit
Select the
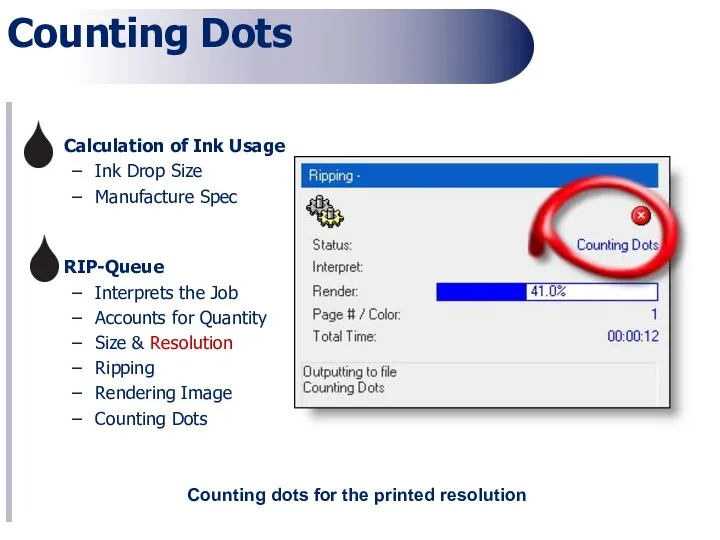
Counting Dots
Calculation of Ink Usage
Ink Drop Size
Manufacture Spec
RIP-Queue
Interprets the Job
Accounts for
Counting Dots
Calculation of Ink Usage
Ink Drop Size
Manufacture Spec
RIP-Queue
Interprets the Job
Accounts for
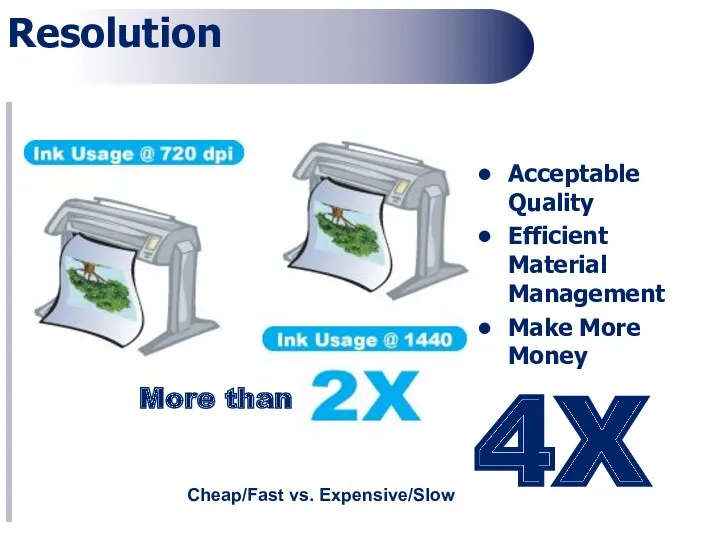
Resolution
4X
More than
Acceptable Quality
Efficient Material Management
Make More Money
Cheap/Fast vs. Expensive/Slow
Resolution
4X
More than
Acceptable Quality
Efficient Material Management
Make More Money
Cheap/Fast vs. Expensive/Slow
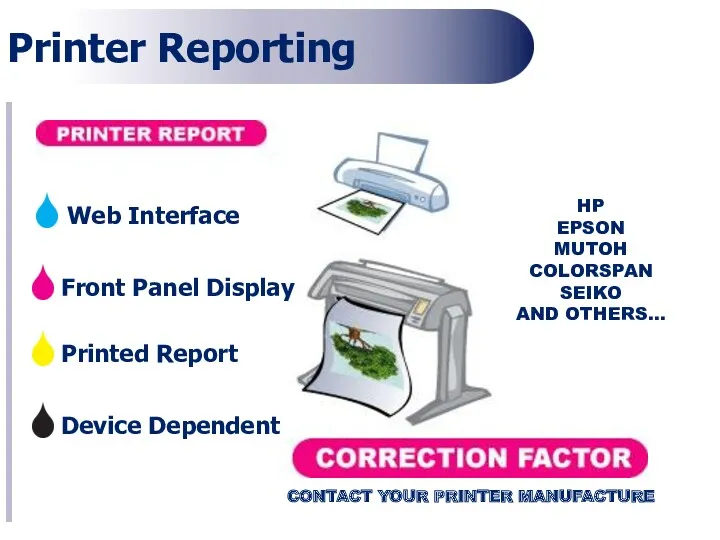
Printer Reporting
Front Panel Display
Device Dependent
Printed Report
HP
EPSON
MUTOH
COLORSPAN
SEIKO
AND OTHERS…
CONTACT YOUR PRINTER MANUFACTURE
Web Interface
Printer Reporting
Front Panel Display
Device Dependent
Printed Report
HP
EPSON
MUTOH
COLORSPAN
SEIKO
AND OTHERS…
CONTACT YOUR PRINTER MANUFACTURE
Web Interface
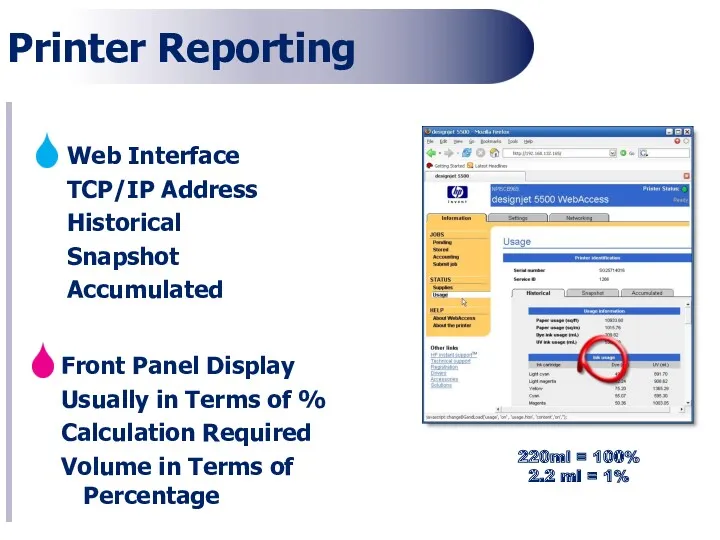
Printer Reporting
Front Panel Display
Usually in Terms of %
Calculation Required
Volume in Terms
Printer Reporting
Front Panel Display
Usually in Terms of %
Calculation Required
Volume in Terms
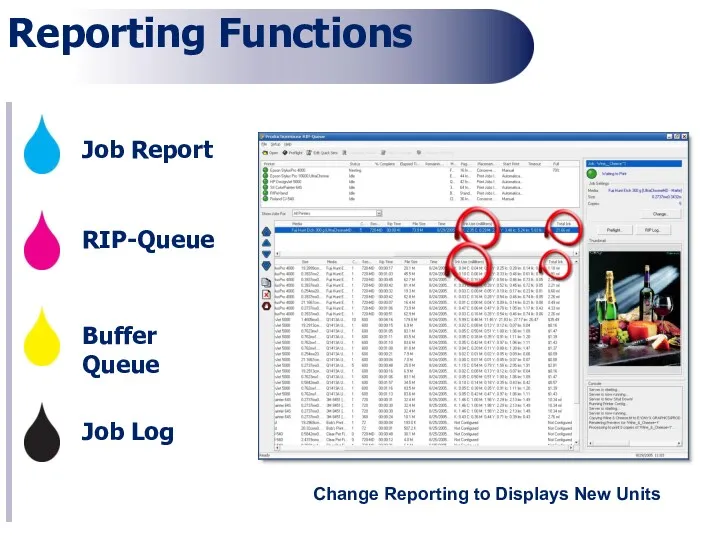
Reporting Functions
Job Report
RIP-Queue
Buffer Queue
Job Log
Change Reporting to Displays New Units
Reporting Functions
Job Report
RIP-Queue
Buffer Queue
Job Log
Change Reporting to Displays New Units
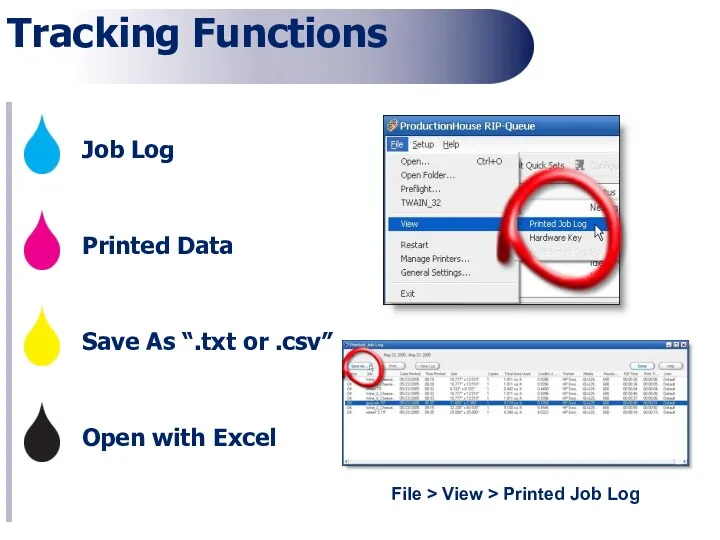
Tracking Functions
Job Log
Printed Data
Save As “.txt or .csv”
Open with Excel
File
Tracking Functions
Job Log
Printed Data
Save As “.txt or .csv”
Open with Excel
File
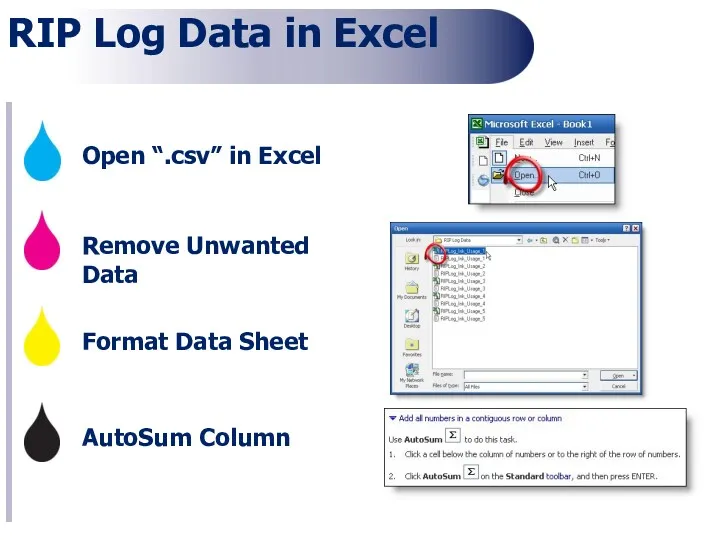
RIP Log Data in Excel
Open “.csv” in Excel
Remove Unwanted Data
Format Data
RIP Log Data in Excel
Open “.csv” in Excel
Remove Unwanted Data
Format Data
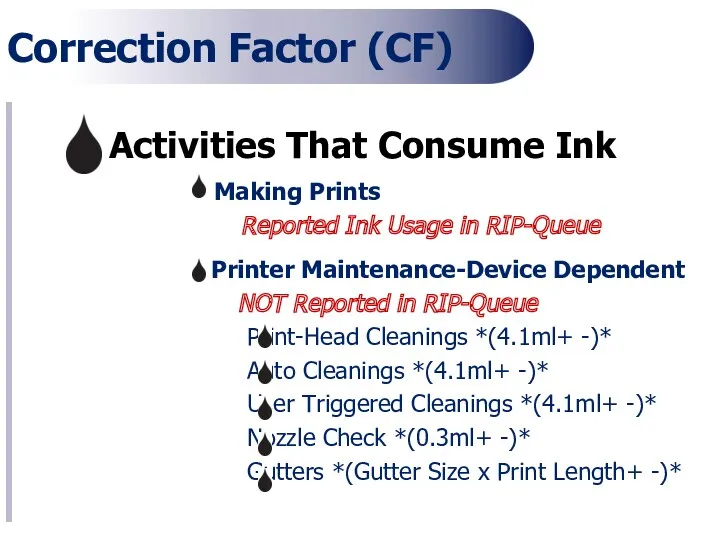
Correction Factor (CF)
Activities That Consume Ink
Making Prints
Reported Ink Usage in RIP-Queue
Printer
Correction Factor (CF)
Activities That Consume Ink
Making Prints
Reported Ink Usage in RIP-Queue
Printer
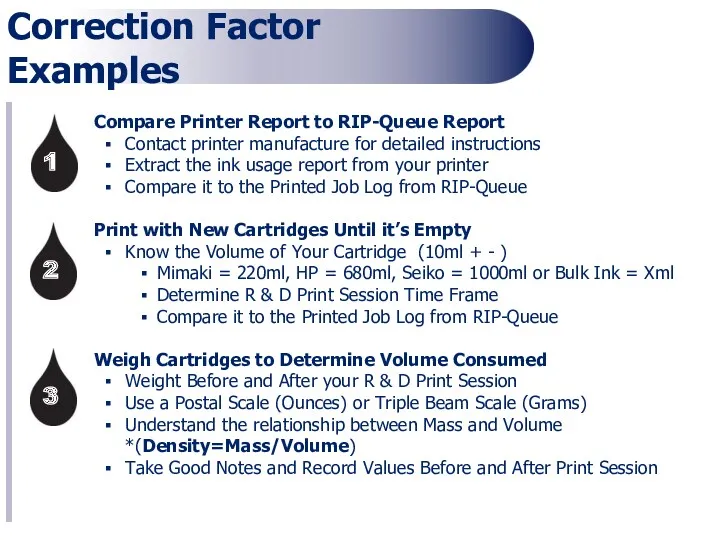
Compare Printer Report to RIP-Queue Report
Contact printer manufacture for detailed instructions
Extract
Compare Printer Report to RIP-Queue Report
Contact printer manufacture for detailed instructions
Extract
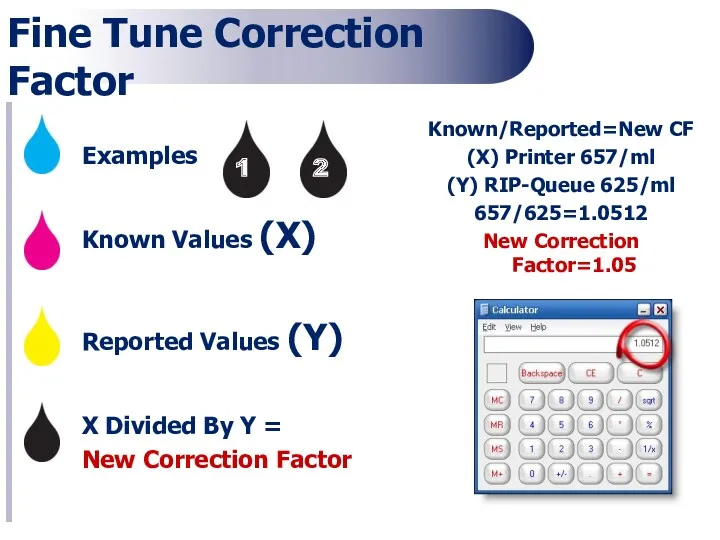
Fine Tune Correction Factor
Known Values (X)
Reported Values (Y)
X Divided By Y
Fine Tune Correction Factor
Known Values (X)
Reported Values (Y)
X Divided By Y
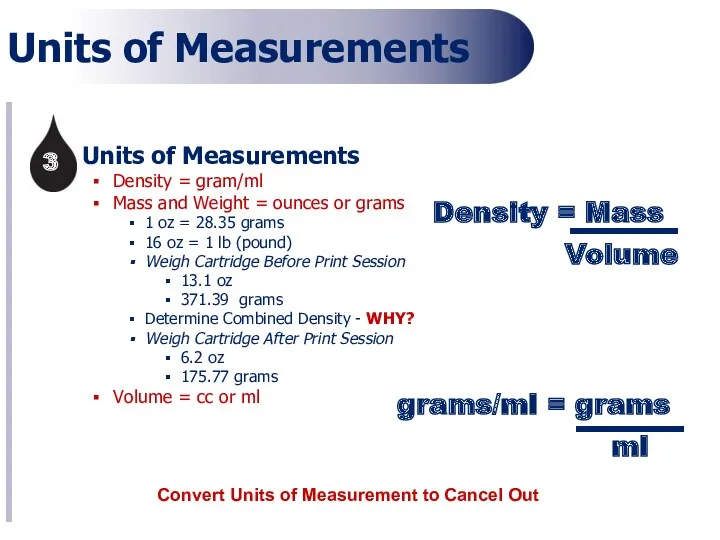
Units of Measurements
Units of Measurements
Density = gram/ml
Mass and Weight = ounces
Units of Measurements
Units of Measurements
Density = gram/ml
Mass and Weight = ounces
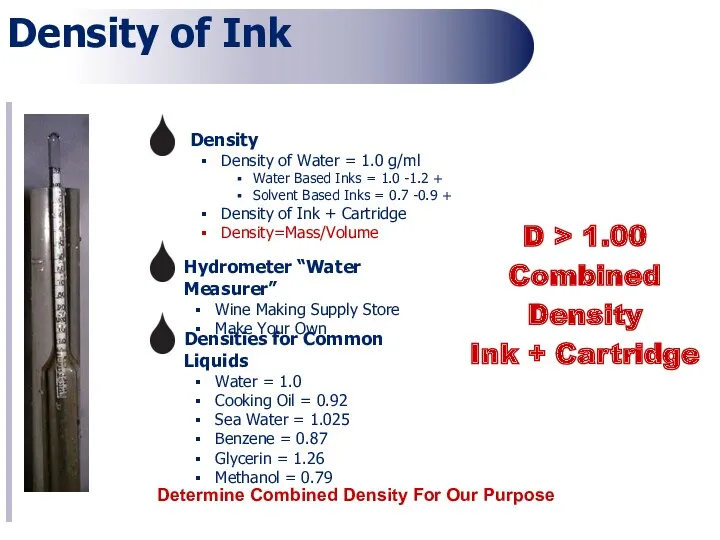
Hydrometer “Water Measurer”
Wine Making Supply Store
Make Your Own
Densities for Common Liquids
Water
Wine Making Supply Store
Make Your Own
Densities for Common Liquids
Water
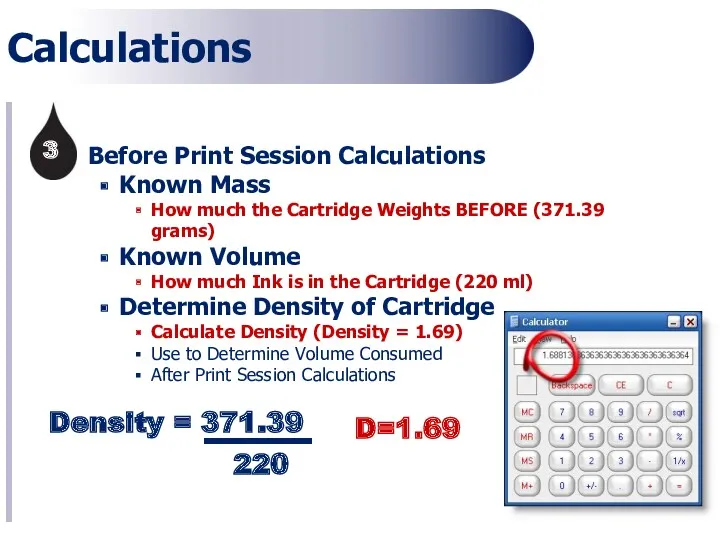
Calculations
Before Print Session Calculations
Known Mass
How much the Cartridge Weights BEFORE (371.39
Calculations
Before Print Session Calculations
Known Mass
How much the Cartridge Weights BEFORE (371.39
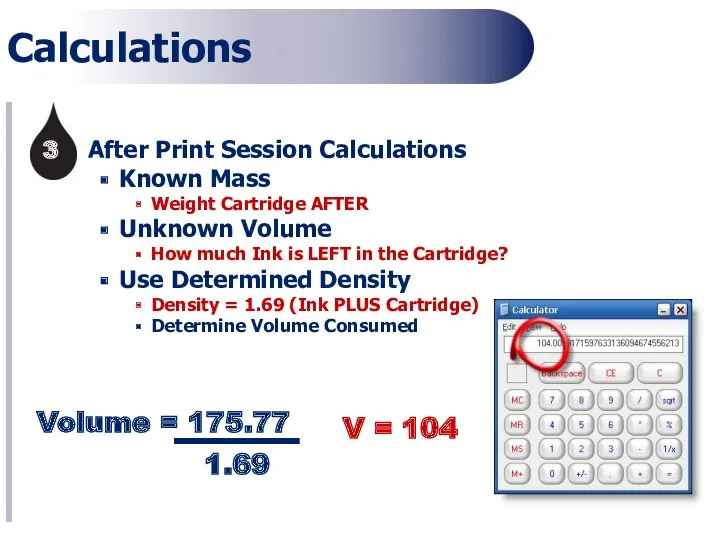
After Print Session Calculations
Known Mass
Weight Cartridge AFTER
Unknown Volume
How much Ink is
After Print Session Calculations
Known Mass
Weight Cartridge AFTER
Unknown Volume
How much Ink is
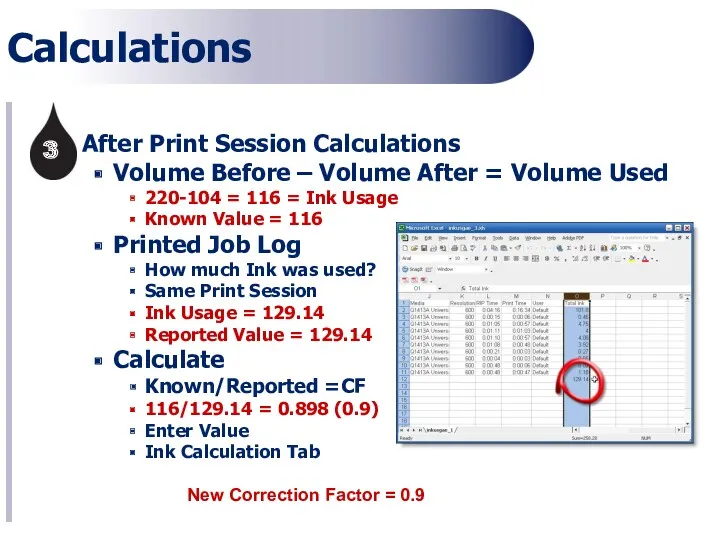
After Print Session Calculations
Volume Before – Volume After = Volume Used
220-104
After Print Session Calculations
Volume Before – Volume After = Volume Used
220-104
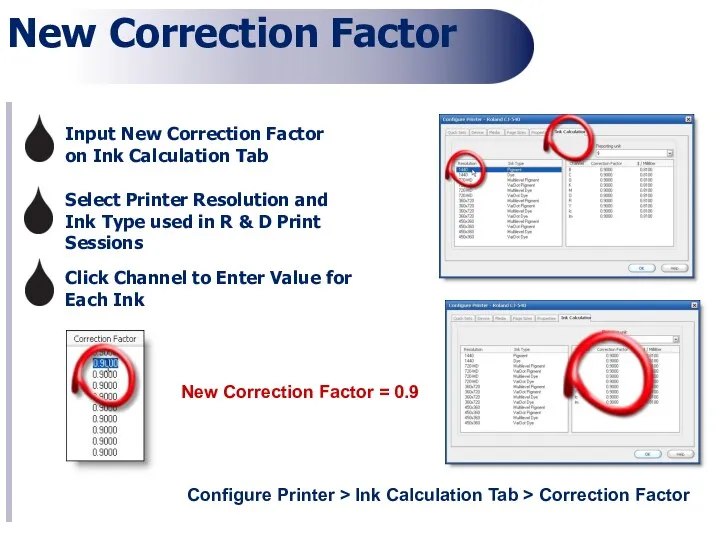
New Correction Factor
Configure Printer > Ink Calculation Tab > Correction Factor
Select
New Correction Factor
Configure Printer > Ink Calculation Tab > Correction Factor
Select
New Correction Factor
Reprint
Compare
Printed Report
FINE
TUNE
CORRECTION FACTOR
TO YOUR
LIKING!
Determine Your Objective
Verify Accuracy
New Correction Factor
Reprint
Compare
Printed Report
FINE
TUNE
CORRECTION FACTOR
TO YOUR
LIKING!
Determine Your Objective
Verify Accuracy
Recap
Bid More Competitively and Use Correction Factor to Build in Cost
Recap
Bid More Competitively and Use Correction Factor to Build in Cost
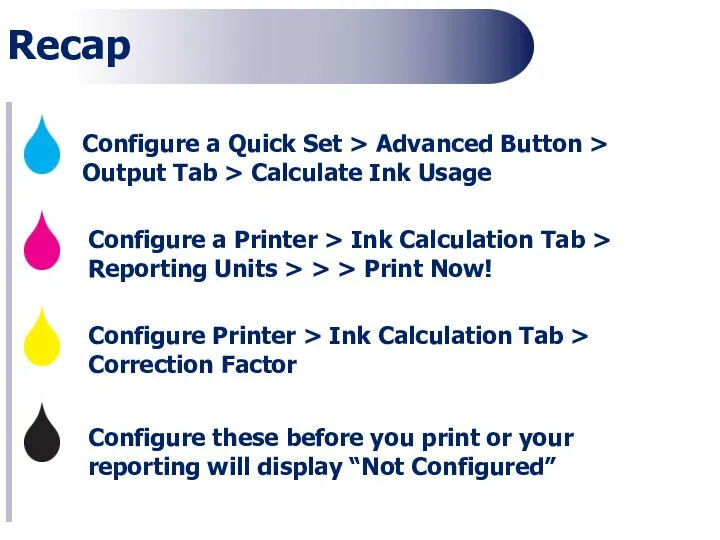
Configure a Quick Set > Advanced Button > Output Tab >
Configure a Quick Set > Advanced Button > Output Tab >
Questions?
Questions?
 Электронно-библиотечные системы. Лекция 6
 Программирование линейных алгоритмов
 Сервисы интернета
 Урок обобщение знаний Объекты окружающего мира, Компьютерные объекты 6 класс, учебник Босова Л.Л.
 Безопасность в интернете
 Программирование на Python
 Электронное правительство
 54. Layouts в Android. Класс Handler, таймеры, типы макетов
 Администрирование в ЛВС
 Дискретная математика: теория алгоритмов и сложность вычислений
 Среда программирования Кумир. Чертежник
 Операционная система. Программное обеспечение компьютера
 Имена и типы файлов
 Угрозы информации
 Урок Табличное решение логических задач
 Перспективы развития средств фундаментального и метрологического обеспечения системы ГЛОНАСС
 Створення БД у режимі майстра
 Selenium RC
 Digital Civility 2021 Global Report
 Язык Паскаль
 Персональные данные и их защита
 Теория информации. Энтропия и информация
 Install Apache Cassandra on Ubuntu. Work with Cassandra and Python
 Классы и объекты
 Этика в Интернете. 11 класс
 Использование информационно-коммуникационных технологий на уроках русского языка и литературы
 Классификация вредоносных, нежелательных и условно опасных программ
 Мир информатики. Своя игра