- Scheduling. Introduction

Содержание
- 2. Where are we? 1. Introduction 2. Project Life Cycles 3. Project Artifacts 4. Work Elements, Schedule,
- 3. Outline The last lecture dealt with Artifacts of Project Today we focus on Dependencies and Scheduling
- 4. Dependency Diagrams (Overview) Dependency diagrams consist of 3 elements Event (also called milestone): A significant occurrence
- 5. Why Dependency Diagrams? Example: You are assigned a project consisting of 10 activities which take one
- 6. 1) Activity-on-the-arrow Diagram Notation Activity Span Time
- 7. PERT PERT is an activity-on-the-arrow notation PERT = Program Evaluation and Review Technique Developed in the
- 8. 2) Activity-in-the-node Diagram Notation Activity A Node is either an event or an activity. Distinction: Events
- 9. Example of an Activity-in -the -Node Diagram Activity 3 t3 = 1 Activity 4 t4 =
- 10. What do we do with these diagrams? Compute the project duration Determine activities that are critical
- 11. Definitions: Critical Path and Slack Time4 Critical path: A sequence of activities that take the longest
- 12. Example of a critical path Activity 3 t3 = 1 Activity 4 t4 = 3 Activity
- 13. Definitions: Start and Finish Dates Earliest start date: The earliest date you can start an activity
- 14. 2 Ways to Analyze Dependency Diagrams Forward pass: Goal is the determination of critical paths Compute
- 15. Forward Path Example Activity Earliest Start(ES) Earliest Finish(EF) A1 Start of week 1 End of week
- 16. Backward Path Example Activity Latest Start(LS) Latest Finish(LF) A2 End of week 7 A3 End of
- 17. Computation of slack times Slack time ST of an activity A: STA = LSA - ESA
- 18. Path types in dependency graphs Critical path: Any path in a dependency diagram, in which all
- 19. Frequently used formats for dependency graphs Milestone View (“Key-Events report”): A table that lists milestones and
- 20. Key-Events Report Date Milestone August 26 Project Kickoff (with Client) October 16 Analysis Review October 26
- 21. Activities View Date Project Phases Jul 17-Aug 23 Preplanning Phase Aug 26 - Sep 24 Project
- 22. Gantt Chart Time (in weeks after start) Activity 1 Activity 2 1 2 3 4 5
- 23. Gantt Chart Time (in weeks after start) Activity 1 Activity 2 1 2 3 4 5
- 24. Two Types of Gantt Charts Person-Centered View To determine people‘s load Activity-Centered View To identify teams
- 25. Tools support for Establishing Schedules Tool support for Graphical user interface for entering activity data Automatic
- 26. What do we cover now? How to develop an initial project schedule How to shorten the
- 27. How to develop an Initial Project Schedule Identify all your activities (reuse a template if possible)
- 28. Developing a Schedule for Integration Testing Five Steps: 1. Start with System Decomposition 2. Determine your
- 29. 1. Start with System Decomposition
- 30. 2. Determine Your Integration Testing Strategy Types of integration testing strategies We choose sandwich testing. Why?
- 31. Sandwich Testing Sandwich testing combines parallel top-down and bottom-up integration testing Top-down testing tests the top
- 32. 3. Determine the Dependency Diagram (Sandwich Testing , UML Activity Diagram) Target layer components: B, C,
- 33. Dependency Diagram for a Modified Sandwich Testing Strategy
- 34. 4. Add Time Estimates (PERT Chart)
- 35. 5. Visualize your Schedule (Gantt Chart View )
- 36. What do we cover now? How to develop an initial project schedule How to shorten the
- 37. How to reduce the planned project time Recheck the original span time estimates Ask other experts
- 38. Typical Mistakes when Developing Schedules The „Backing in“ Mistake Using Fudge Factors
- 39. The “Backing in” Mistake Definition “Backing In”: You start at the last milestone of the project
- 40. Using Fudge Factors Parkinson formulated this law for project completion: Work tends to expand to fill
- 41. Heuristics for dealing with time 1. First Set the Project Start Time => Determines the planned
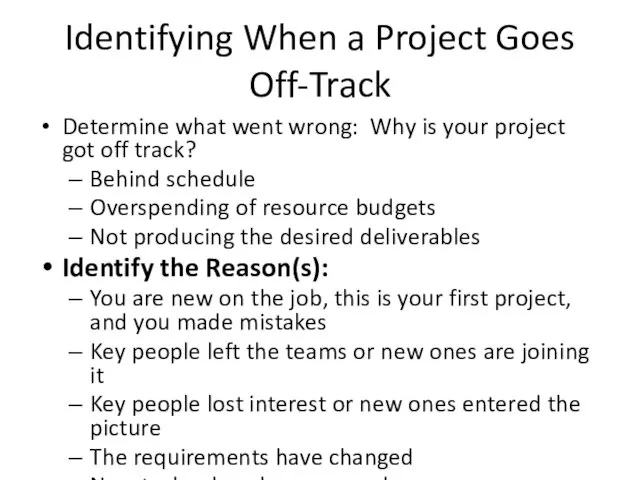
- 42. Identifying When a Project Goes Off-Track Determine what went wrong: Why is your project got off
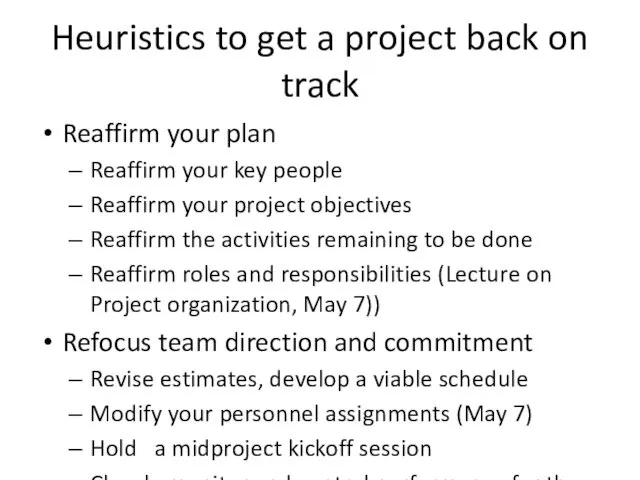
- 43. Heuristics to get a project back on track Reaffirm your plan Reaffirm your key people Reaffirm
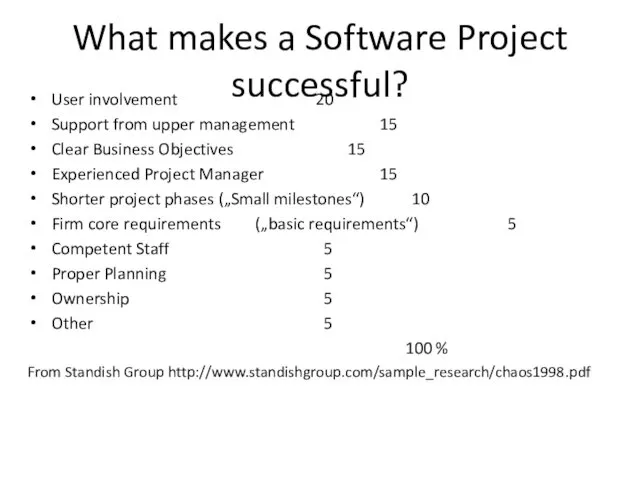
- 44. What makes a Software Project successful? User involvement 20 Support from upper management 15 Clear Business
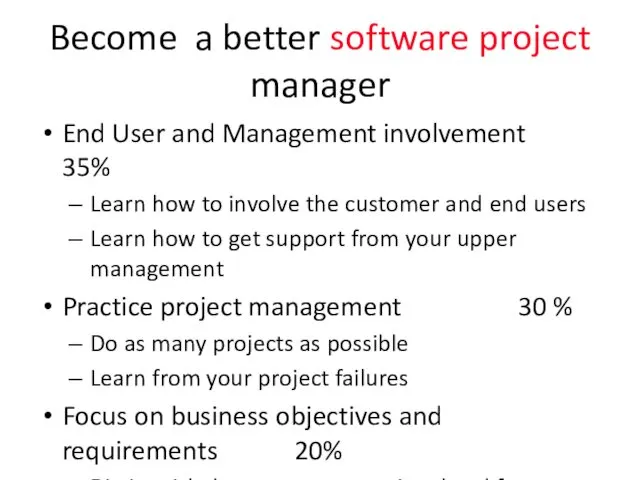
- 45. Become a better software project manager End User and Management involvement 35% Learn how to involve
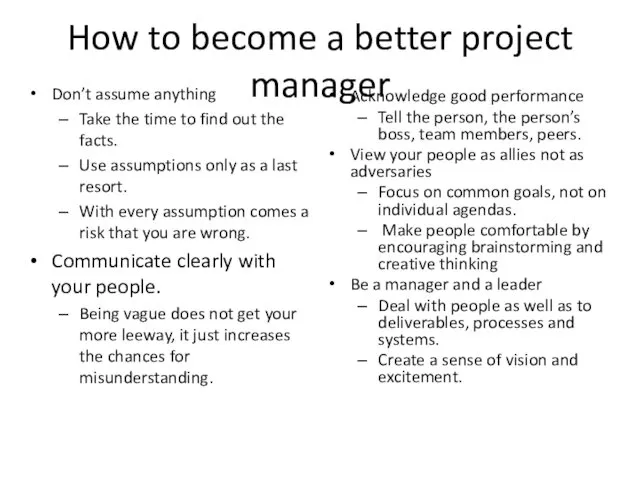
- 46. How to become a better project manager Don’t assume anything Take the time to find out
- 47. Additional Readings [IEEE Std 1058] Standard for Software Project Management Plans Stanley E Portny, Project Management
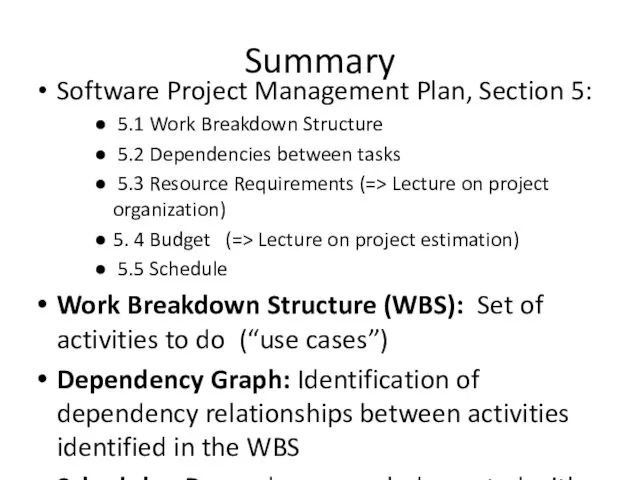
- 48. Summary Software Project Management Plan, Section 5: 5.1 Work Breakdown Structure 5.2 Dependencies between tasks 5.3
- 50. Скачать презентацию
Where are we?
1. Introduction
2. Project Life Cycles
3. Project Artifacts
4. Work Elements, Schedule, Budget
Where are we?
1. Introduction
2. Project Life Cycles
3. Project Artifacts
4. Work Elements, Schedule, Budget
Outline
The last lecture dealt with Artifacts of Project
Today we focus on Dependencies
Outline
The last lecture dealt with Artifacts of Project
Today we focus on Dependencies
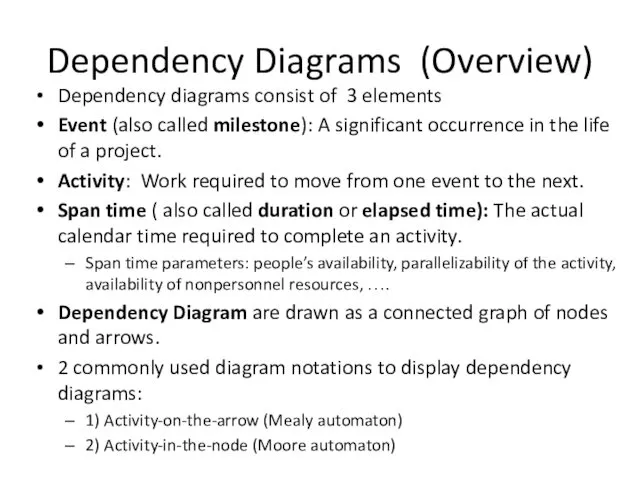
Dependency Diagrams (Overview)
Dependency diagrams consist of 3 elements
Event (also called milestone): A significant
Dependency Diagrams (Overview)
Dependency diagrams consist of 3 elements
Event (also called milestone): A significant
Why Dependency Diagrams?
Example:
You are assigned a project consisting of 10 activities which
Why Dependency Diagrams?
Example:
You are assigned a project consisting of 10 activities which
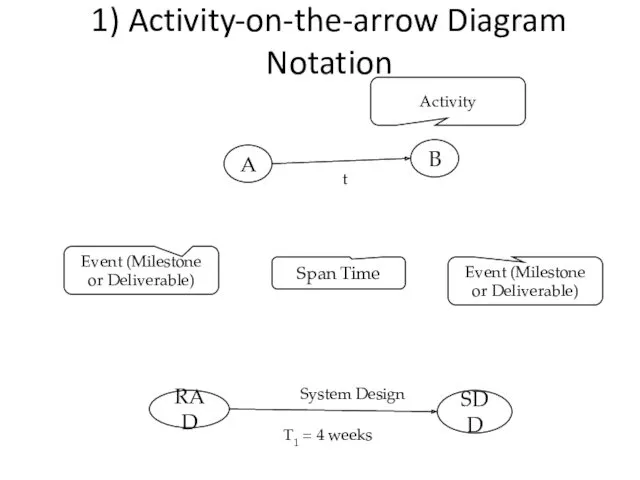
1) Activity-on-the-arrow Diagram Notation
Activity
Span Time
1) Activity-on-the-arrow Diagram Notation
Activity
Span Time
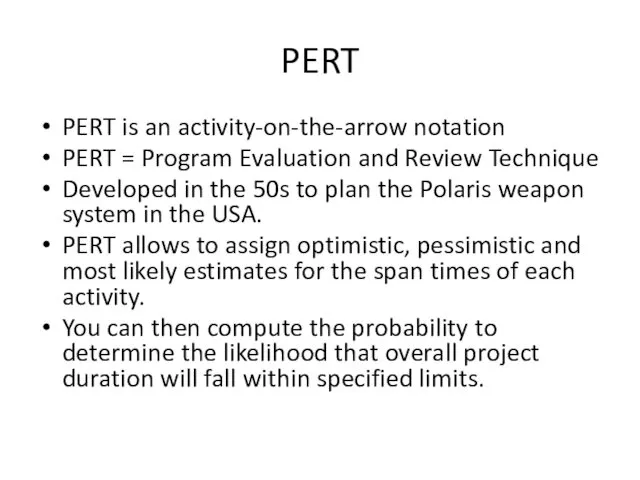
PERT
PERT is an activity-on-the-arrow notation
PERT = Program Evaluation and Review Technique
Developed in
PERT
PERT is an activity-on-the-arrow notation
PERT = Program Evaluation and Review Technique
Developed in
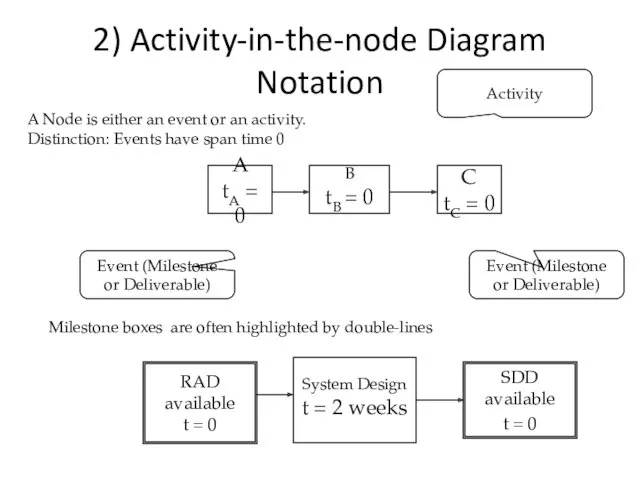
2) Activity-in-the-node Diagram Notation
Activity
A Node is either an event or an activity.
Distinction:
2) Activity-in-the-node Diagram Notation
Activity
A Node is either an event or an activity.
Distinction:
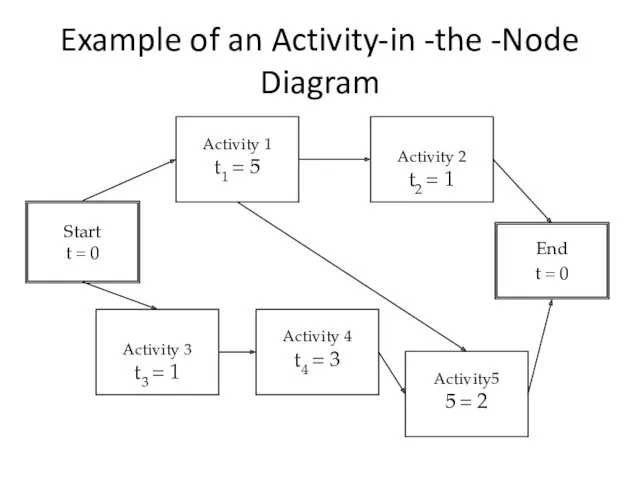
Example of an Activity-in -the -Node Diagram
Activity 3
t3 = 1
Activity 4
t4 = 3
Activity
Example of an Activity-in -the -Node Diagram
Activity 3
t3 = 1
Activity 4
t4 = 3
Activity
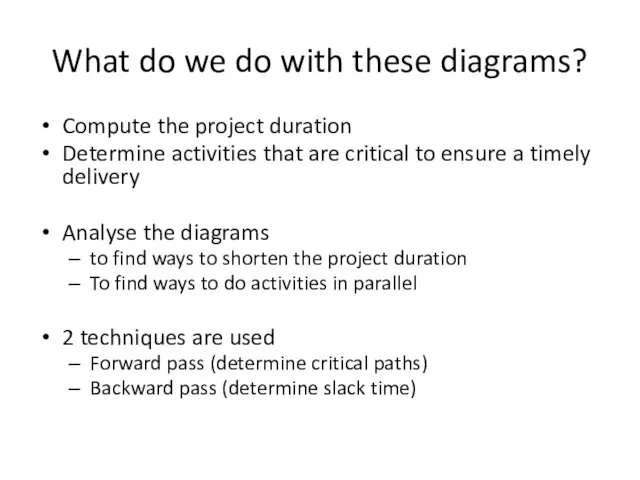
What do we do with these diagrams?
Compute the project duration
Determine activities that
What do we do with these diagrams?
Compute the project duration
Determine activities that
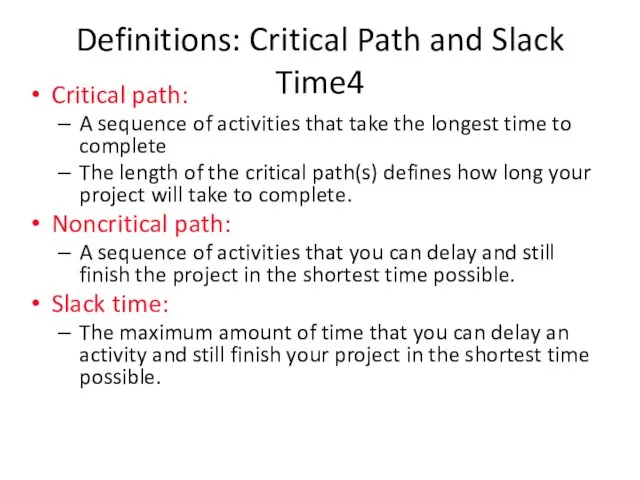
Definitions: Critical Path and Slack Time4
Critical path:
A sequence of activities that take
Definitions: Critical Path and Slack Time4
Critical path:
A sequence of activities that take
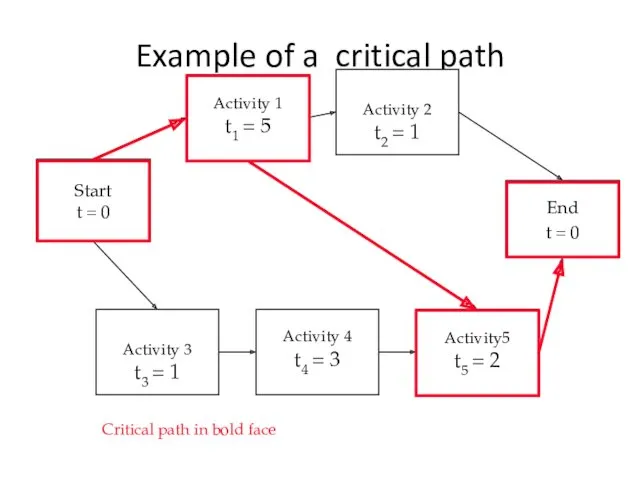
Example of a critical path
Activity 3
t3 = 1
Activity 4
t4 = 3
Activity 2
t2 =
Example of a critical path
Activity 3
t3 = 1
Activity 4
t4 = 3
Activity 2
t2 =
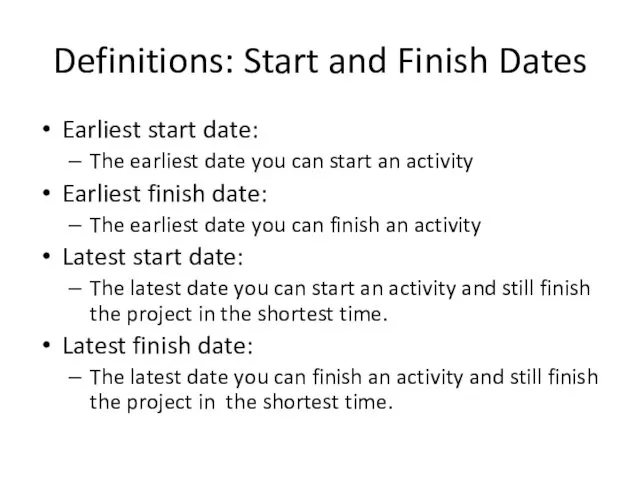
Definitions: Start and Finish Dates
Earliest start date:
The earliest date you can start
Definitions: Start and Finish Dates
Earliest start date:
The earliest date you can start
2 Ways to Analyze Dependency Diagrams
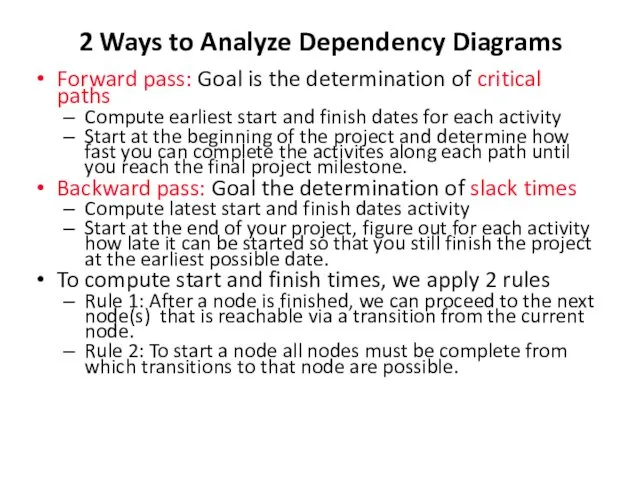
Forward pass: Goal is the determination of critical
2 Ways to Analyze Dependency Diagrams
Forward pass: Goal is the determination of critical
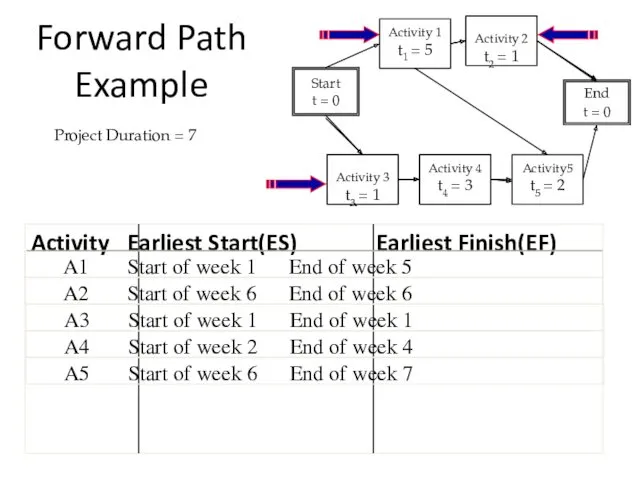
Forward Path Example
Activity Earliest Start(ES) Earliest Finish(EF)
A1 Start of week 1 End of week
Forward Path Example
Activity Earliest Start(ES) Earliest Finish(EF)
A1 Start of week 1 End of week
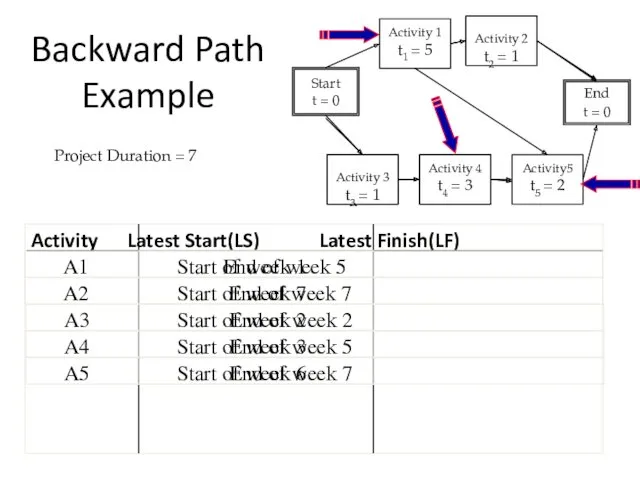
Backward Path Example
Activity Latest Start(LS) Latest Finish(LF)
A2 End of week 7
A3 End of
Backward Path Example
Activity Latest Start(LS) Latest Finish(LF)
A2 End of week 7
A3 End of
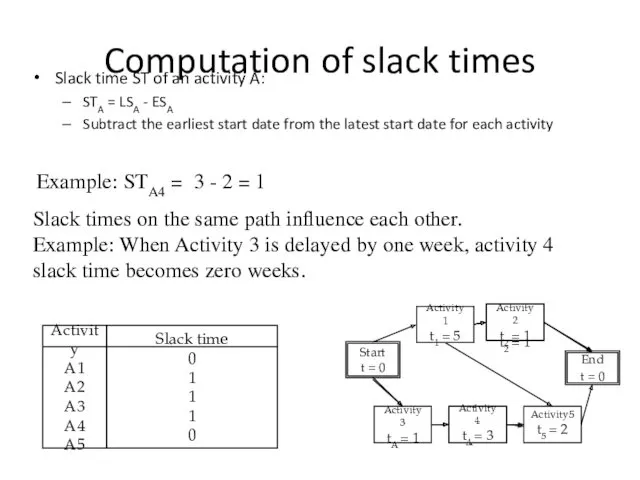
Computation of slack times
Slack time ST of an activity A:
STA = LSA
Computation of slack times
Slack time ST of an activity A:
STA = LSA
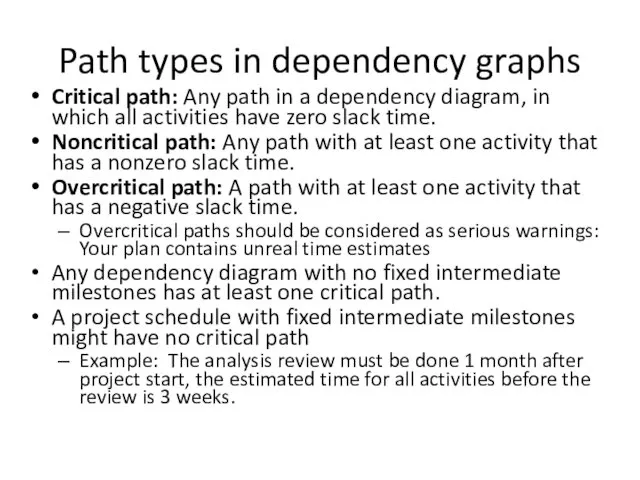
Path types in dependency graphs
Critical path: Any path in a dependency diagram, in
Path types in dependency graphs
Critical path: Any path in a dependency diagram, in
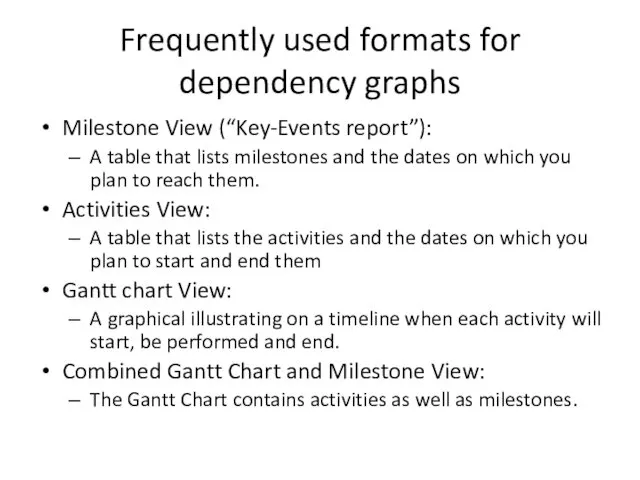
Frequently used formats for dependency graphs
Milestone View (“Key-Events report”):
A table that lists milestones
Frequently used formats for dependency graphs
Milestone View (“Key-Events report”):
A table that lists milestones
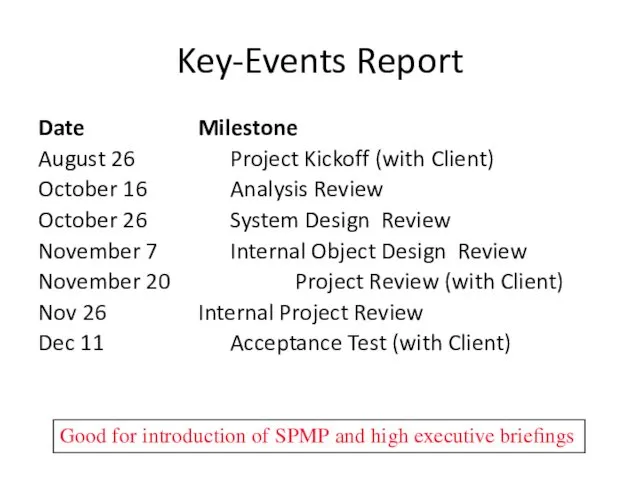
Key-Events Report
Date Milestone
August 26 Project Kickoff (with Client)
October 16 Analysis Review
October 26
Key-Events Report
Date Milestone
August 26 Project Kickoff (with Client)
October 16 Analysis Review
October 26
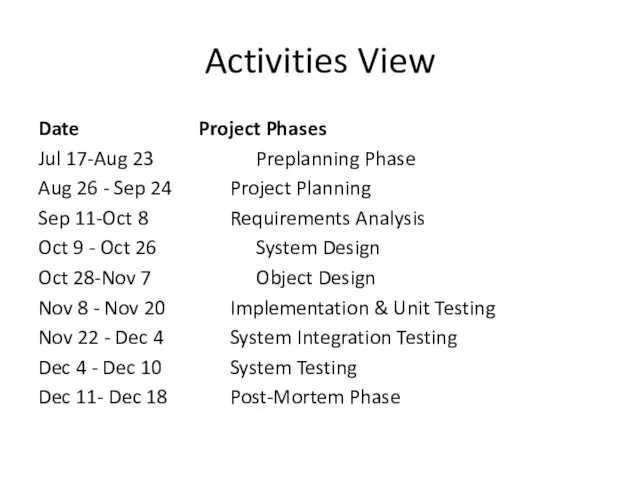
Activities View
Date Project Phases
Jul 17-Aug 23 Preplanning Phase
Aug 26 - Sep 24
Activities View
Date Project Phases
Jul 17-Aug 23 Preplanning Phase
Aug 26 - Sep 24
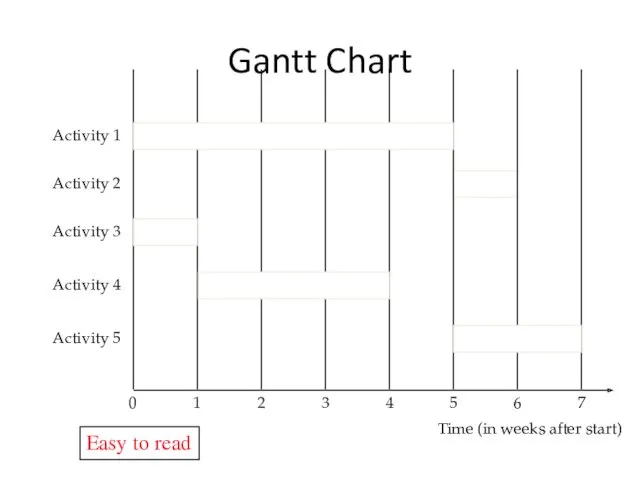
Gantt Chart
Time (in weeks after start)
Activity 1
Activity 2
1
2
3
4
5
6
7
0
Activity 3
Activity 4
Activity 5
Easy to read
Gantt Chart
Time (in weeks after start)
Activity 1
Activity 2
1
2
3
4
5
6
7
0
Activity 3
Activity 4
Activity 5
Easy to read
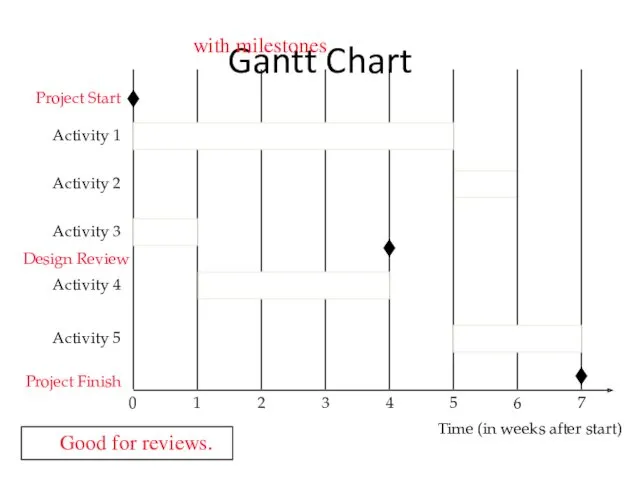
Gantt Chart
Time (in weeks after start)
Activity 1
Activity 2
1
2
3
4
5
6
7
0
Activity 3
Activity 4
Activity 5
with milestones
Good for
Gantt Chart
Time (in weeks after start)
Activity 1
Activity 2
1
2
3
4
5
6
7
0
Activity 3
Activity 4
Activity 5
with milestones
Good for
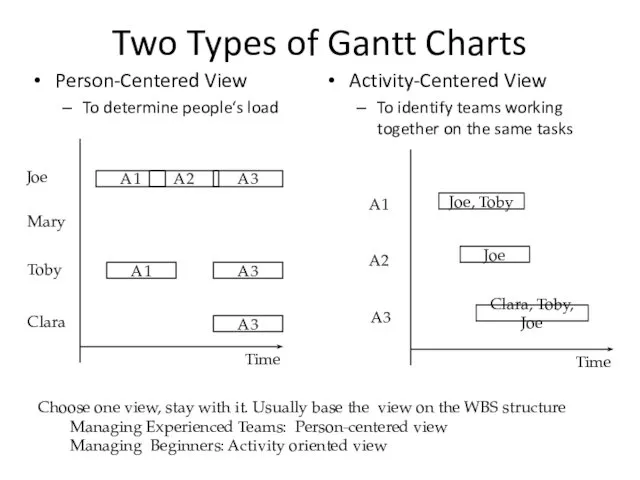
Two Types of Gantt Charts
Person-Centered View
To determine people‘s load
Activity-Centered View
To identify teams working
Two Types of Gantt Charts
Person-Centered View
To determine people‘s load
Activity-Centered View
To identify teams working
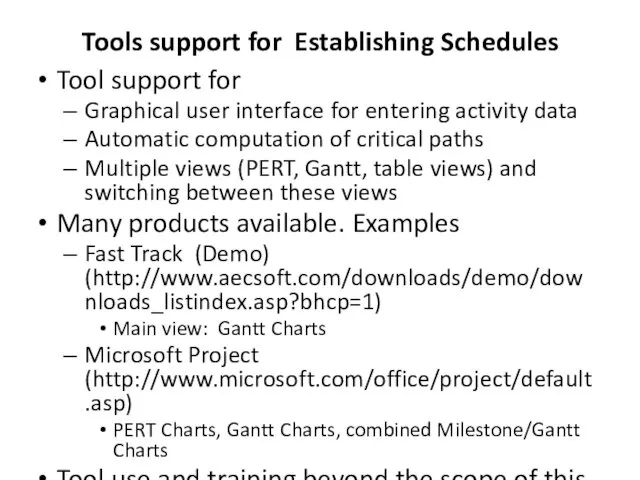
Tools support for Establishing Schedules
Tool support for
Graphical user interface for entering
Tools support for Establishing Schedules
Tool support for
Graphical user interface for entering
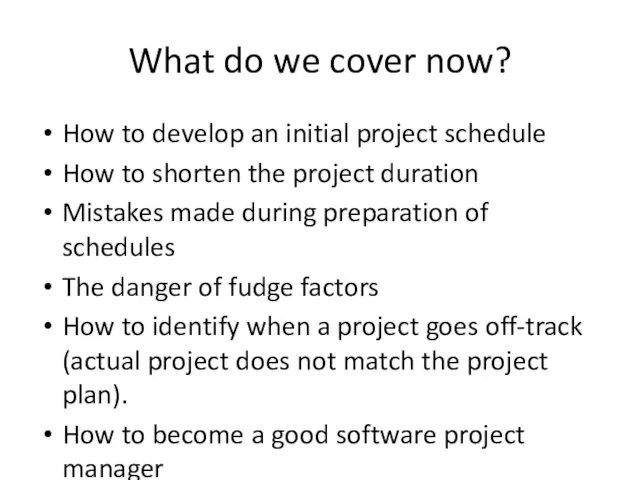
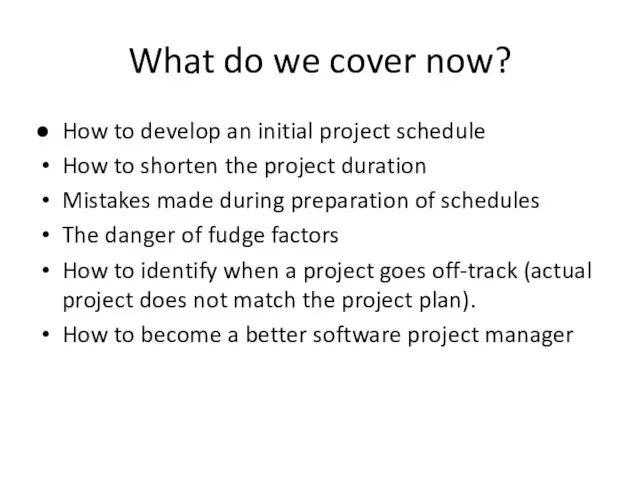
What do we cover now?
How to develop an initial project schedule
How to shorten
What do we cover now?
How to develop an initial project schedule
How to shorten
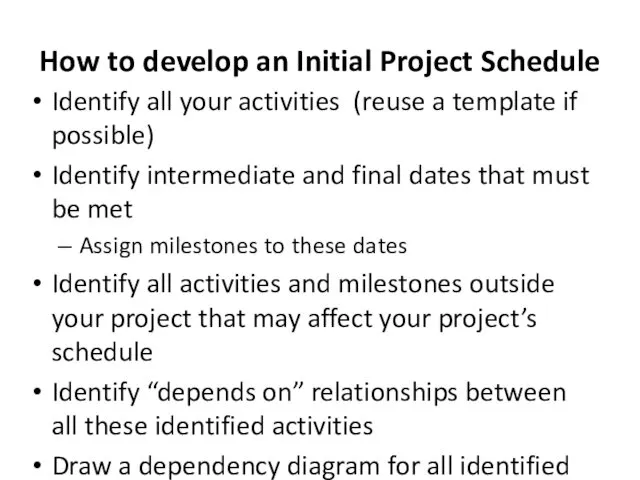
How to develop an Initial Project Schedule
Identify all your activities (reuse a template
How to develop an Initial Project Schedule
Identify all your activities (reuse a template
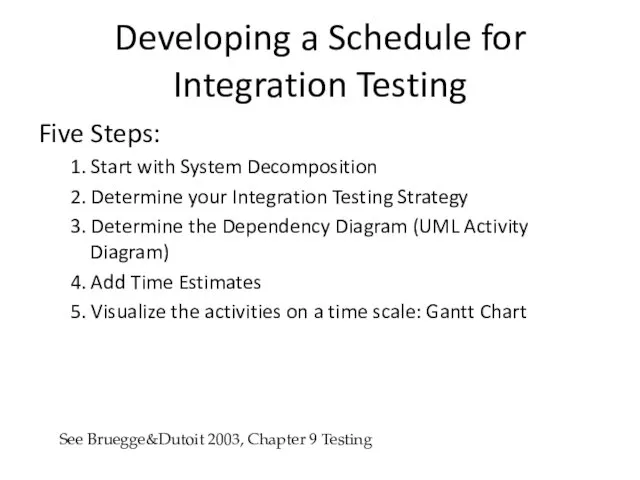
Developing a Schedule for Integration Testing
Five Steps:
1. Start with System Decomposition
2. Determine your
Developing a Schedule for Integration Testing
Five Steps:
1. Start with System Decomposition
2. Determine your
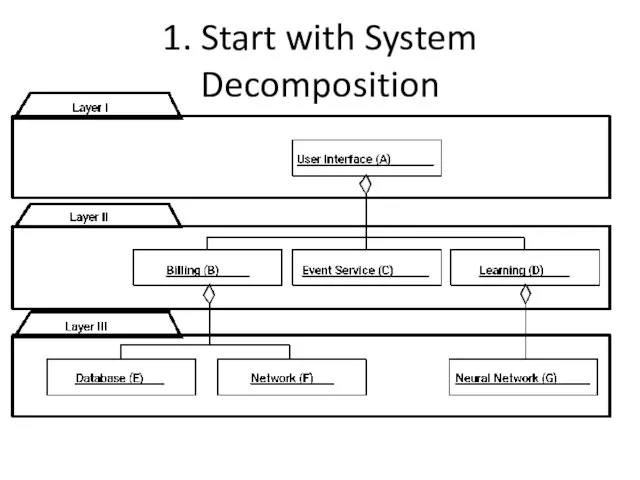
1. Start with System Decomposition
1. Start with System Decomposition
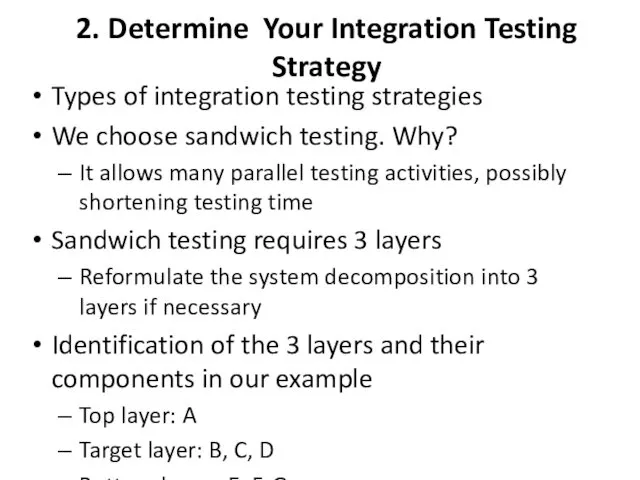
2. Determine Your Integration Testing Strategy
Types of integration testing strategies
We choose sandwich
2. Determine Your Integration Testing Strategy
Types of integration testing strategies
We choose sandwich
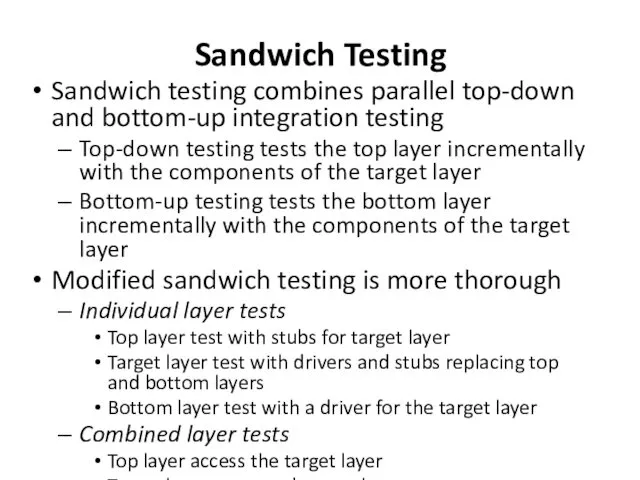
Sandwich Testing
Sandwich testing combines parallel top-down and bottom-up integration testing
Top-down testing tests the
Sandwich Testing
Sandwich testing combines parallel top-down and bottom-up integration testing
Top-down testing tests the
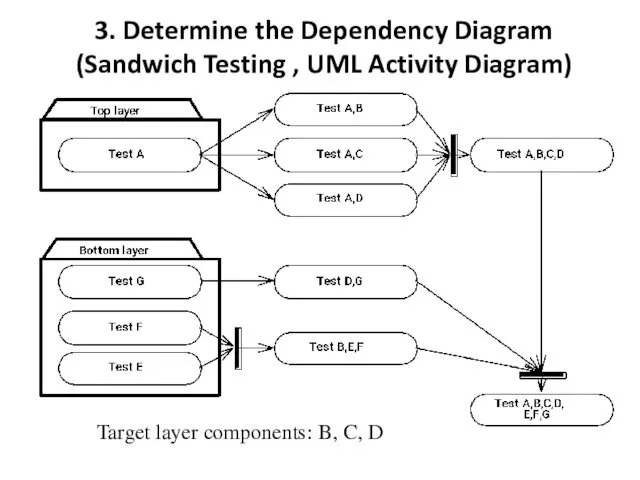
3. Determine the Dependency Diagram (Sandwich Testing , UML Activity Diagram)
Target layer components:
3. Determine the Dependency Diagram (Sandwich Testing , UML Activity Diagram)
Target layer components:
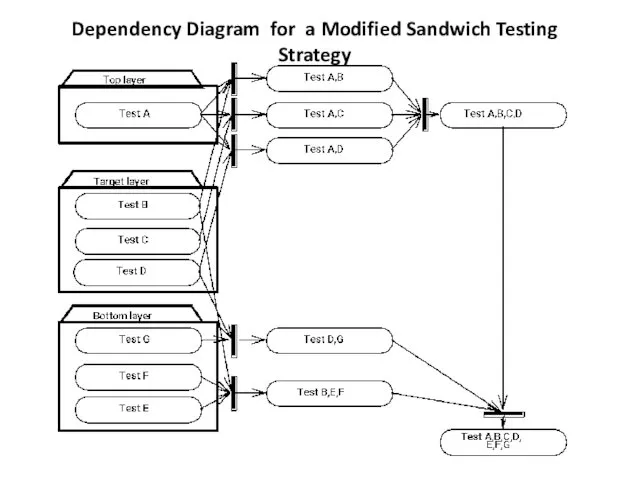
Dependency Diagram for a Modified Sandwich Testing Strategy
Dependency Diagram for a Modified Sandwich Testing Strategy
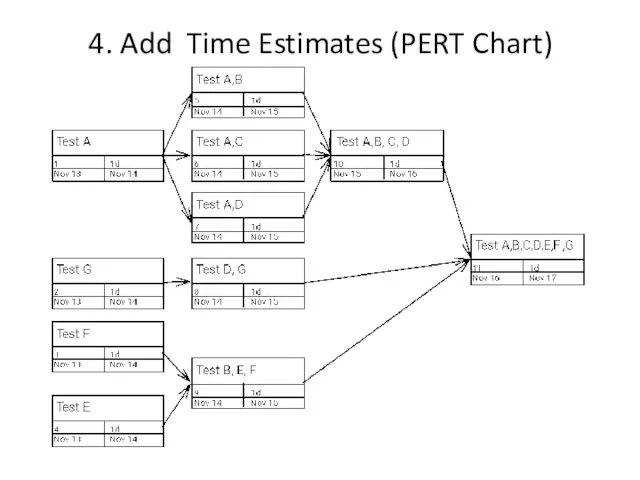
4. Add Time Estimates (PERT Chart)
4. Add Time Estimates (PERT Chart)
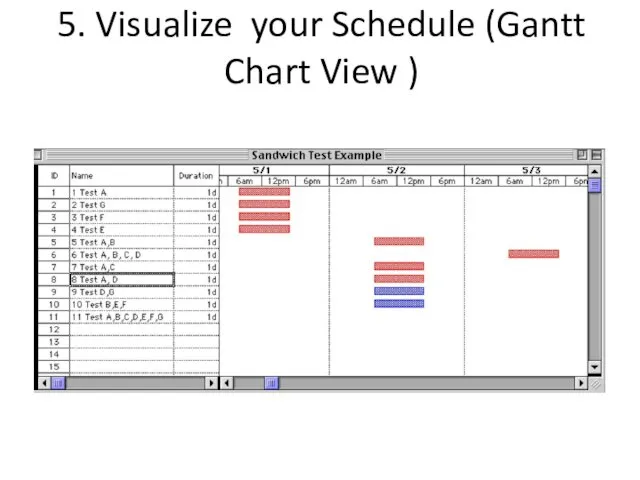
5. Visualize your Schedule (Gantt Chart View )
5. Visualize your Schedule (Gantt Chart View )
What do we cover now?
How to develop an initial project schedule
How to shorten
What do we cover now?
How to develop an initial project schedule
How to shorten
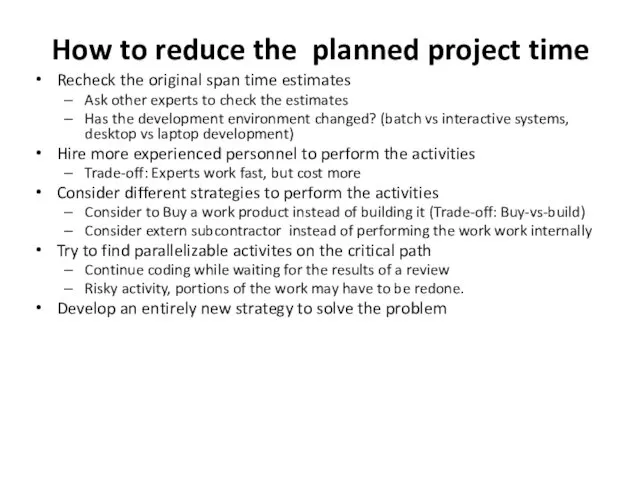
How to reduce the planned project time
Recheck the original span time estimates
Ask other
How to reduce the planned project time
Recheck the original span time estimates
Ask other
Typical Mistakes when Developing Schedules
The „Backing in“ Mistake
Using Fudge Factors
Typical Mistakes when Developing Schedules
The „Backing in“ Mistake
Using Fudge Factors
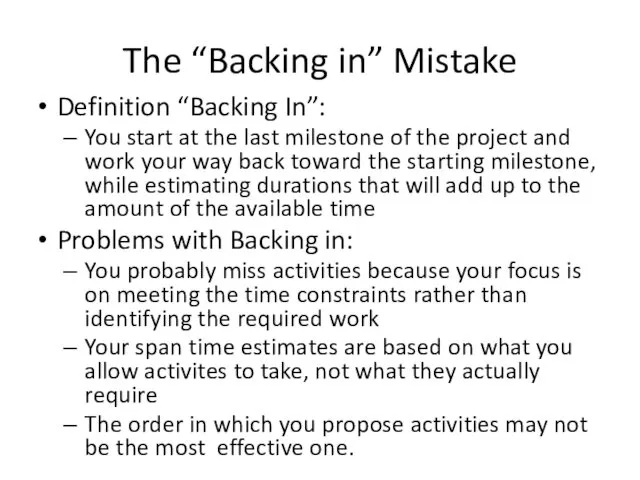
The “Backing in” Mistake
Definition “Backing In”:
You start at the last milestone of the
The “Backing in” Mistake
Definition “Backing In”:
You start at the last milestone of the
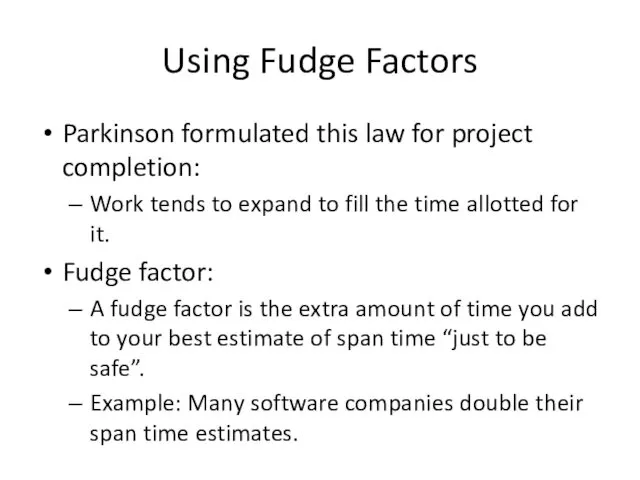
Using Fudge Factors
Parkinson formulated this law for project completion:
Work tends to expand to
Using Fudge Factors
Parkinson formulated this law for project completion:
Work tends to expand to
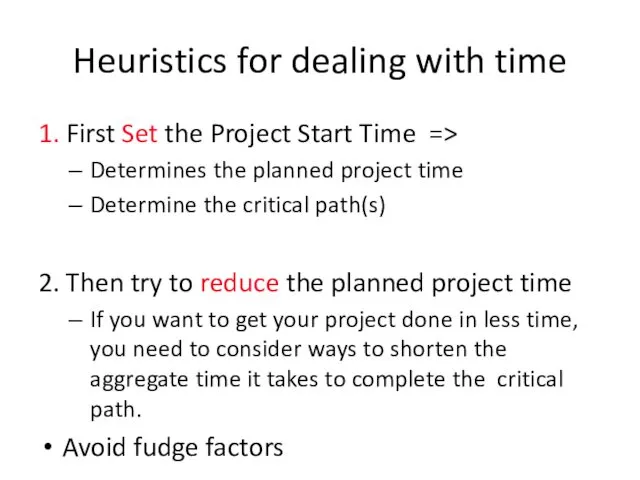
Heuristics for dealing with time
1. First Set the Project Start Time =>
Determines the
Heuristics for dealing with time
1. First Set the Project Start Time =>
Determines the
Identifying When a Project Goes Off-Track
Determine what went wrong: Why is your project
Identifying When a Project Goes Off-Track
Determine what went wrong: Why is your project
Heuristics to get a project back on track
Reaffirm your plan
Reaffirm your key people
Reaffirm
Heuristics to get a project back on track
Reaffirm your plan
Reaffirm your key people
Reaffirm
What makes a Software Project successful?
User involvement 20
Support from upper management 15
Clear Business Objectives 15
Experienced
What makes a Software Project successful?
User involvement 20
Support from upper management 15
Clear Business Objectives 15
Experienced
Become a better software project manager
End User and Management involvement 35%
Learn how
Become a better software project manager
End User and Management involvement 35%
Learn how
How to become a better project manager
Don’t assume anything
Take the time to find
How to become a better project manager
Don’t assume anything
Take the time to find
Additional Readings
[IEEE Std 1058] Standard for Software Project Management Plans
Stanley E Portny, Project
Additional Readings
[IEEE Std 1058] Standard for Software Project Management Plans
Stanley E Portny, Project
![Additional Readings [IEEE Std 1058] Standard for Software Project Management Plans Stanley E](/_ipx/f_webp&q_80&fit_contain&s_1440x1080/imagesDir/jpg/4144/slide-46.jpg)
Summary
Software Project Management Plan, Section 5:
5.1 Work Breakdown Structure
5.2 Dependencies between
Summary
Software Project Management Plan, Section 5:
5.1 Work Breakdown Structure
5.2 Dependencies between
 Основні тренди у веб-дизайні. Градієнт .Фон сторінки, виконаний в враження свіжості і унікальності
 Пазл Орленок. Создание 3D пазл
 Series Guide
 Занятие 14. Основы создания сетевых приложений на Java
 Форматирование данных в ячейках
 Динамические структуры
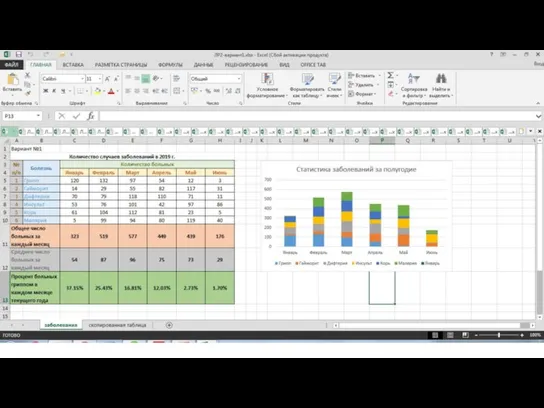 Заполнить таблицу
 Разработка Телеграм-бота и мобильного приложения для опросов Право на город
 Язык Java: история появления и развития, архитектура и основные понятия, лексика языка
 Разработка веб-сайта для научно-образовательной сети Татарстана
 Об’єкт event. Обробка подій
 Текстовые редакторы. Редактирование текстов. Печать в ОС Linux
 Database Management Systems. Lecture 10. Queries
 Периодические регистры сведений
 Таблиці стилів CSS та HTML 5
 Штриховое кодирование и маркировка товаров
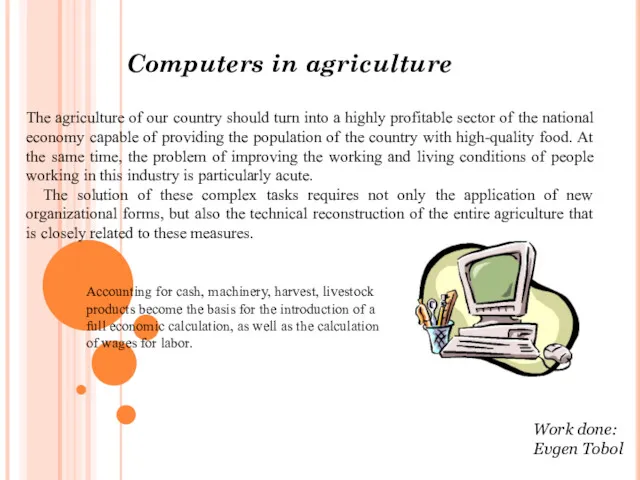 Computers in agriculture
 Указатели и массивы
 Операционная система Cisco IOS
 Мессенджеры и приложения как новый вид прессы
 Разработка АИС школы
 Evolution of Convolutional Neural Networks
 Кибер-квиз. Безопасный интернет
 Основы работы с Microsoft Configuration Manager 2012
 Конструирование программ и языки программирования
 Правила техники безопасности в компьютерном классе
 Электронные таблицы. Решение задач ОГЭ
 Региональные СМИ