Spreadsheet MS Excel. Engineering and technological calculations tasks in Microsoft Excel spreadsheet презентация
- Spreadsheet MS Excel. Engineering and technological calculations tasks in Microsoft Excel spreadsheet

Содержание
- 2. Microsoft Office Excel is a powerful program which used to create engineering and technological calculations of
- 3. The AutoSum button allows you to quickly insert the SUM function. It is located in two
- 4. MS Excel has created hundreds of functions that prevent you from having to write out complex
- 5. Functions can also be inserted by clicking on the “Insert Function” button on the “Formula” tab
- 6. 2. A drop down menu will appear, from which you can select the formula. Functions can
- 7. Worksheet functions are categorized by their functionality. Click a category to browse its functions. Or press
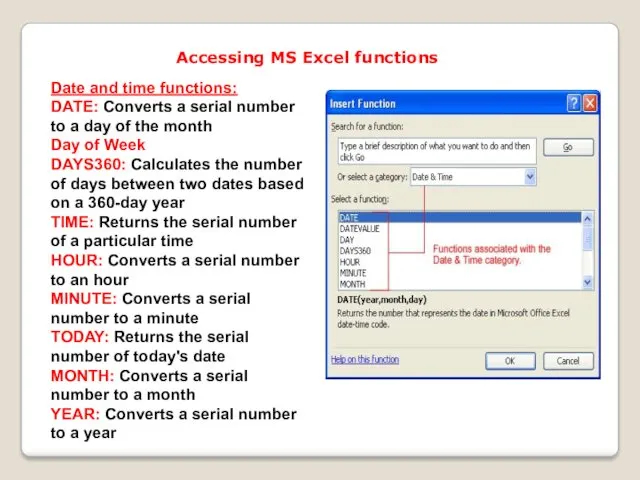
- 8. Accessing MS Excel functions Date and time functions: DATE: Converts a serial number to a day
- 9. The parts of a function: Each function has a specific order, called syntax, which must be
- 10. To calculate the sum of a range of data using AutoSum: Select the Formulas tab. Locate
- 11. Making the diagrams and charts. The Building graph A full discussion of Excel’s many charting options
- 12. Just highlight the data you wish to base your chart on (including header rows, if you
- 14. Скачать презентацию
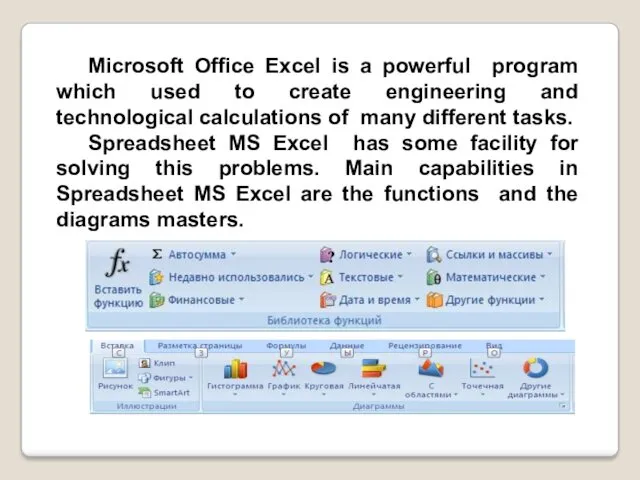
Microsoft Office Excel is a powerful program which used to create
Microsoft Office Excel is a powerful program which used to create
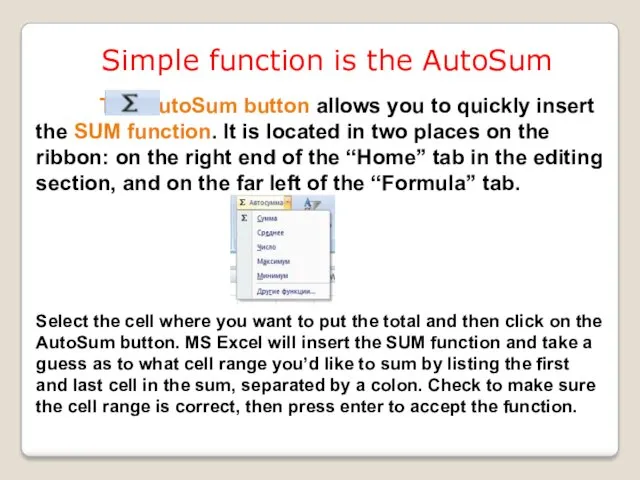
The AutoSum button allows you to quickly insert the SUM function.
The AutoSum button allows you to quickly insert the SUM function.
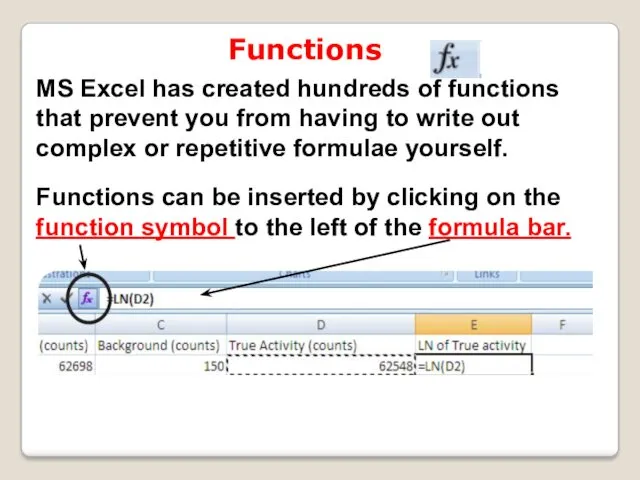
MS Excel has created hundreds of functions that prevent you from
MS Excel has created hundreds of functions that prevent you from
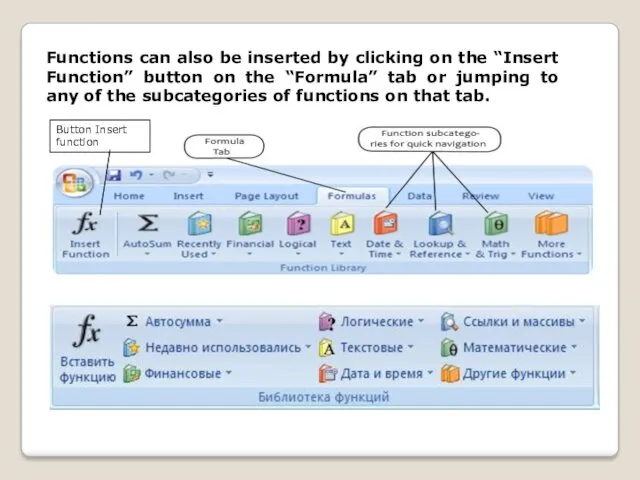
Functions can also be inserted by clicking on the “Insert Function”
Functions can also be inserted by clicking on the “Insert Function”
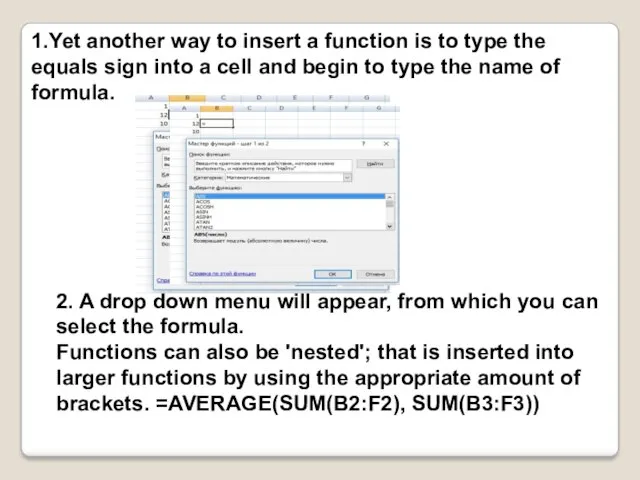
2. A drop down menu will appear, from which you can
2. A drop down menu will appear, from which you can
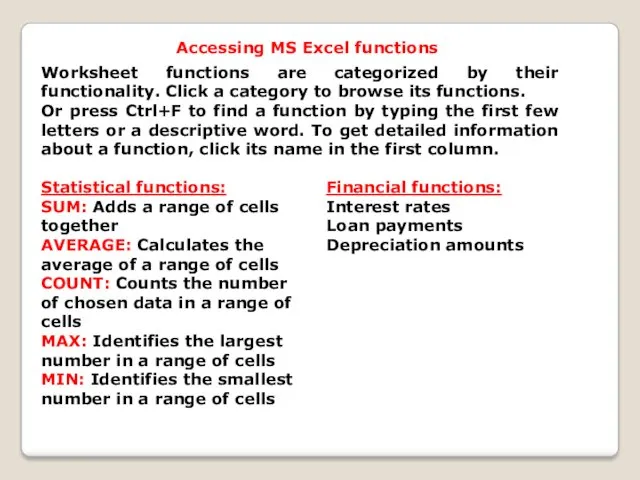
Worksheet functions are categorized by their functionality. Click a category to
Worksheet functions are categorized by their functionality. Click a category to
Accessing MS Excel functions
Date and time functions:
DATE: Converts a serial number
Accessing MS Excel functions
Date and time functions:
DATE: Converts a serial number
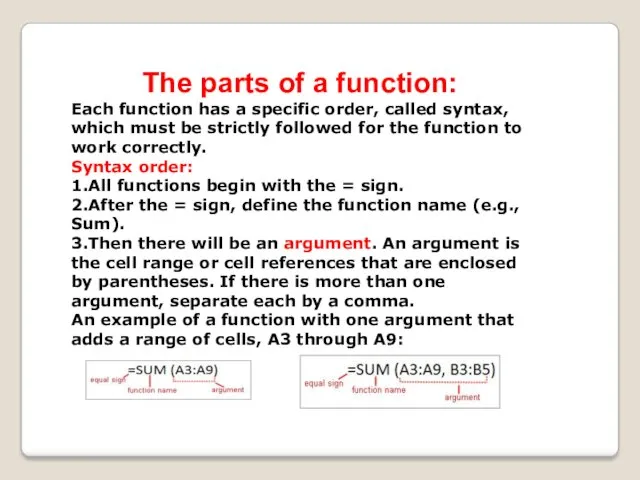
The parts of a function:
Each function has a specific order, called
The parts of a function:
Each function has a specific order, called
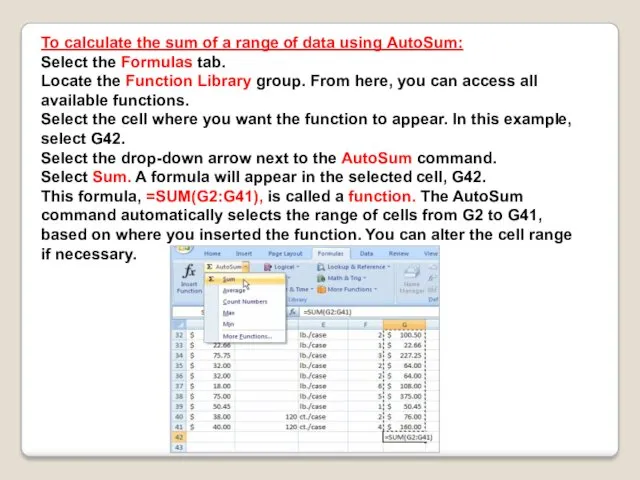
To calculate the sum of a range of data using AutoSum:
Select
To calculate the sum of a range of data using AutoSum:
Select
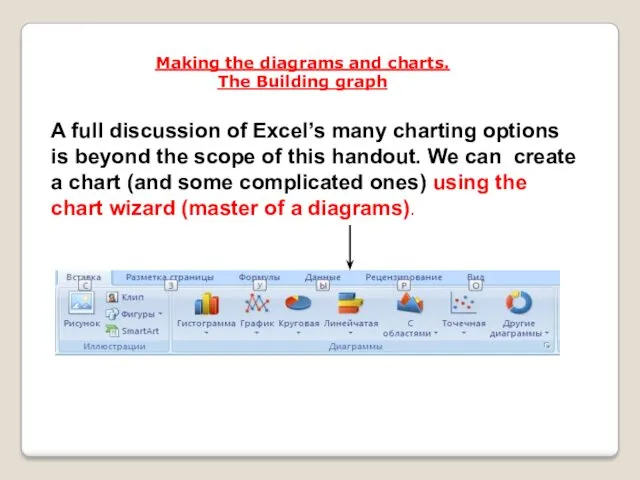
Making the diagrams and charts.
The Building graph
A full discussion of
Making the diagrams and charts.
The Building graph
A full discussion of
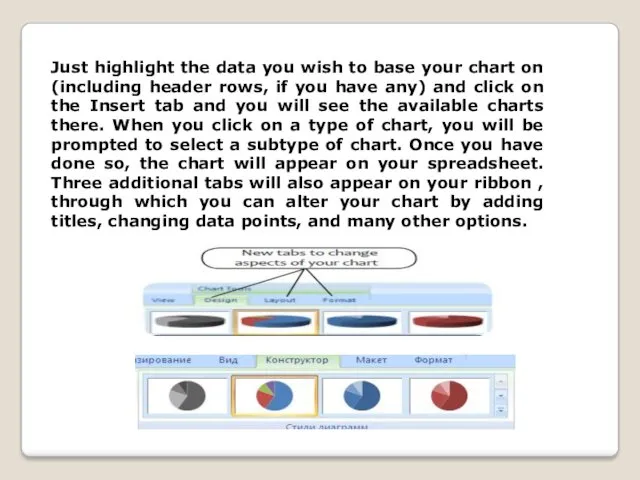
Just highlight the data you wish to base your chart on
Just highlight the data you wish to base your chart on
 Робота з елементами форми
 Системный анализ распределенной информационно-управляющей системы
 Спойлеры в Повер Поинт
 Структура программы на Си. Состав языка. (лекция 1)
 Конфигурации микросервисной архитектуры, шина данных, протоколы сообщений между сервисами. Лекция 4.1
 Создадим небольшой офис из трёх сегментов VLAN2, VLAN3, VLAN4
 Линейный алгоритм, записанный на алгоритмическом языке. Конкурс
 Системы счисления
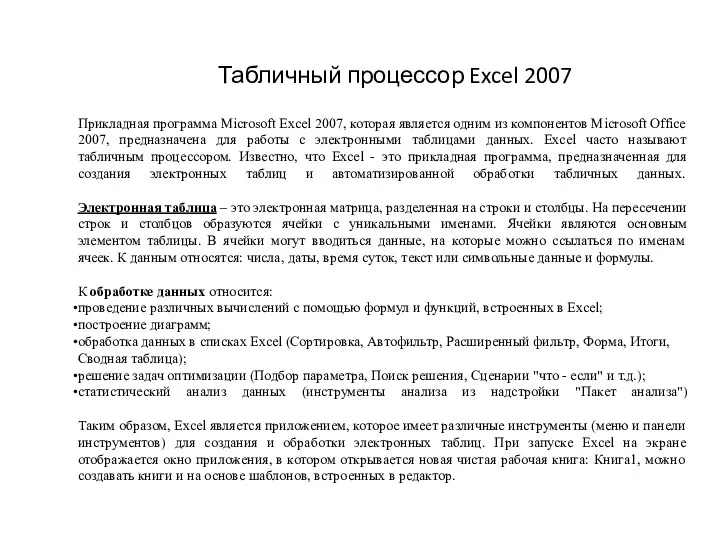 Табличный процессор Excel 2007
 Глобальная сеть Интернет
 Основи програмної інженерії (лекція 1)
 Основы применения методов системного анализа в проектировании информационных систем и формализации фармацевтической информации
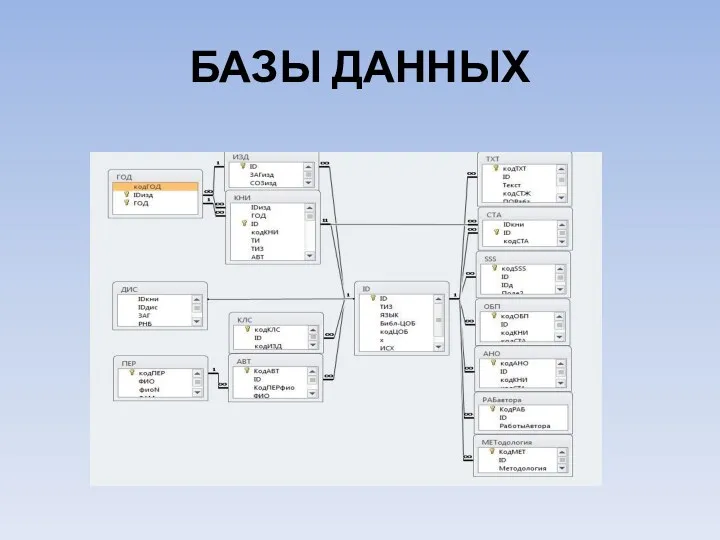 Базы данных. Основные понятия
 Як стати відомим блогером?
 Локальная компьютерная сеть
 Язык программирования Turbo Pascal 7.0. Часть 1
 Моделирование бизнес-процессов
 Урок по темеЛинейные вычислительные алгоритмы.
 Призначення й використання математичних, статистичних функцій табличного процесора
 Краткий обзор интернет-портала OCS
 Табличное решение логических задач
 Интегрированный урок Использование Excel при построении модели рационального питания
 PowerShell vs. Unix Bash
 Настройка BIOS или UEFI для последующей установки операционной системы
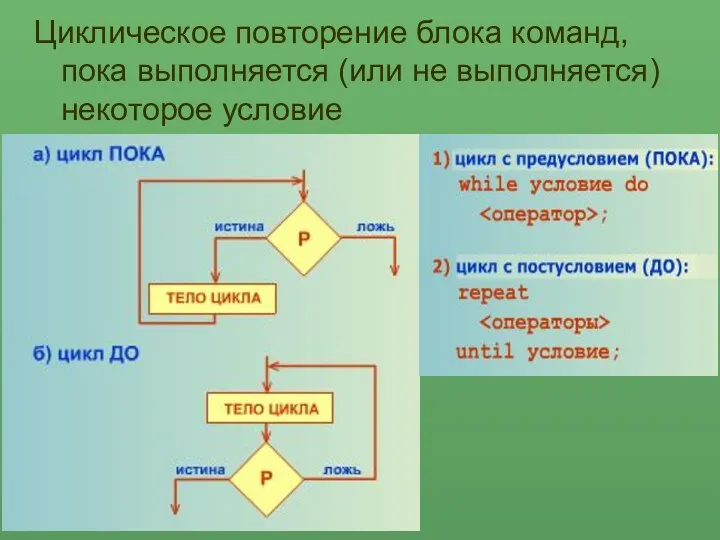 Тема: Циклы в Паскале.
 Персональный компьютер. Компьютер как универсальное устройство для работы с информацией. Информатика. 7 класс
 Модель даних “сутність-зв’язок”
 Социальные сети ПАО Сбербанк