Слайд 2
Objective
To learn how protocols and layering are represented in packets.
Слайд 3
Слайд 4
Wireshark
Wireshark -программа-анализатор трафика для компьютерных сетей Ethernet и некоторых других. Имеет графический
пользовательский интерфейс. Программа позволяет пользователю просматривать весь проходящий по сети трафик в режиме реального времени, переводя сетевую карту в неразборчивый режим (англ. promiscuous mode).
Существуют версии для большинства типов UNIX, в том числе Linux, Solaris, FreeBSD, NetBSD, OpenBSD, Mac OS X, а также для Windows.
Wireshark — это приложение, которое «знает» структуру самых различных сетевых протоколов, и поэтому позволяет разобрать сетевой пакет, отображая значение каждого поля протокола любого уровня.
Слайд 5
Wireshark: This lab uses the Wireshark software tool to capture and
examine a packet trace. A packet trace is a record of traffic at a location on the network, as if a snapshot was taken of all the bits that passed across a particular wire. The packet trace records a timestamp for each packet, along with the bits that make up the packet, from the lower-layer headers to the higher-layer contents.
Wireshark runs on most operating systems, including Windows, Mac and Linux.
It provides a graphical UI that shows the sequence of packets and the meaning of the bits when interpreted as protocol headers and data. It color-codes packets by their type, and has various ways to filter and analyze packets to let you investigate the behavior of network protocols.
Wireshark is widely used to troubleshoot networks.
You can download it from www.wireshark.org if it is not already installed on your computer.
wget / curl: This lab uses wget (Linux and Windows) and curl (Mac) to fetch web resources. wget and curl are command-line programs that let you fetch a URL. Unlike a web browser, which fetches and executes entire pages, wget and curl give you control over exactly which URLs you fetch and when you fetch them.
Under Linux, wget can be installed via your package manager. Under Windows, wget is available as a binary; look for download information on http://www.gnu.org/software/wget/. Under Mac, curl comes installed with the OS. Both have many options (try “wget --help” or “curl --help” to see) but a URL can be fetched simply with “wget URL” or “curl URL ”.
Слайд 6
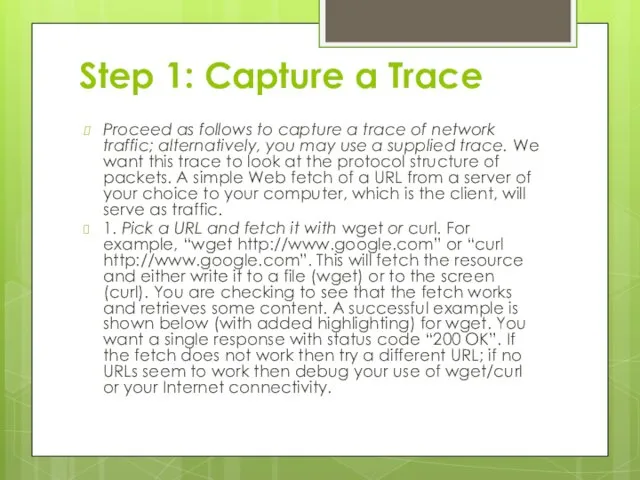
Step 1: Capture a Trace
Proceed as follows to capture a
trace of network traffic; alternatively, you may use a supplied trace. We want this trace to look at the protocol structure of packets. A simple Web fetch of a URL from a server of your choice to your computer, which is the client, will serve as traffic.
1. Pick a URL and fetch it with wget or curl. For example, “wget http://www.google.com” or “curl http://www.google.com”. This will fetch the resource and either write it to a file (wget) or to the screen (curl). You are checking to see that the fetch works and retrieves some content. A successful example is shown below (with added highlighting) for wget. You want a single response with status code “200 OK”. If the fetch does not work then try a different URL; if no URLs seem to work then debug your use of wget/curl or your Internet connectivity.
Слайд 7
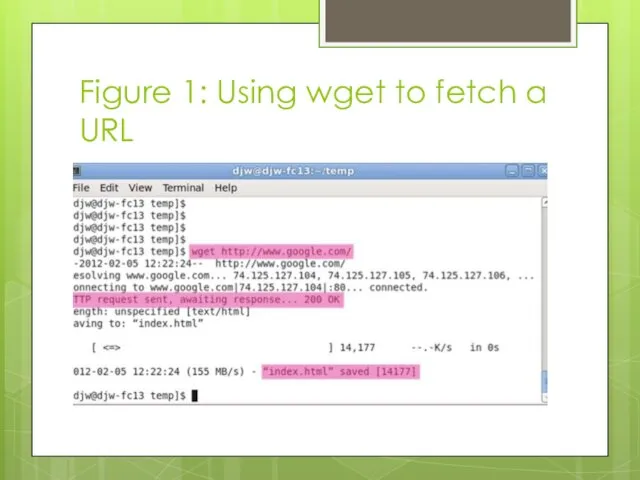
Figure 1: Using wget to fetch a URL
Слайд 8
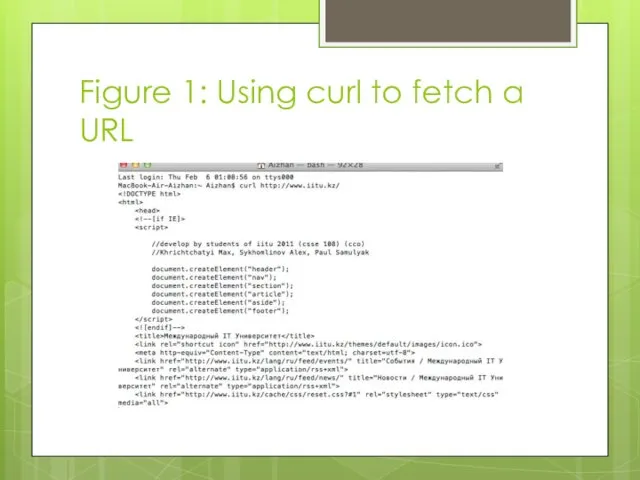
Figure 1: Using curl to fetch a URL
Слайд 9
Install Wireshark http://www.wireshark.org/download.html
Слайд 10

Слайд 11
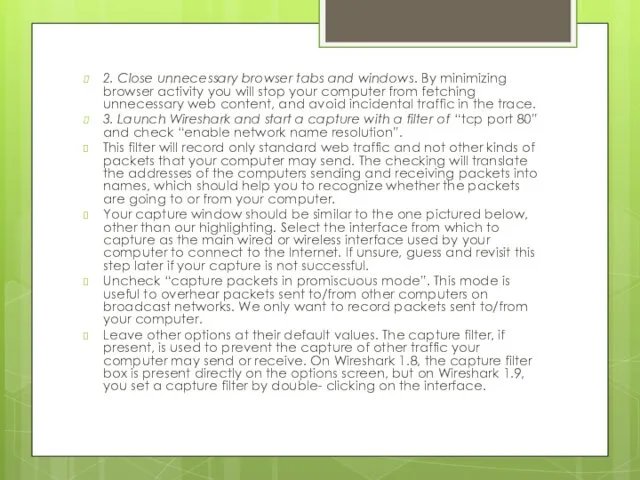
2. Close unnecessary browser tabs and windows. By minimizing browser activity
you will stop your computer from fetching unnecessary web content, and avoid incidental traffic in the trace.
3. Launch Wireshark and start a capture with a filter of “tcp port 80” and check “enable network name resolution”.
This filter will record only standard web traffic and not other kinds of packets that your computer may send. The checking will translate the addresses of the computers sending and receiving packets into names, which should help you to recognize whether the packets are going to or from your computer.
Your capture window should be similar to the one pictured below, other than our highlighting. Select the interface from which to capture as the main wired or wireless interface used by your computer to connect to the Internet. If unsure, guess and revisit this step later if your capture is not successful.
Uncheck “capture packets in promiscuous mode”. This mode is useful to overhear packets sent to/from other computers on broadcast networks. We only want to record packets sent to/from your computer.
Leave other options at their default values. The capture filter, if present, is used to prevent the capture of other traffic your computer may send or receive. On Wireshark 1.8, the capture filter box is present directly on the options screen, but on Wireshark 1.9, you set a capture filter by double- clicking on the interface.
Слайд 12
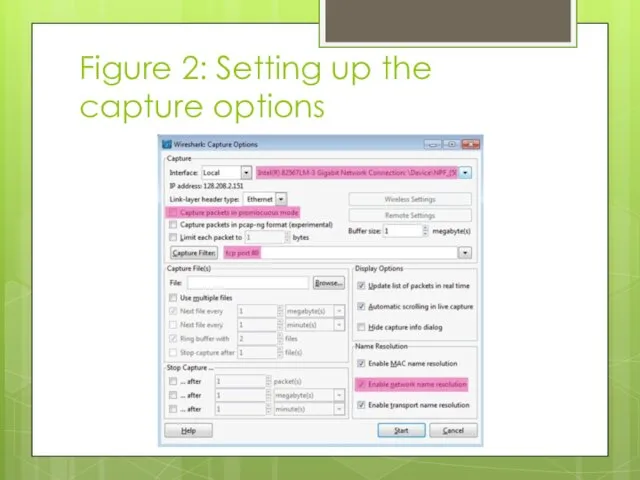
Figure 2: Setting up the capture options
Слайд 13
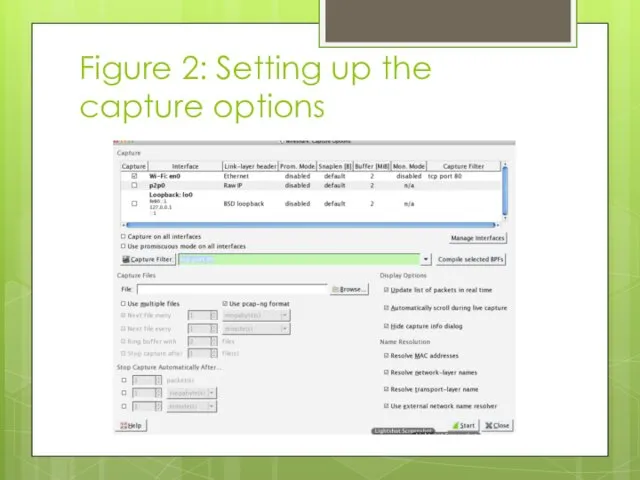
Figure 2: Setting up the capture options
Слайд 14
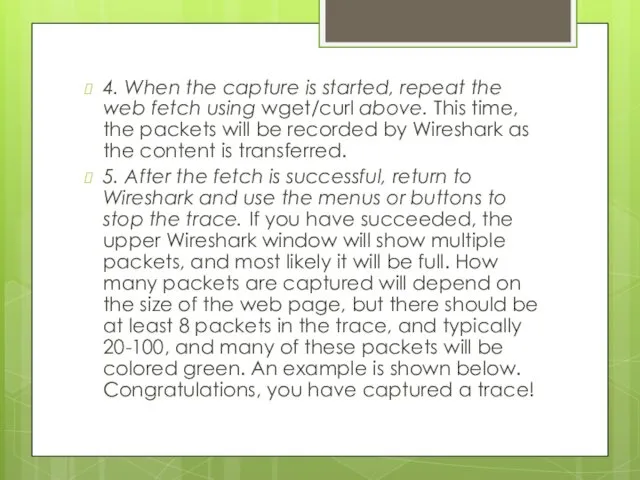
4. When the capture is started, repeat the web fetch using
wget/curl above. This time, the packets will be recorded by Wireshark as the content is transferred.
5. After the fetch is successful, return to Wireshark and use the menus or buttons to stop the trace. If you have succeeded, the upper Wireshark window will show multiple packets, and most likely it will be full. How many packets are captured will depend on the size of the web page, but there should be at least 8 packets in the trace, and typically 20-100, and many of these packets will be colored green. An example is shown below. Congratulations, you have captured a trace!
Слайд 15
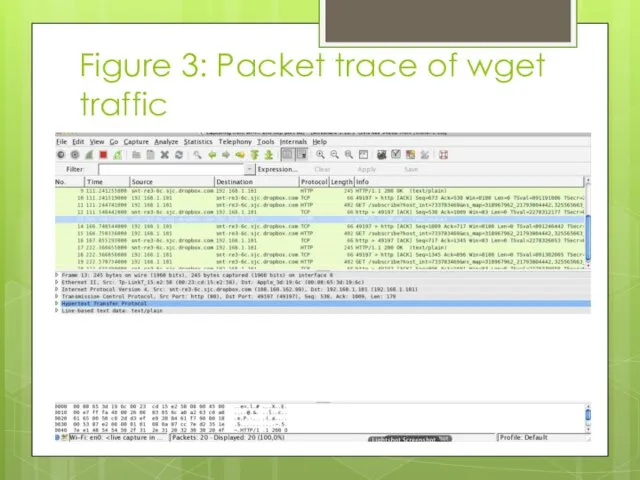
Figure 3: Packet trace of wget traffic
Слайд 16
Step 2: Inspect the Trace
Wireshark will let us select a
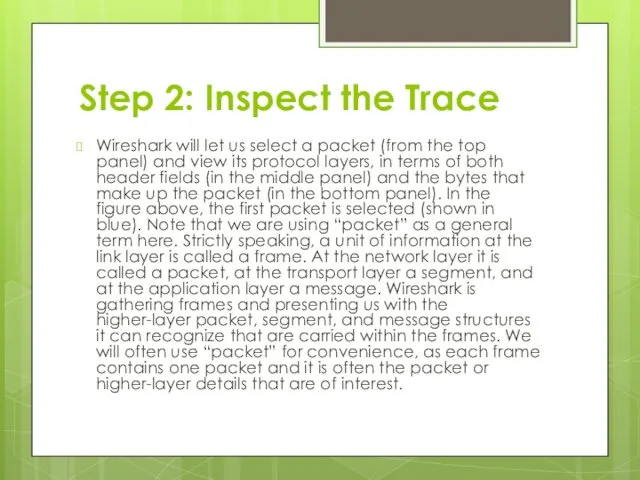
packet (from the top panel) and view its protocol layers, in terms of both header fields (in the middle panel) and the bytes that make up the packet (in the bottom panel). In the figure above, the first packet is selected (shown in blue). Note that we are using “packet” as a general term here. Strictly speaking, a unit of information at the link layer is called a frame. At the network layer it is called a packet, at the transport layer a segment, and at the application layer a message. Wireshark is gathering frames and presenting us with the higher-layer packet, segment, and message structures it can recognize that are carried within the frames. We will often use “packet” for convenience, as each frame contains one packet and it is often the packet or higher-layer details that are of interest.
Слайд 17
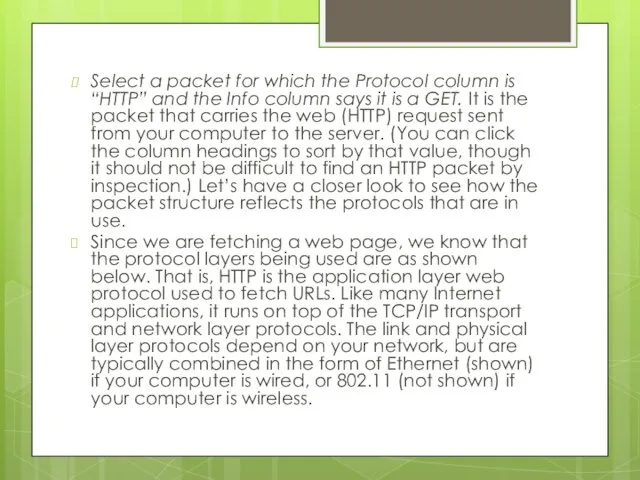
Select a packet for which the Protocol column is “HTTP” and
the Info column says it is a GET. It is the packet that carries the web (HTTP) request sent from your computer to the server. (You can click the column headings to sort by that value, though it should not be difficult to find an HTTP packet by inspection.) Let’s have a closer look to see how the packet structure reflects the protocols that are in use.
Since we are fetching a web page, we know that the protocol layers being used are as shown below. That is, HTTP is the application layer web protocol used to fetch URLs. Like many Internet applications, it runs on top of the TCP/IP transport and network layer protocols. The link and physical layer protocols depend on your network, but are typically combined in the form of Ethernet (shown) if your computer is wired, or 802.11 (not shown) if your computer is wireless.
Слайд 18
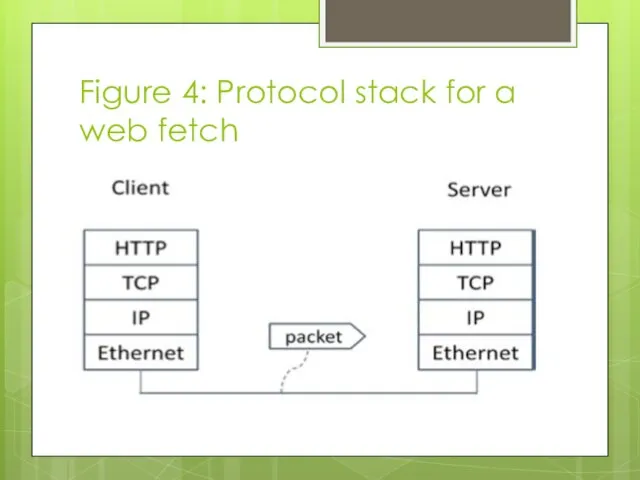
Figure 4: Protocol stack for a web fetch
Слайд 19
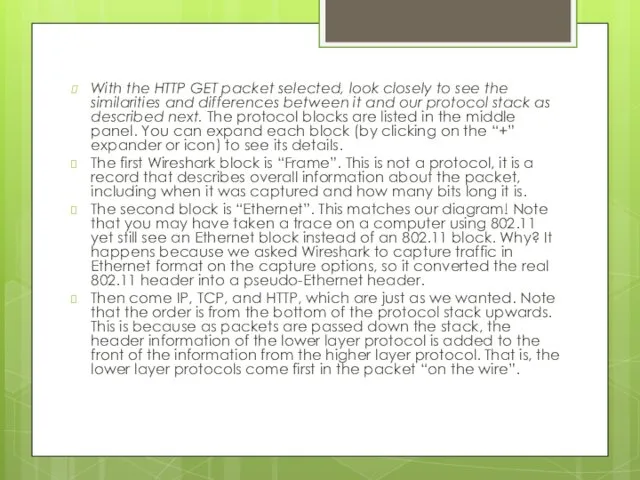
With the HTTP GET packet selected, look closely to see the
similarities and differences between it and our protocol stack as described next. The protocol blocks are listed in the middle panel. You can expand each block (by clicking on the “+” expander or icon) to see its details.
The first Wireshark block is “Frame”. This is not a protocol, it is a record that describes overall information about the packet, including when it was captured and how many bits long it is.
The second block is “Ethernet”. This matches our diagram! Note that you may have taken a trace on a computer using 802.11 yet still see an Ethernet block instead of an 802.11 block. Why? It happens because we asked Wireshark to capture traffic in Ethernet format on the capture options, so it converted the real 802.11 header into a pseudo-Ethernet header.
Then come IP, TCP, and HTTP, which are just as we wanted. Note that the order is from the bottom of the protocol stack upwards. This is because as packets are passed down the stack, the header information of the lower layer protocol is added to the front of the information from the higher layer protocol. That is, the lower layer protocols come first in the packet “on the wire”.
Слайд 20
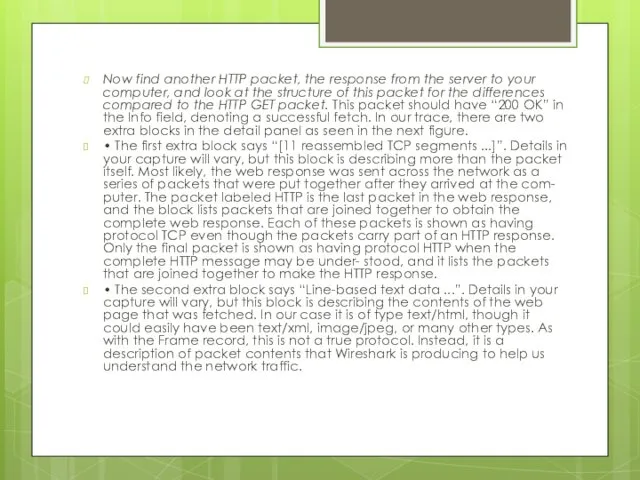
Now find another HTTP packet, the response from the server to
your computer, and look at the structure of this packet for the differences compared to the HTTP GET packet. This packet should have “200 OK” in the Info field, denoting a successful fetch. In our trace, there are two extra blocks in the detail panel as seen in the next figure.
• The first extra block says “[11 reassembled TCP segments ...]”. Details in your capture will vary, but this block is describing more than the packet itself. Most likely, the web response was sent across the network as a series of packets that were put together after they arrived at the com- puter. The packet labeled HTTP is the last packet in the web response, and the block lists packets that are joined together to obtain the complete web response. Each of these packets is shown as having protocol TCP even though the packets carry part of an HTTP response. Only the final packet is shown as having protocol HTTP when the complete HTTP message may be under- stood, and it lists the packets that are joined together to make the HTTP response.
• The second extra block says “Line-based text data ...”. Details in your capture will vary, but this block is describing the contents of the web page that was fetched. In our case it is of type text/html, though it could easily have been text/xml, image/jpeg, or many other types. As with the Frame record, this is not a true protocol. Instead, it is a description of packet contents that Wireshark is producing to help us understand the network traffic.
Слайд 21
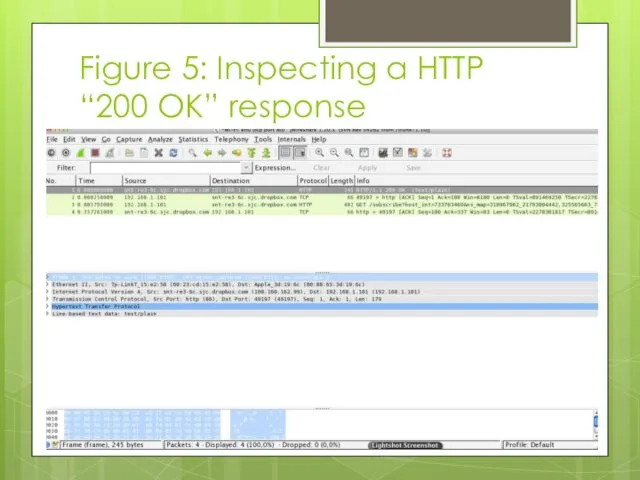
Figure 5: Inspecting a HTTP “200 OK” response
Слайд 22
Step 3: Packet Structure
To show your understanding of packet structure,
draw a figure of an HTTP GET packet that shows the position and size in bytes of the TCP, IP and Ethernet protocol headers. Your figure can simply show the overall packet as a long, thin rectangle. Leftmost elements are the first sent on the wire. On this drawing, show the range of the Ethernet header and the Ethernet payload that IP passed to Ethernet to send over the network. To show the nesting structure of protocol layers, note the range of the IP header and the IP payload. You may have questions about the fields in each protocol as you look at them. We will explore these protocols and fields in detail in future labs.
To work out sizes, observe that when you click on a protocol block in the middle panel (the block itself, not the “+” expander) then Wireshark will highlight the bytes it corresponds to in the packet in the lower panel and display the length at the bottom of the window. For instance, clicking on the IP version 4 header of a packet in our trace shows us that the length is 20 bytes. (Your trace will be different if it is IPv6, and may be different even with IPv4 depending on various options.) You may also use the overall packet size shown in the Length column or Frame detail block.
Turn-in: Hand in your packet drawing.

 Память компьютера
 Основные этапы развития вычислительной техники
 Определение количества информации
 Директивы
 Разработка приложения для изучения русского языка, как иностранного на базе корпуса политической журналистики
 Использование электронной доски для развития творческих способностей учащихся начальной школы. Часть 2.
 Центральная библиотека имени Н.А. Некрасова, Николаевский район. Продвижение в социальных сетях
 Сравнение мобильных операционных систем iOS и Android
 Создание мобильной версии Интернет-сайта
 Платформа Я в АГРО от Россельхозбанка
 Writing Linux FS
 BPwin пакетімен логикалық моделдерді құру әдістері
 Паралельні обчислення на суперкомп’ютері СКІТ
 Кибербезопасность. Операционная безопасность
 Информационные технологии в преподавании учебной дисциплины Информатика и ИКТ в условиях информатизации и автоматизации технологических процессов
 Презентация. Представление о Power Point
 Почтовые клиенты. Стегоконтейнеры
 Разработка игры Битва танков
 Основы научных исследований. Поиск научных статей и монографий в базе данных IEEE Xplore. Тема 5
 Графический редактор Paint
 Ежемесячная газета Ритм. Сентябрь 2016
 Безопасный Интернет
 Hardware Systems
 Quick Manual (Q&A)
 Хранение, отбор и сортировка информации в базах данных. Лекция 19
 Programming languages
 Моделирование как метод познания. Модель и Моделирование
 Тестовые задания