- Marketing Research

Содержание
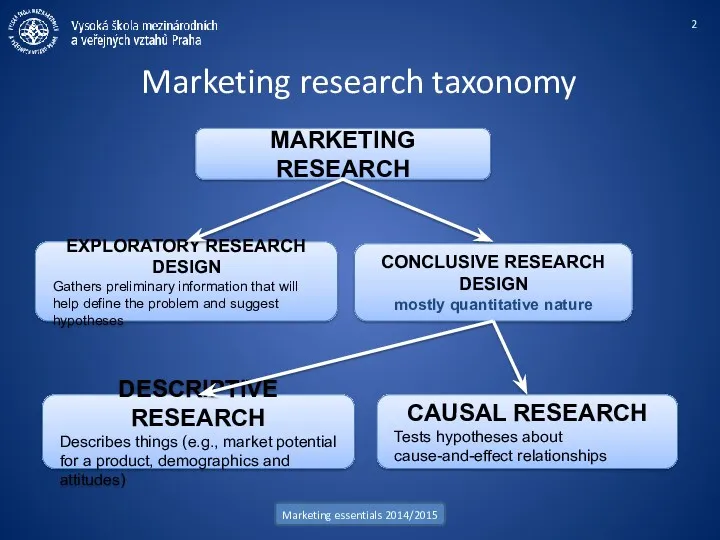
- 2. Marketing research taxonomy Marketing essentials 2014/2015 MARKETING RESEARCH EXPLORATORY RESEARCH DESIGN Gathers preliminary information that will
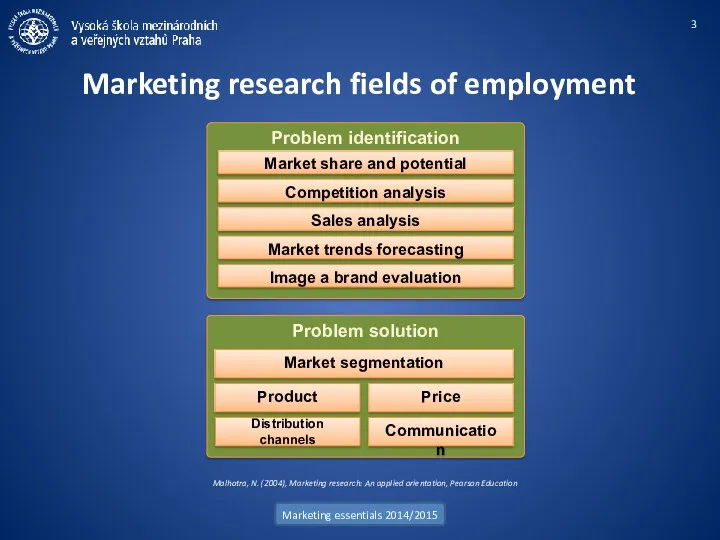
- 3. Problem identification Marketing research fields of employment Marketing essentials 2014/2015 Market share and potential Problem solution
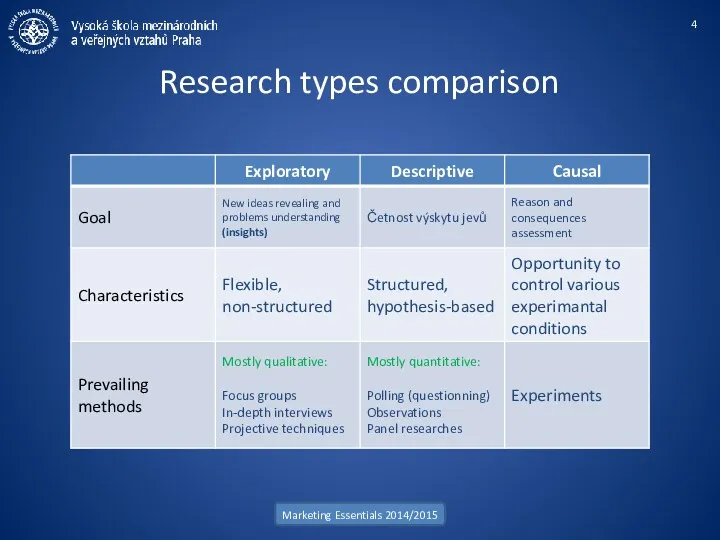
- 4. Research types comparison Marketing Essentials 2014/2015
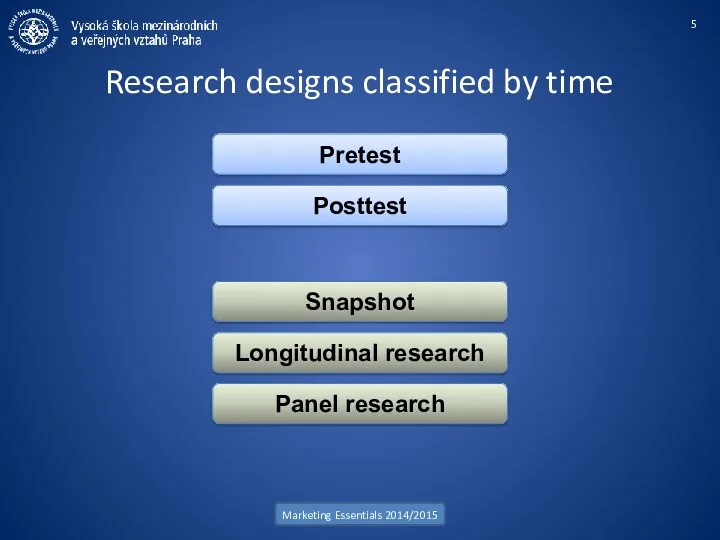
- 5. Research designs classified by time Marketing Essentials 2014/2015 Pretest Posttest Snapshot Longitudinal research Panel research
- 6. Kinds of informations in marketing research Marketing Essentials 2014/2015 INTERNAL INFORMATONS Retrieved inside the company, no
- 7. Information sources in marketing research Marketing Essentials 2014/2015 PRIMARY INFORMATIONS INTERNAL Company employees Company R&D department
- 8. Measurements in marketing research Marketing Essentials 2014/2015 Interval scale Possesses assignment, order and distance properties. It
- 9. INFORMATION SYSTEM Marketing information system Marketing Essentials 2014/2015 DATA RECOVERY INTERNAL RECORDS INTELLIGENCE SYSTEM MARKETING RESEARCH
- 10. Marketing research process Marketing Essentials 2014/2015 Result Conclusive research Hypothesis development Exploratory research Problem or opportunity
- 11. Implementing the research plan Marketing research process step by step Marketing Essentials 2014/2015 Developing the research
- 12. Exploratory research design Marketing Essentials 2014/2015 Projective techniques Focus groups In-depth interviews
- 13. Developing the Research Plan Marketing Essentials 2014/2015 Includes: Determining the exact information needed. Developing a plan
- 14. inhouse Research plan and implementation Marketing Essentials 2014/2015 Previous research summary Carryout exploratory research Define the
- 15. Review the business situation Marketing Essentials 2014/2015 We start the process with a review of the
- 16. Defining the issues or problem Marketing Essentials 2014/2015 Problems can generally be solved in many ways.
- 17. Carry out exploratory research Marketing Essentials 2014/2015 This stage is designed to clarify the research problem.
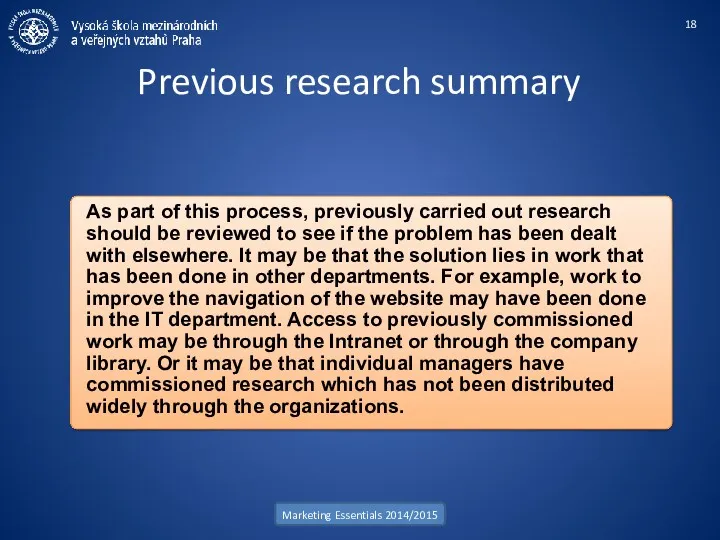
- 18. Previous research summary Marketing Essentials 2014/2015 As part of this process, previously carried out research should
- 19. Internal research Marketing Essentials 2014/2015 Internal research will involve the use of the MIS and the
- 20. Gathering Secondary Data Marketing Essentials 2014/2015 Information that already exists somewhere: Internal databases Commercial data services
- 21. Primary research Information gathering errors Data Collecting (fieldwork) Základy marketingu 2011/2012 Sampling errors Since the sample
- 22. Completeness and readability check Data input, coding and editing Marketing Essentials 2014/2015 All questionnaries are checked,
- 23. Stevens's typology Data Analysis Marketing Essentials 2014/2015 Nominal scale The nominal type differentiates between items or
- 24. Findings and recommendations presentation Marketing Essentials 2014/2015 Don’t confuse presenting data with presenting your evaluation findings
- 25. List brokers – Suppliers of lists of contacts for marketing purposes. They may include names and
- 26. Particular Research Services Providers Marketing Essentials 2014/2015
- 27. Quantitative methods Marketing Research Methods Marketing Essentials 2014/2015 Observing Questionning Experimenting Qualitative methods In-depth Interview Focus
- 28. Advantages: Observing Marketing Essentials 2014/2015 Does not rely on object‘s cooperation Does not influence object observed
- 29. Covert observational research Three Approaches of Observational Research Marketing Essentials 2014/2015 Nonstandardized Semi-standardized Standardized Overt observational
- 30. Personal observation Marketing Essentials 2014/2015 observing products in use to detect usage patterns and problems observing
- 31. Trace Analysis Marketing Essentials 2014/2015 credit card records computer cookie records garbology - looking for traces
- 32. Mechanical observation Marketing Essentials 2014/2015 eye-tracking analysis while subjects watch advertisements oculometers - what the subject
- 33. Observation Biases Marketing Essentials 2014/2015 Human perception occurs by a complex, unconscious process of abstraction, in
- 34. Survey methodology Marketing Essentials 2014/2015 Personal surveys Instant feedback Visual aids best rate of return ------------------------------------------------------------------------------------
- 35. Sampling Marketing Essentials 2014/2015 Population Census Sample survey Probability sampling Non-probability sampling Convenience Samples Judgement Samples
- 36. Quantitative research examples Marketing Essentials 2014/2015 Panel survey Omnibus survey Purchase diary panel Brand awareness Brand
- 37. Questionnaire design Marketing Essentials 2014/2015 questions: Open-ended questions Semi-open questions Closed-ended questions Verbal judgment scale Graphical
- 38. Experimenting Základy marketingu 2011/2012 Internal validity Inferences are said to possess internal validity if a causal
- 39. Explorative research Marketing Essentials 2014/2015 In-depth interview Exploration scheme Funnel technique Expected attitude x nonconforming attitude
- 40. Market research Marketing Essentials 2014/2015 Market extent Available market Market characteristics Market potential Usable market Qualified
- 41. Market research flowchart Marketing Essentials 2014/2015
- 42. Demand forecasting Marketing Essentials 2014/2015 Qualitative techniques Timeline extrapolation Buyers intentions research Causal modelling Delphi method
- 43. Communication research Marketing Essentials 2014/2015 Target groups Velikost CS Image značky Penetrace značky Segmentační proměnné Mediální
- 44. Communication Research Základy marketingu 2011/2012 Preliminary tests ■ Internal evaluation ■ Communication Effects Post-tests ■ Exposure
- 45. Research deployment during campaign Základy marketingu 2011/2012 Advrtising strategy Goals and target groups Concept Creative Media
- 46. Strategic communication research Marketing Essentials 2014/2015 product ■ strenghts & weaknesses ■ USP ■ persuasive arguments
- 47. Communication audit Marketing Essentials 2014/2015 ■ content analysis ■ delphi method ■ own communication ■ competitors
- 48. Campaign pre-testing Marketing Essentials 2014/2015 Testing objectives ■ adequate stimuli ■ communication effects estimation ■ frekvency
- 49. Pre-testing limitations Marketing Essentials 2014/2015 ■ subjective evaluation ■ unnatural conditions ■ consumer jury effect ■
- 50. Advertising Campaign Evaluation Marketing Essentials 2014/2015 Post testing techniques Exposure : ■ GRP, reach, OTS measured
- 51. Post-testing limitations Marketing Essentials 2014/2015 ■ isolated effect of single ad spot ■ selective memory ■
- 52. Communication campaign evaluation Marketing Essentials 2014/2015 Měření TOMA Měření postoje Měření image Měření nákupního záměru Trackingové
- 53. Communication campaign evaluation Marketing Essentials 2014/2015 Questions to ask: • Have you heard of ______ campaign?
- 55. Скачать презентацию
Marketing research taxonomy
Marketing essentials 2014/2015
MARKETING RESEARCH
EXPLORATORY RESEARCH DESIGN
Gathers preliminary information that
Marketing research taxonomy
Marketing essentials 2014/2015
MARKETING RESEARCH
EXPLORATORY RESEARCH DESIGN
Gathers preliminary information that
Problem identification
Marketing research fields of employment
Marketing essentials 2014/2015
Market share and potential
Problem
Problem identification
Marketing research fields of employment
Marketing essentials 2014/2015
Market share and potential
Problem
Research types comparison
Marketing Essentials 2014/2015
Research types comparison
Marketing Essentials 2014/2015
Research designs classified by time
Marketing Essentials 2014/2015
Pretest
Posttest
Snapshot
Longitudinal research
Panel research
Research designs classified by time
Marketing Essentials 2014/2015
Pretest
Posttest
Snapshot
Longitudinal research
Panel research
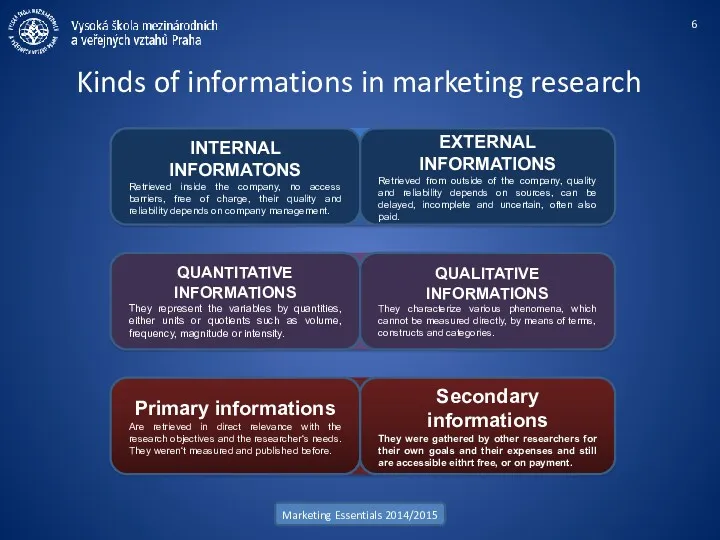
Kinds of informations in marketing research
Marketing Essentials 2014/2015
INTERNAL INFORMATONS
Retrieved inside the
Kinds of informations in marketing research
Marketing Essentials 2014/2015
INTERNAL INFORMATONS
Retrieved inside the
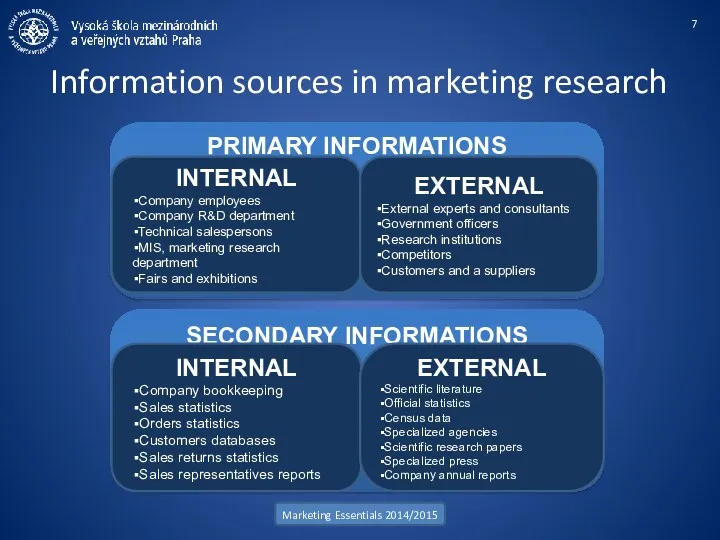
Information sources in marketing research
Marketing Essentials 2014/2015
PRIMARY INFORMATIONS
INTERNAL
Company employees
Company R&D department
Technical
Information sources in marketing research
Marketing Essentials 2014/2015
PRIMARY INFORMATIONS
INTERNAL
Company employees
Company R&D department
Technical
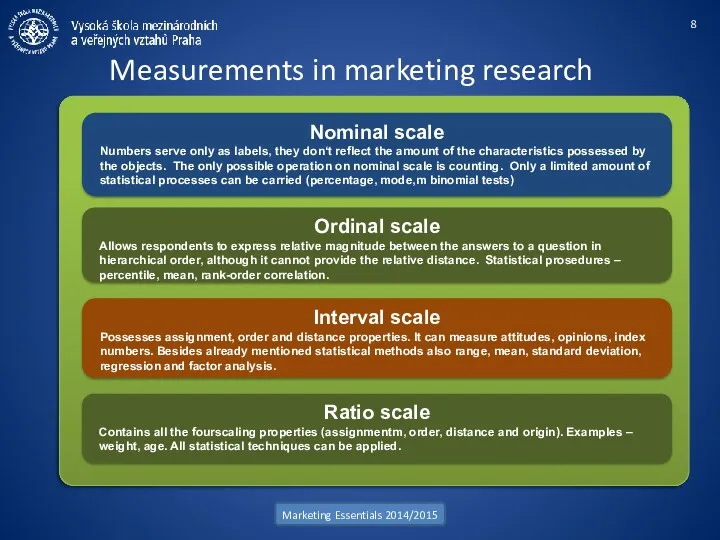
Measurements in marketing research
Marketing Essentials 2014/2015
Interval scale
Possesses assignment, order and distance
Measurements in marketing research
Marketing Essentials 2014/2015
Interval scale
Possesses assignment, order and distance
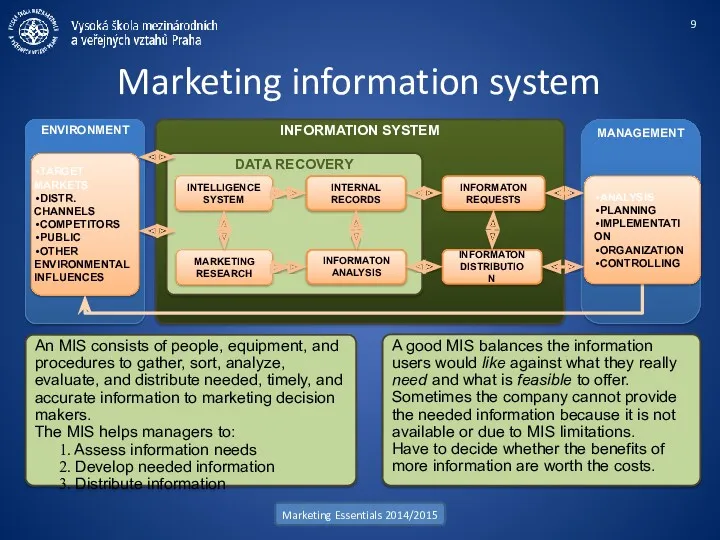
INFORMATION SYSTEM
Marketing information system
Marketing Essentials 2014/2015
DATA RECOVERY
INTERNAL RECORDS
INTELLIGENCE SYSTEM
MARKETING RESEARCH
INFORMATON ANALYSIS
INFORMATON
INFORMATION SYSTEM
Marketing information system
Marketing Essentials 2014/2015
DATA RECOVERY
INTERNAL RECORDS
INTELLIGENCE SYSTEM
MARKETING RESEARCH
INFORMATON ANALYSIS
INFORMATON
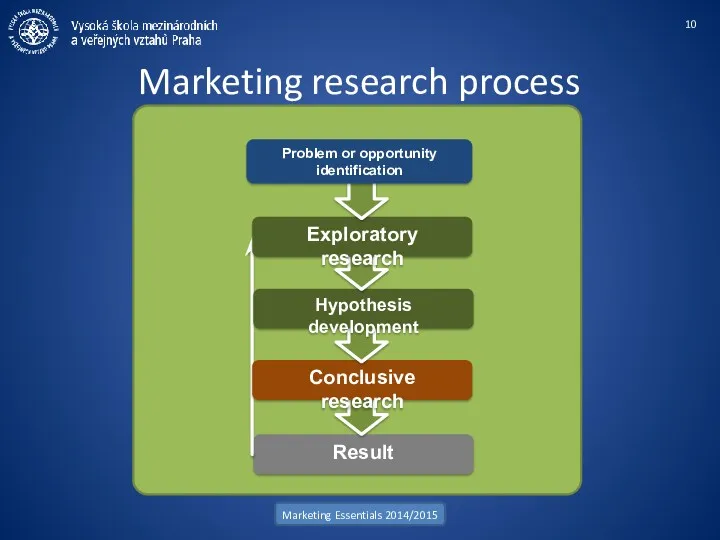
Marketing research process
Marketing Essentials 2014/2015
Result
Conclusive research
Hypothesis development
Exploratory research
Problem or opportunity identification
Marketing research process
Marketing Essentials 2014/2015
Result
Conclusive research
Hypothesis development
Exploratory research
Problem or opportunity identification
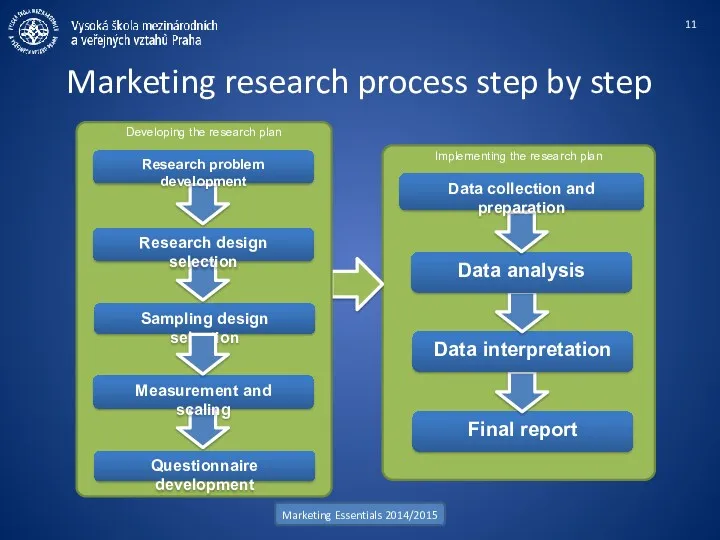
Implementing the research plan
Marketing research process step by step
Marketing Essentials 2014/2015
Developing
Implementing the research plan
Marketing research process step by step
Marketing Essentials 2014/2015
Developing
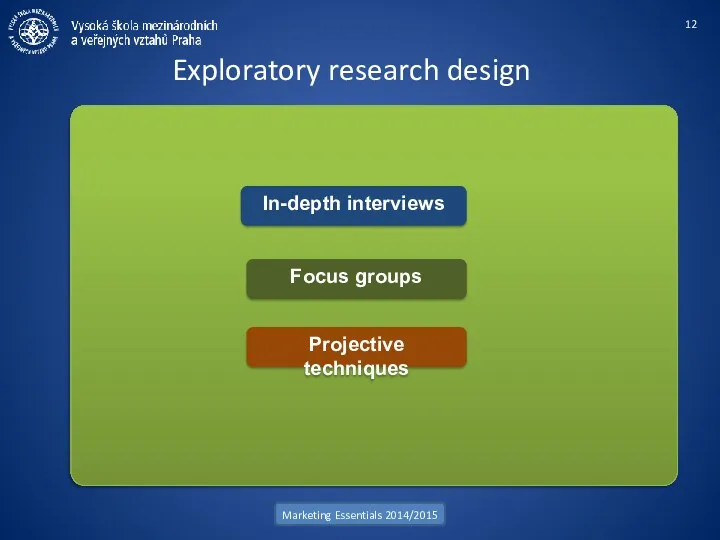
Exploratory research design
Marketing Essentials 2014/2015
Projective techniques
Focus groups
In-depth interviews
Exploratory research design
Marketing Essentials 2014/2015
Projective techniques
Focus groups
In-depth interviews
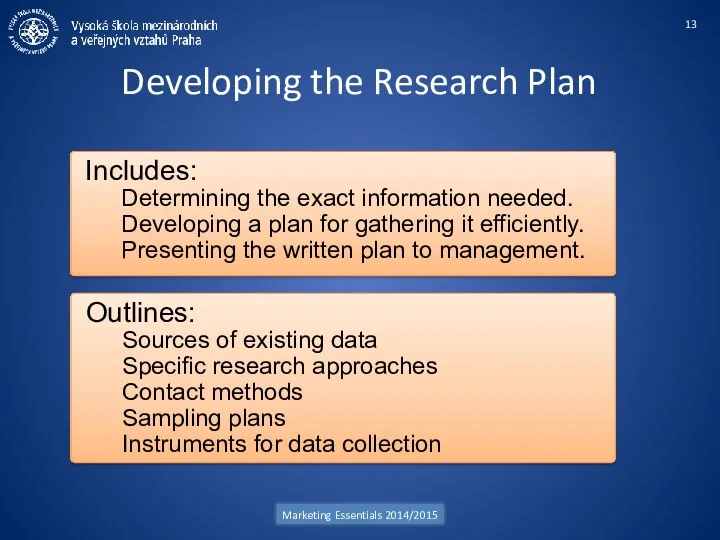
Developing the Research Plan
Marketing Essentials 2014/2015
Includes:
Determining the exact information needed.
Developing a
Developing the Research Plan
Marketing Essentials 2014/2015
Includes:
Determining the exact information needed.
Developing a
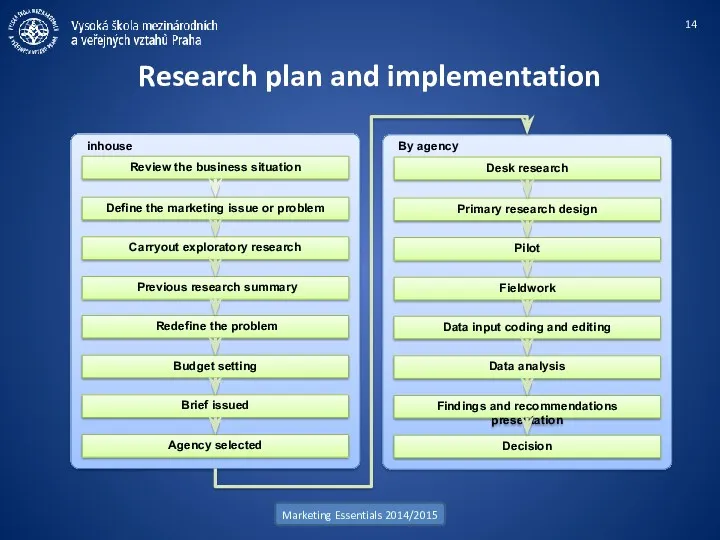
inhouse
Research plan and implementation
Marketing Essentials 2014/2015
Previous research summary
Carryout exploratory research
Define
inhouse
Research plan and implementation
Marketing Essentials 2014/2015
Previous research summary
Carryout exploratory research
Define
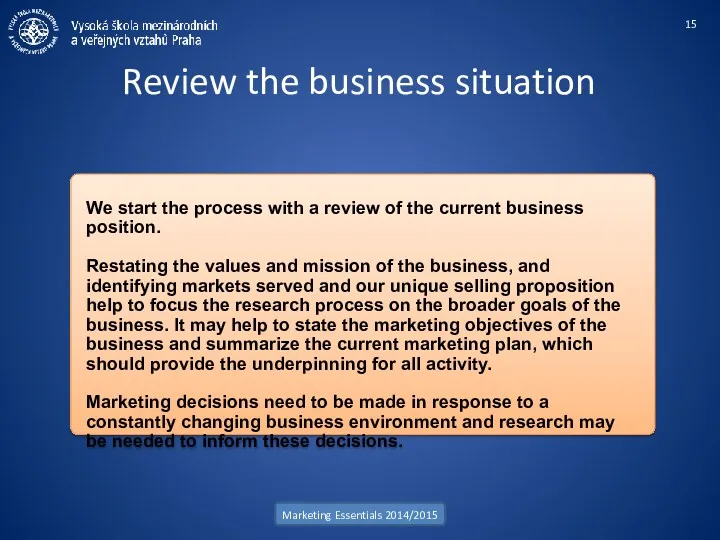
Review the business situation
Marketing Essentials 2014/2015
We start the process with a
Review the business situation
Marketing Essentials 2014/2015
We start the process with a
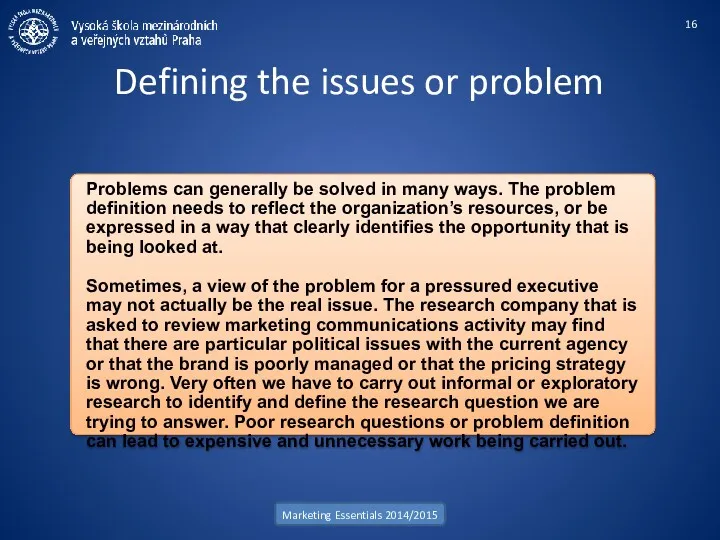
Defining the issues or problem
Marketing Essentials 2014/2015
Problems can generally be solved
Defining the issues or problem
Marketing Essentials 2014/2015
Problems can generally be solved
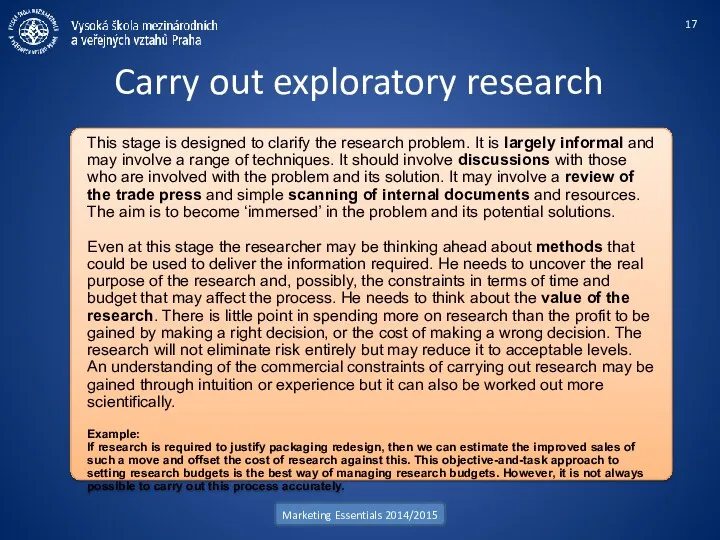
Carry out exploratory research
Marketing Essentials 2014/2015
This stage is designed to clarify
Carry out exploratory research
Marketing Essentials 2014/2015
This stage is designed to clarify
Previous research summary
Marketing Essentials 2014/2015
As part of this process, previously carried
Previous research summary
Marketing Essentials 2014/2015
As part of this process, previously carried
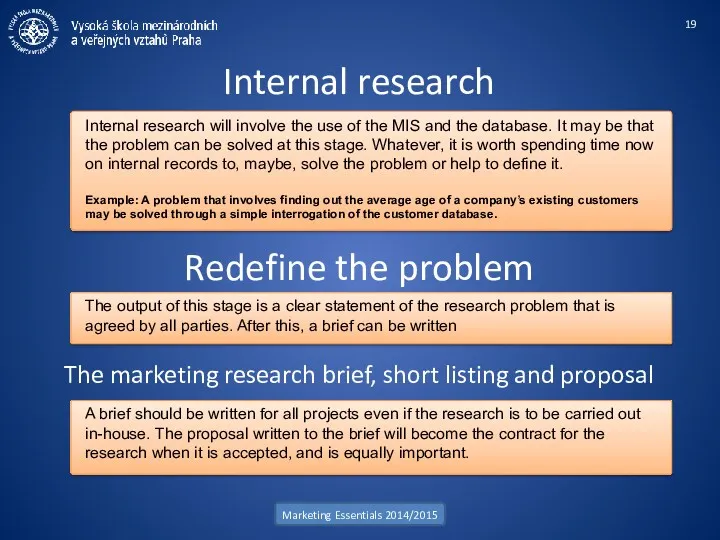
Internal research
Marketing Essentials 2014/2015
Internal research will involve the use of the
Internal research
Marketing Essentials 2014/2015
Internal research will involve the use of the
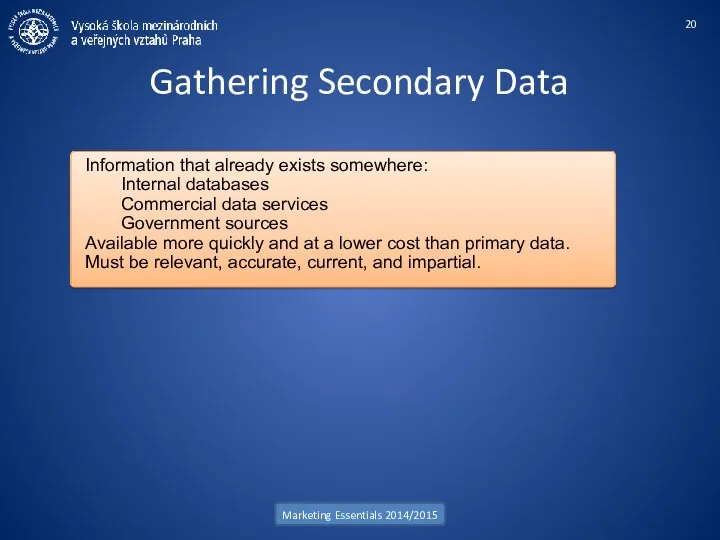
Gathering Secondary Data
Marketing Essentials 2014/2015
Information that already exists somewhere:
Internal databases
Commercial data
Gathering Secondary Data
Marketing Essentials 2014/2015
Information that already exists somewhere:
Internal databases
Commercial data
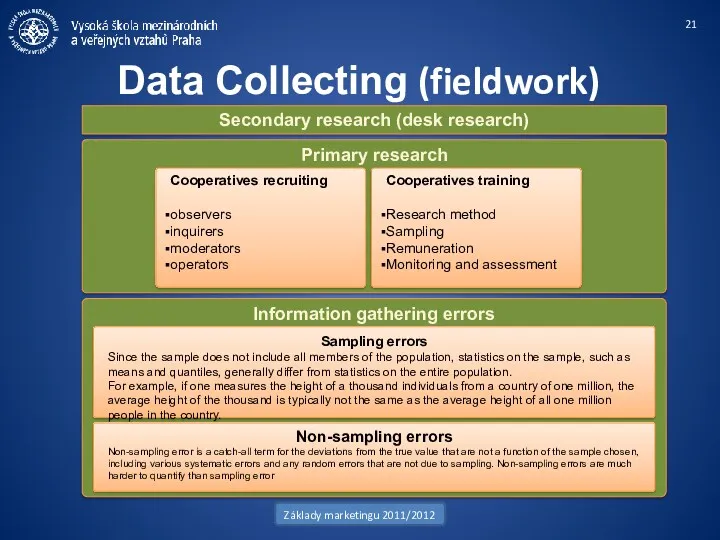
Primary research
Information gathering errors
Data Collecting (fieldwork)
Základy marketingu 2011/2012
Sampling errors
Since the
Primary research
Information gathering errors
Data Collecting (fieldwork)
Základy marketingu 2011/2012
Sampling errors
Since the
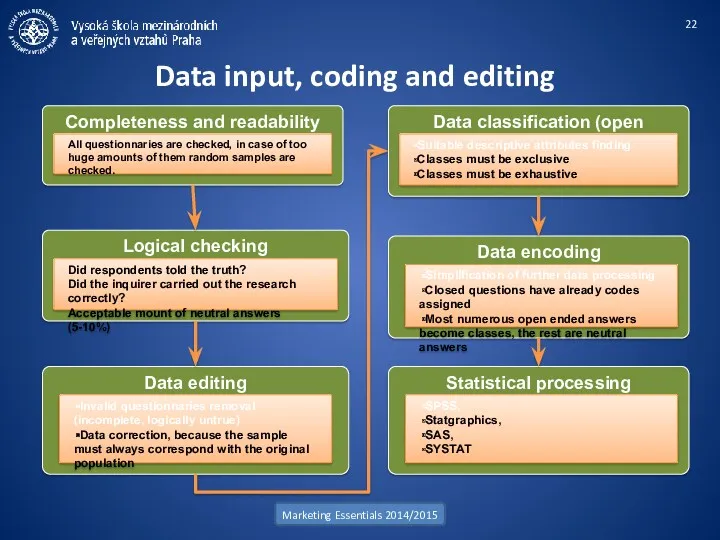
Completeness and readability check
Data input, coding and editing
Marketing Essentials 2014/2015
All questionnaries
Completeness and readability check
Data input, coding and editing
Marketing Essentials 2014/2015
All questionnaries
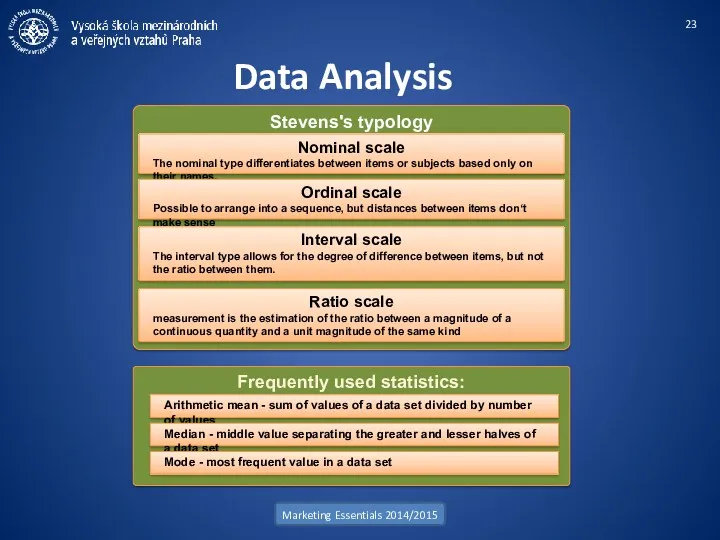
Stevens's typology
Data Analysis
Marketing Essentials 2014/2015
Nominal scale
The nominal type differentiates between items
Stevens's typology
Data Analysis
Marketing Essentials 2014/2015
Nominal scale
The nominal type differentiates between items
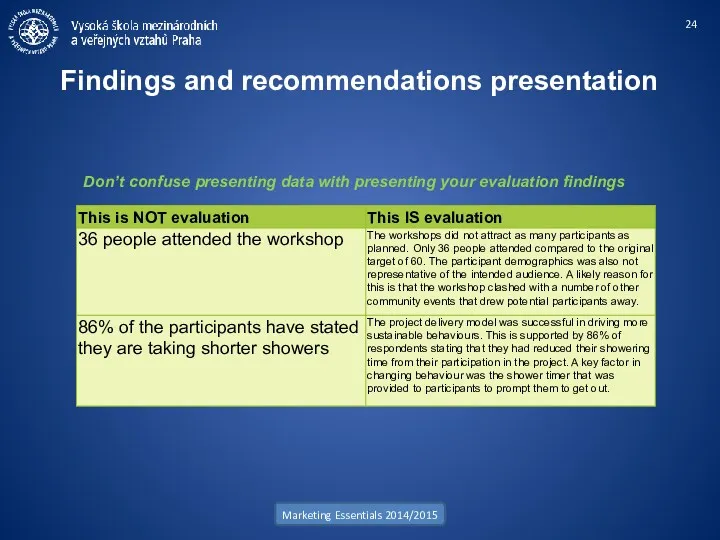
Findings and recommendations presentation
Marketing Essentials 2014/2015
Don’t confuse presenting data with presenting
Findings and recommendations presentation
Marketing Essentials 2014/2015
Don’t confuse presenting data with presenting
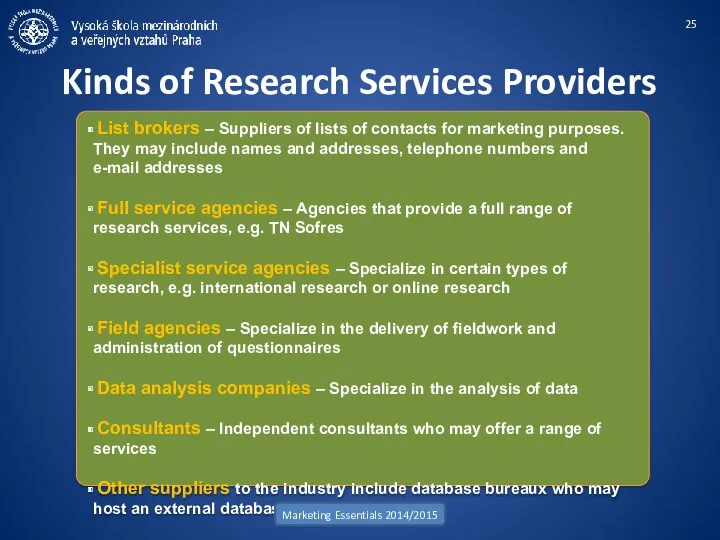
List brokers – Suppliers of lists of contacts for marketing
List brokers – Suppliers of lists of contacts for marketing
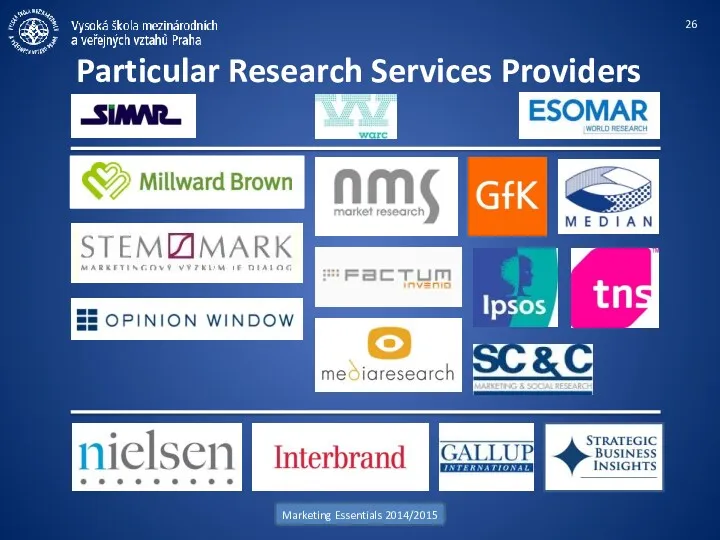
Particular Research Services Providers
Marketing Essentials 2014/2015
Particular Research Services Providers
Marketing Essentials 2014/2015
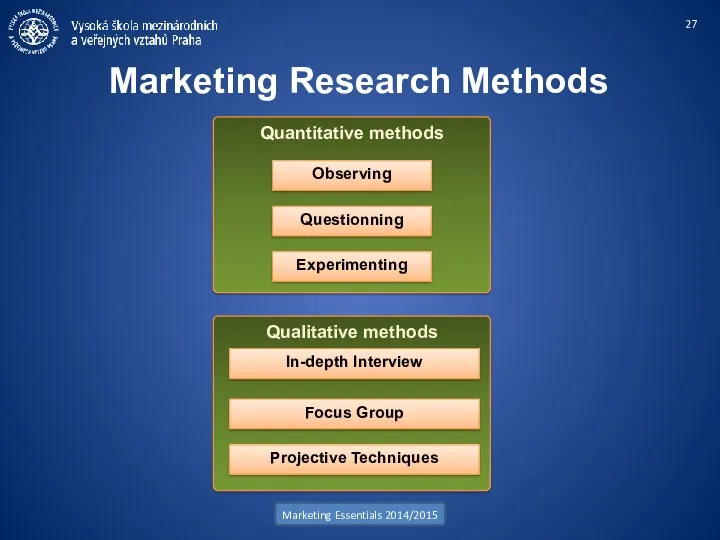
Quantitative methods
Marketing Research Methods
Marketing Essentials 2014/2015
Observing
Questionning
Experimenting
Qualitative methods
In-depth Interview
Focus Group
Projective Techniques
Quantitative methods
Marketing Research Methods
Marketing Essentials 2014/2015
Observing
Questionning
Experimenting
Qualitative methods
In-depth Interview
Focus Group
Projective Techniques
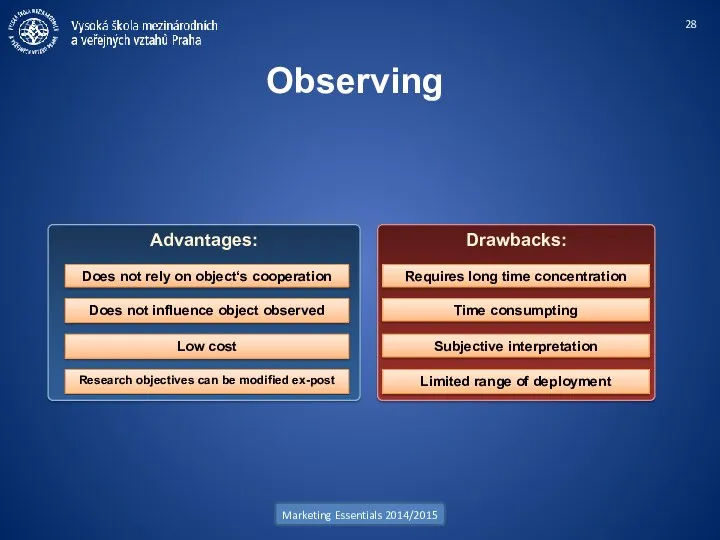
Advantages:
Observing
Marketing Essentials 2014/2015
Does not rely on object‘s cooperation
Does not influence object
Advantages:
Observing
Marketing Essentials 2014/2015
Does not rely on object‘s cooperation
Does not influence object
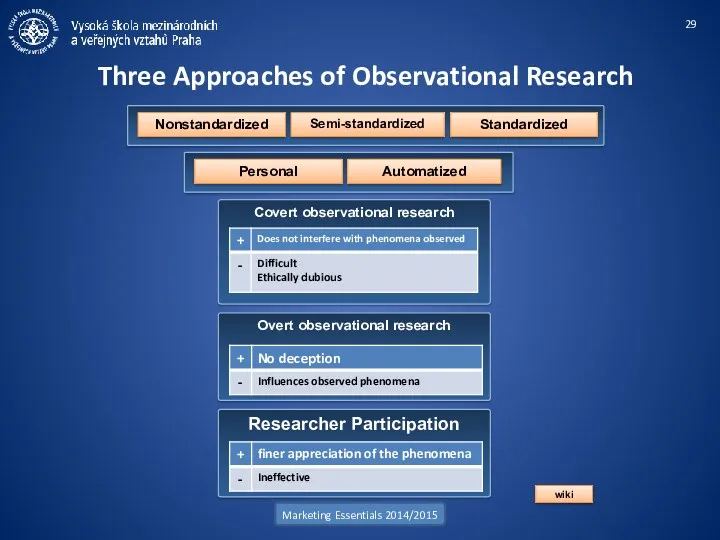
Covert observational research
Three Approaches of Observational Research
Marketing Essentials 2014/2015
Nonstandardized
Semi-standardized
Standardized
Overt observational
Covert observational research
Three Approaches of Observational Research
Marketing Essentials 2014/2015
Nonstandardized
Semi-standardized
Standardized
Overt observational
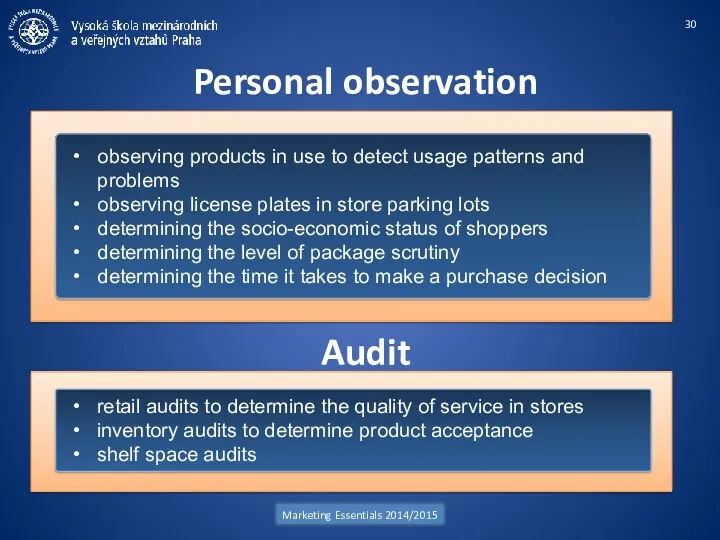
Personal observation
Marketing Essentials 2014/2015
observing products in use to detect usage patterns and problems
observing
Personal observation
Marketing Essentials 2014/2015
observing products in use to detect usage patterns and problems
observing
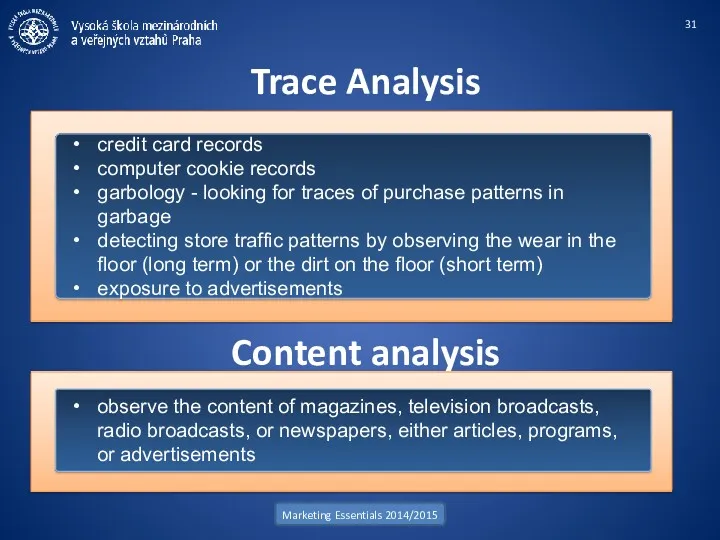
Trace Analysis
Marketing Essentials 2014/2015
credit card records
computer cookie records
garbology - looking for
Trace Analysis
Marketing Essentials 2014/2015
credit card records
computer cookie records
garbology - looking for
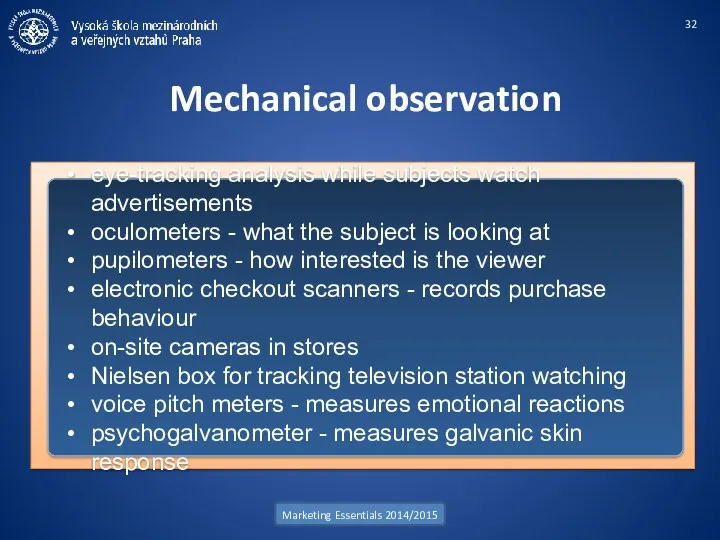
Mechanical observation
Marketing Essentials 2014/2015
eye-tracking analysis while subjects watch advertisements
oculometers - what the subject
Mechanical observation
Marketing Essentials 2014/2015
eye-tracking analysis while subjects watch advertisements
oculometers - what the subject
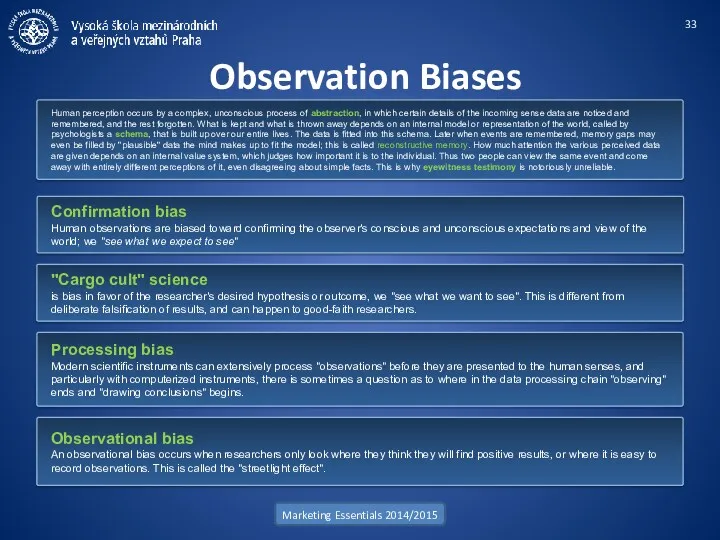
Observation Biases
Marketing Essentials 2014/2015
Human perception occurs by a complex, unconscious process
Observation Biases
Marketing Essentials 2014/2015
Human perception occurs by a complex, unconscious process
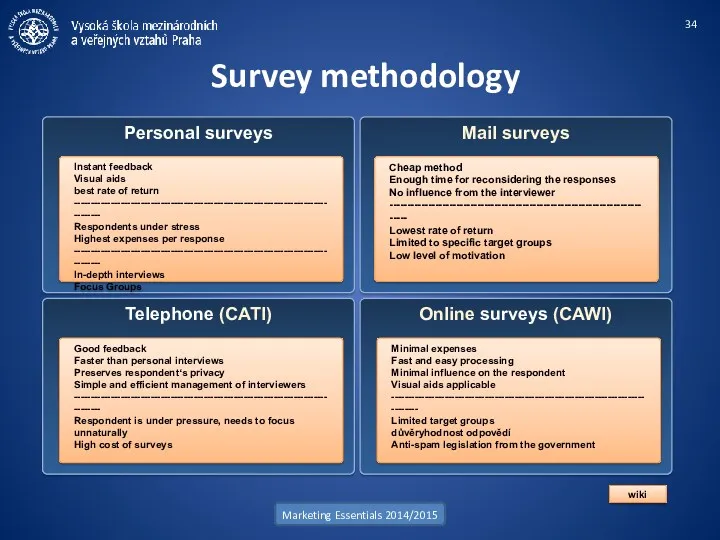
Survey methodology
Marketing Essentials 2014/2015
Personal surveys
Instant feedback
Visual aids
best rate of return
------------------------------------------------------------------------------------
Respondents
Survey methodology
Marketing Essentials 2014/2015
Personal surveys
Instant feedback
Visual aids
best rate of return
------------------------------------------------------------------------------------
Respondents
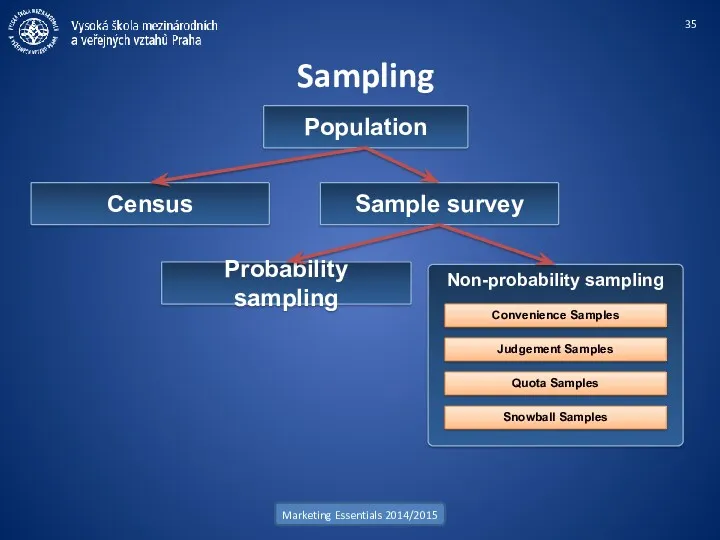
Sampling
Marketing Essentials 2014/2015
Population
Census
Sample survey
Probability sampling
Non-probability sampling
Convenience Samples
Judgement Samples
Quota Samples
Snowball
Sampling
Marketing Essentials 2014/2015
Population
Census
Sample survey
Probability sampling
Non-probability sampling
Convenience Samples
Judgement Samples
Quota Samples
Snowball
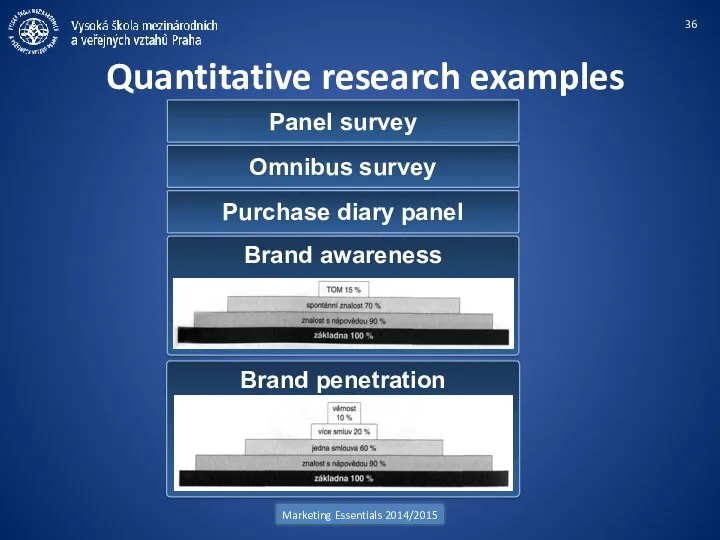
Quantitative research examples
Marketing Essentials 2014/2015
Panel survey
Omnibus survey
Purchase diary panel
Brand awareness
Brand penetration
Quantitative research examples
Marketing Essentials 2014/2015
Panel survey
Omnibus survey
Purchase diary panel
Brand awareness
Brand penetration
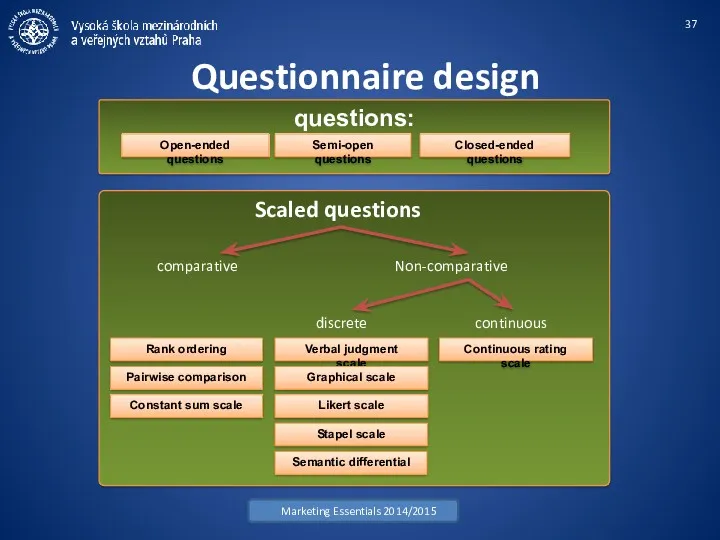
Questionnaire design
Marketing Essentials 2014/2015
questions:
Open-ended questions
Semi-open questions
Closed-ended questions
Verbal judgment scale
Graphical scale
Likert scale
Stapel
Questionnaire design
Marketing Essentials 2014/2015
questions:
Open-ended questions
Semi-open questions
Closed-ended questions
Verbal judgment scale
Graphical scale
Likert scale
Stapel
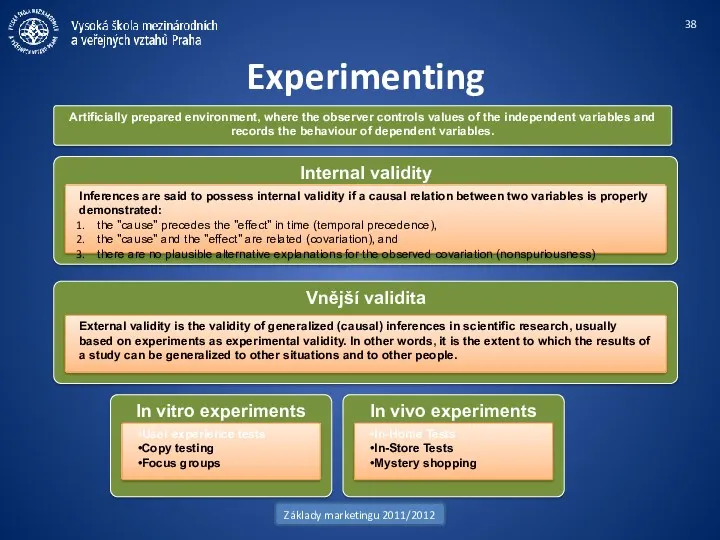
Experimenting
Základy marketingu 2011/2012
Internal validity
Inferences are said to possess internal validity if
Experimenting
Základy marketingu 2011/2012
Internal validity
Inferences are said to possess internal validity if
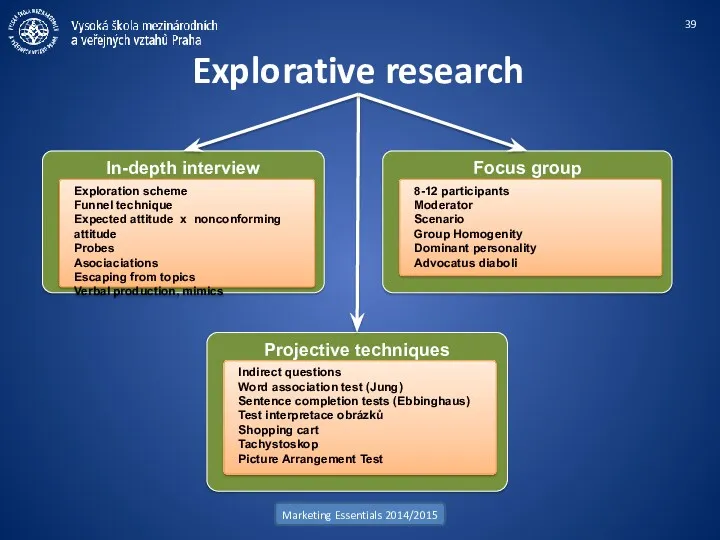
Explorative research
Marketing Essentials 2014/2015
In-depth interview
Exploration scheme
Funnel technique
Expected attitude x nonconforming attitude
Probes
Asociaciations
Escaping
Explorative research
Marketing Essentials 2014/2015
In-depth interview
Exploration scheme
Funnel technique
Expected attitude x nonconforming attitude
Probes
Asociaciations
Escaping
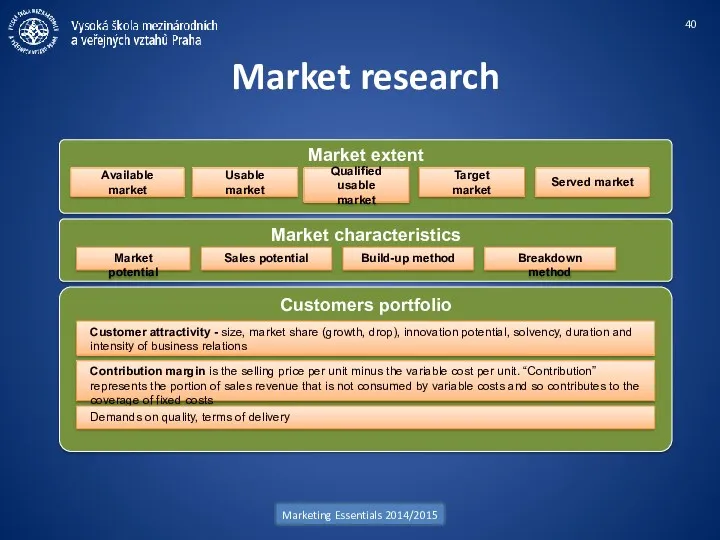
Market research
Marketing Essentials 2014/2015
Market extent
Available market
Market characteristics
Market potential
Usable market
Qualified usable market
Target
Market research
Marketing Essentials 2014/2015
Market extent
Available market
Market characteristics
Market potential
Usable market
Qualified usable market
Target
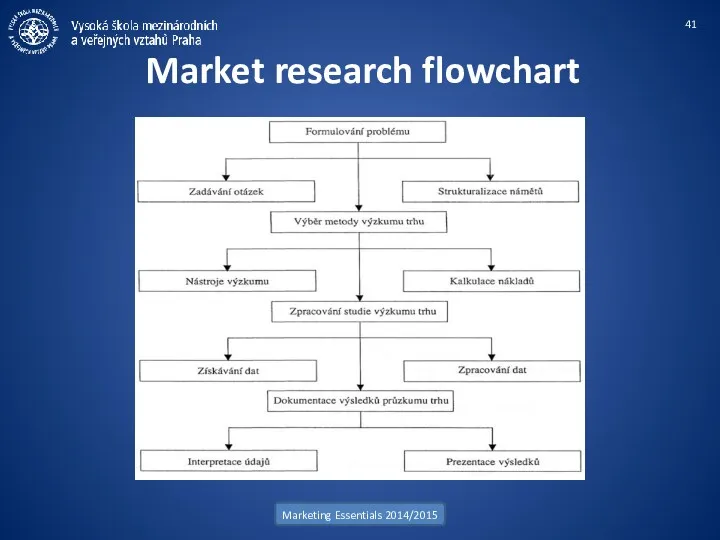
Market research flowchart
Marketing Essentials 2014/2015
Market research flowchart
Marketing Essentials 2014/2015
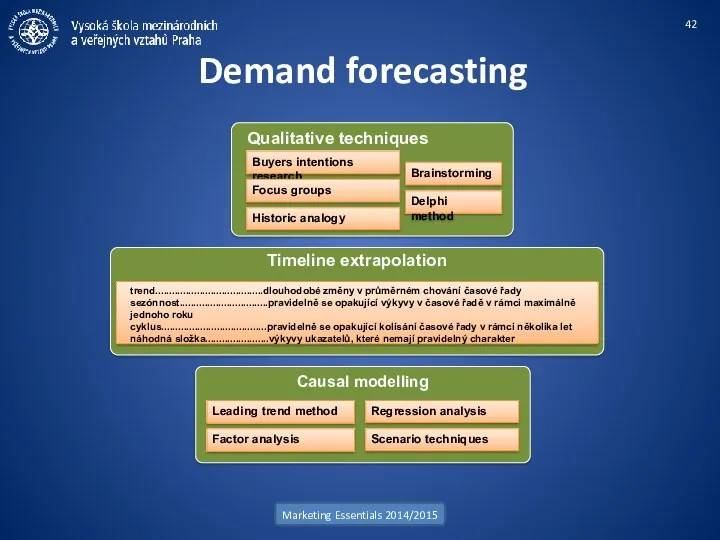
Demand forecasting
Marketing Essentials 2014/2015
Qualitative techniques
Timeline extrapolation
Buyers intentions research
Causal modelling
Delphi method
Brainstorming
Focus groups
Historic
Demand forecasting
Marketing Essentials 2014/2015
Qualitative techniques
Timeline extrapolation
Buyers intentions research
Causal modelling
Delphi method
Brainstorming
Focus groups
Historic
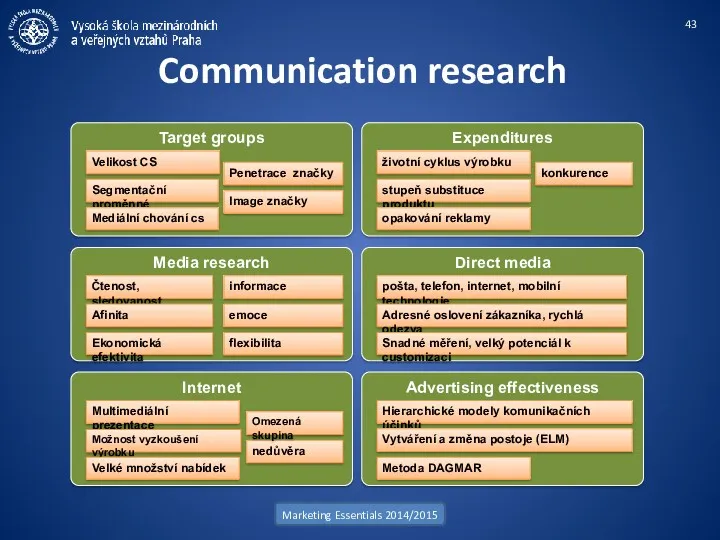
Communication research
Marketing Essentials 2014/2015
Target groups
Velikost CS
Image značky
Penetrace značky
Segmentační proměnné
Mediální chování cs
Expenditures
životní
Communication research
Marketing Essentials 2014/2015
Target groups
Velikost CS
Image značky
Penetrace značky
Segmentační proměnné
Mediální chování cs
Expenditures
životní
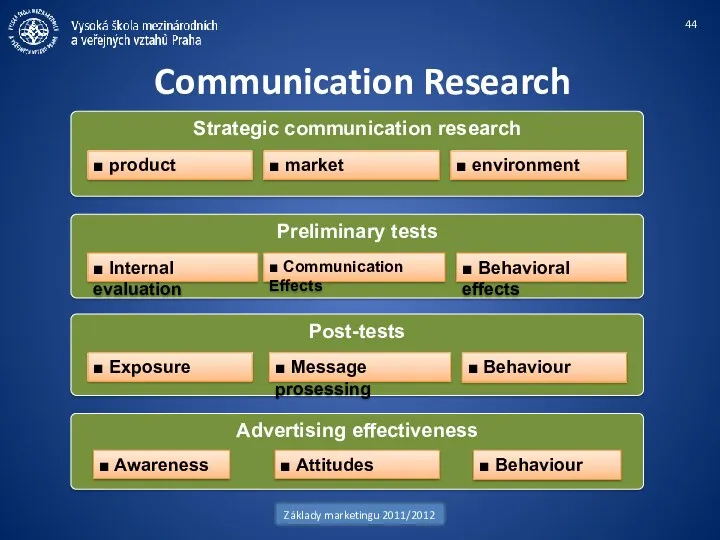
Communication Research
Základy marketingu 2011/2012
Preliminary tests
■ Internal evaluation
■ Communication Effects
Post-tests
■ Exposure
■ Message
Communication Research
Základy marketingu 2011/2012
Preliminary tests
■ Internal evaluation
■ Communication Effects
Post-tests
■ Exposure
■ Message
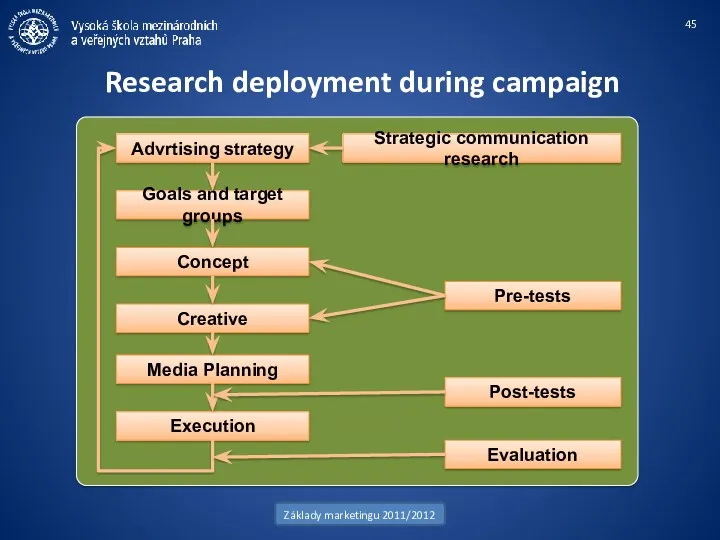
Research deployment during campaign
Základy marketingu 2011/2012
Advrtising strategy
Goals and target groups
Concept
Creative
Media Planning
Execution
Strategic communication
Research deployment during campaign
Základy marketingu 2011/2012
Advrtising strategy
Goals and target groups
Concept
Creative
Media Planning
Execution
Strategic communication
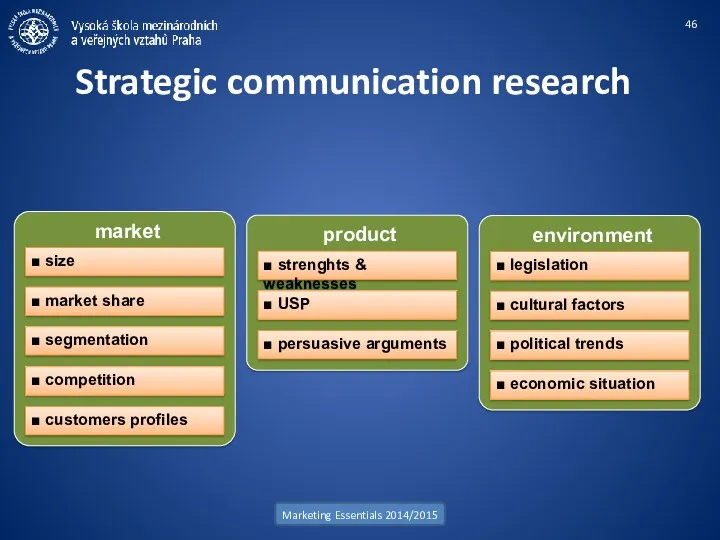
Strategic communication research
Marketing Essentials 2014/2015
product
■ strenghts & weaknesses
■ USP
■ persuasive
Strategic communication research
Marketing Essentials 2014/2015
product
■ strenghts & weaknesses
■ USP
■ persuasive
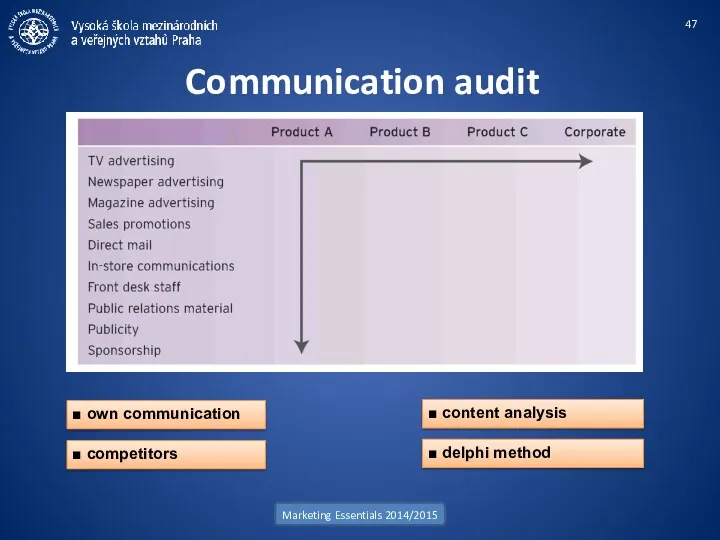
Communication audit
Marketing Essentials 2014/2015
■ content analysis
■ delphi method
■ own communication
■ competitors
Communication audit
Marketing Essentials 2014/2015
■ content analysis
■ delphi method
■ own communication
■ competitors
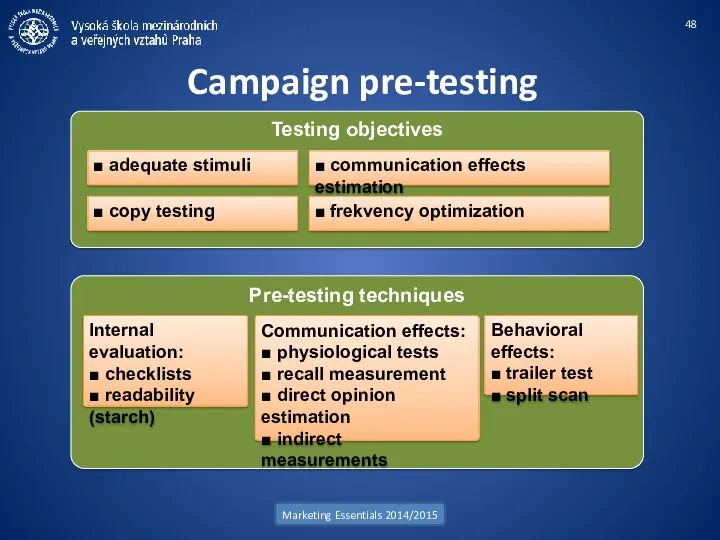
Campaign pre-testing
Marketing Essentials 2014/2015
Testing objectives
■ adequate stimuli
■ communication effects estimation
■ frekvency
Campaign pre-testing
Marketing Essentials 2014/2015
Testing objectives
■ adequate stimuli
■ communication effects estimation
■ frekvency
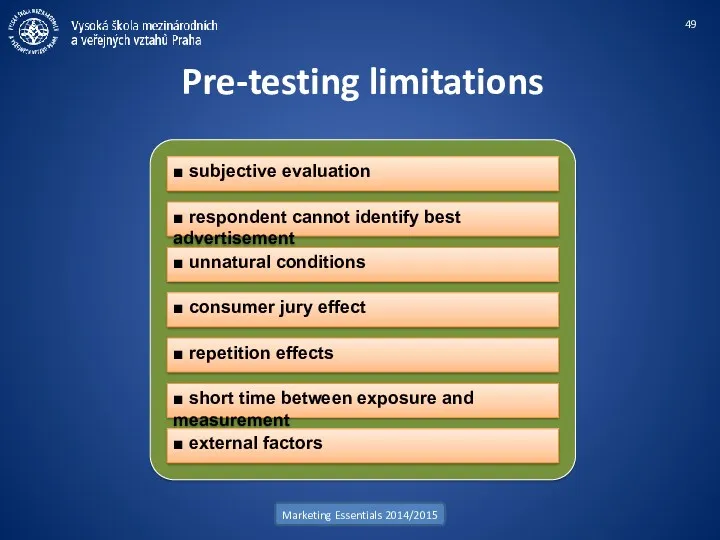
Pre-testing limitations
Marketing Essentials 2014/2015
■ subjective evaluation
■ unnatural conditions
■ consumer jury effect
■
Pre-testing limitations
Marketing Essentials 2014/2015
■ subjective evaluation
■ unnatural conditions
■ consumer jury effect
■
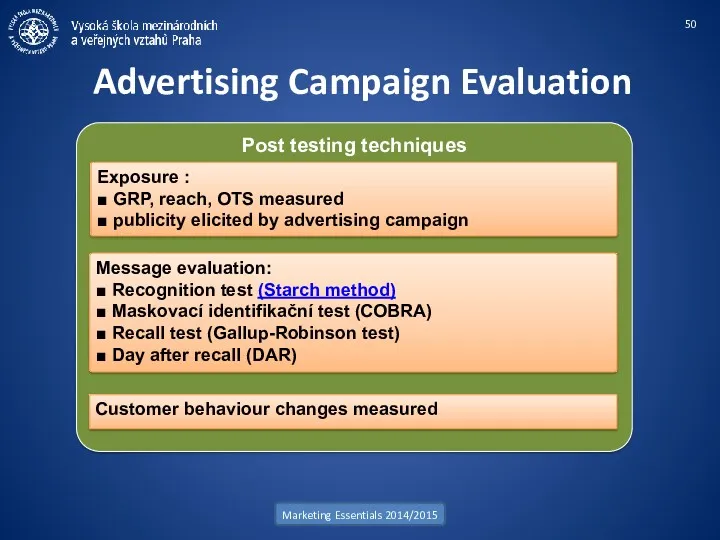
Advertising Campaign Evaluation
Marketing Essentials 2014/2015
Post testing techniques
Exposure :
■ GRP, reach, OTS
Advertising Campaign Evaluation
Marketing Essentials 2014/2015
Post testing techniques
Exposure :
■ GRP, reach, OTS
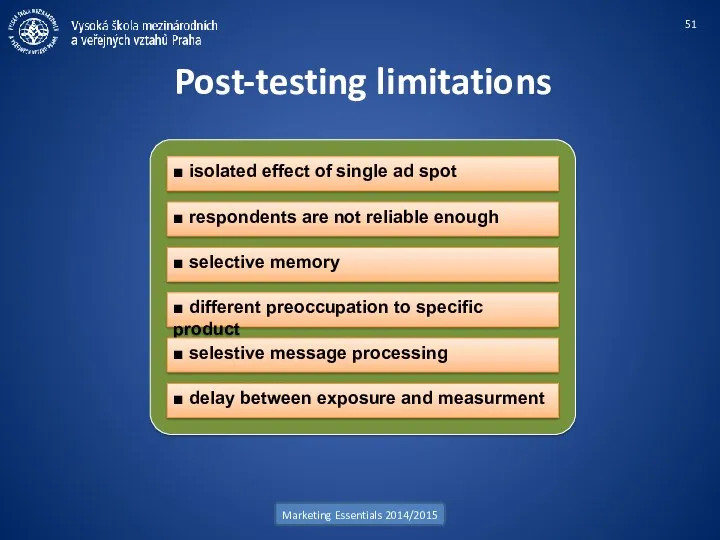
Post-testing limitations
Marketing Essentials 2014/2015
■ isolated effect of single ad spot
■ selective
Post-testing limitations
Marketing Essentials 2014/2015
■ isolated effect of single ad spot
■ selective
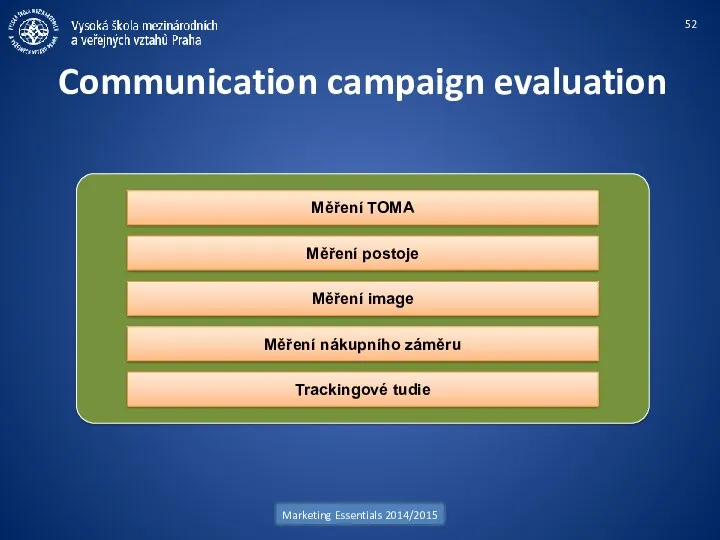
Communication campaign evaluation
Marketing Essentials 2014/2015
Měření TOMA
Měření postoje
Měření image
Měření nákupního záměru
Trackingové tudie
Communication campaign evaluation
Marketing Essentials 2014/2015
Měření TOMA
Měření postoje
Měření image
Měření nákupního záměru
Trackingové tudie
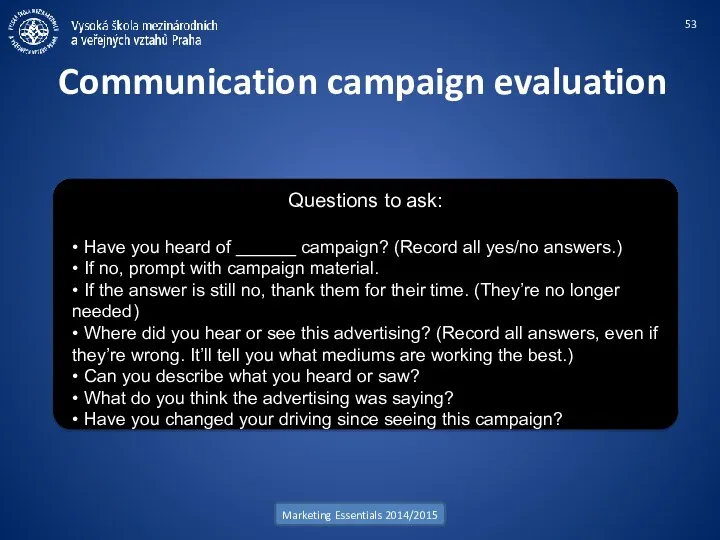
Communication campaign evaluation
Marketing Essentials 2014/2015
Questions to ask:
• Have you heard of
Communication campaign evaluation
Marketing Essentials 2014/2015
Questions to ask:
• Have you heard of
 Продам
 Штрих-кодирование упаковочных листов
 Eye-tracking как инструмент повышения конверсии сайта
 DURACELL Коммерческое предложение для сети магазинов
 Акция 20+1, Петровская Слобода
 Рынок лидогенерации. Интернет-рынок в России. Понятия и термины СРА-рекламы. Процедура по работе с партнерской сетью
 Научное шоу Открывашка. Выпускной в детском саду
 Adversting
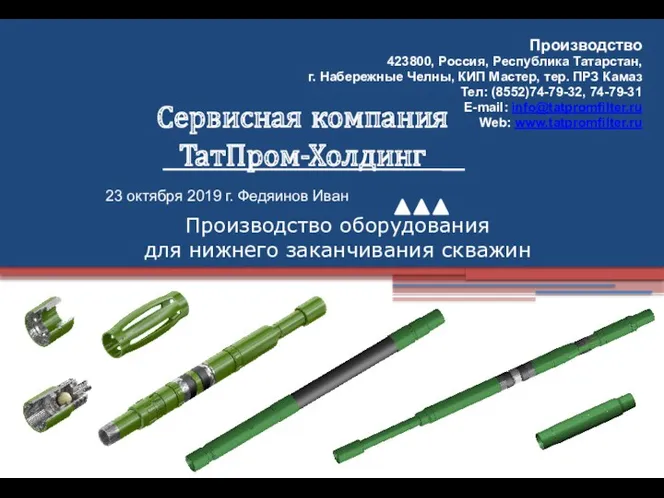 Сервисная компания ТатПром-Холдинг. Производство оборудования для нижнего заканчивания скважин
 Invenda Intel
 Эффективность предпринимательской деятельности. Тема 8
 Transactional Replication
 Семинар “Желание, власть и любовь”
 Moda International Fashion Group
 Уміння продавати
 База отдыха и рыбалки на НГ
 Рекламное воздействие и ценовые модели размещения рекламы в интернете
 Сходства и различия рекламы и PR
 Большой и современный жилой комплекс Ярославский
 Смазочно-охлаждающие жидкости (СОЖ)
 Компания Atomy
 Phenicoptere
 Мастерство переговоров. Тренинг Стратегия и тактика эффективных переговоров
 Петербургский клуб Природного земледелия. Бесплатные лекции для садоводов и продажа лучших товаров для Природного земледелия
 Разработка комплекса маркетинга. Разработка товара. Установление цен на товары
 Как перестать беспокоиться и начать путешествовать
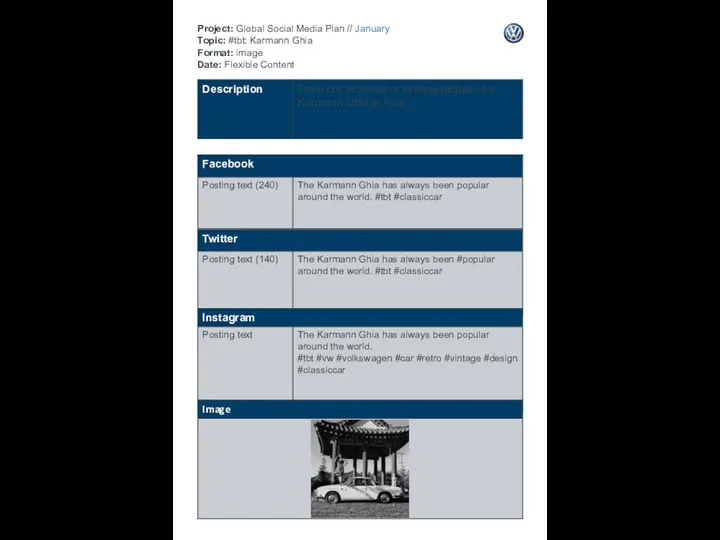 Project: Global Social Media Plan
 Школьная Форма