- Independent samples using the test statistic

Содержание
- 2. Section 8-3 Testing the Difference Between Means (Dependent Samples) We can conduct the hypothesis test on
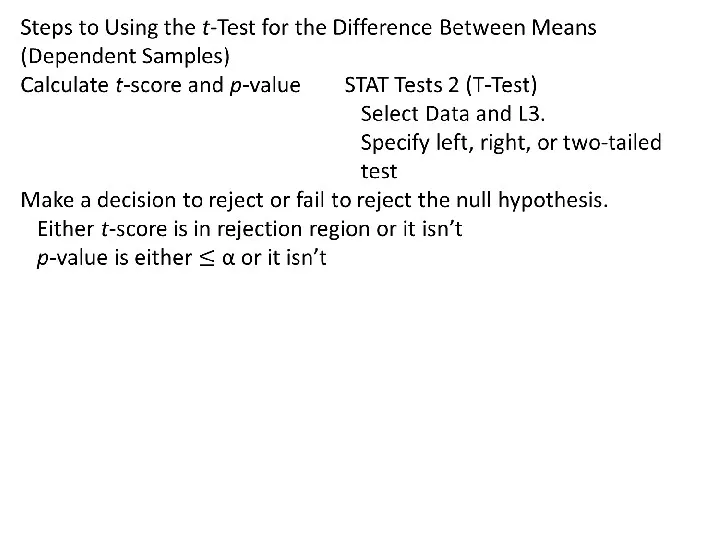
- 3. Steps to Using the t-Test for the Difference Between Means (Dependent Samples) State H0 and Ha.
- 5. Example 1 on page 463— A golf club manufacturer claims that golfers can lower their scores
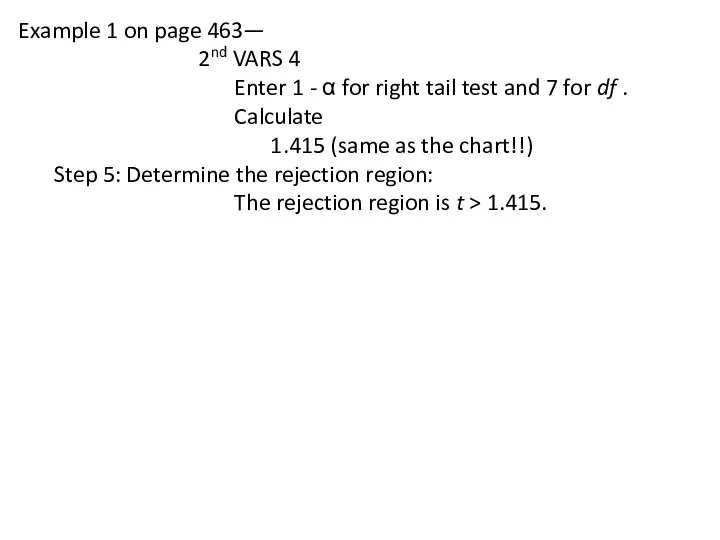
- 7. Example 1 on page 463— 2nd VARS 4 Enter 1 - α for right tail test
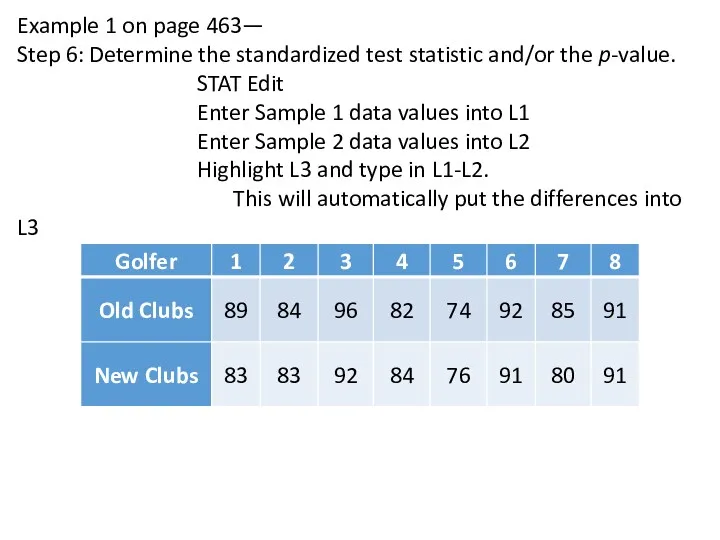
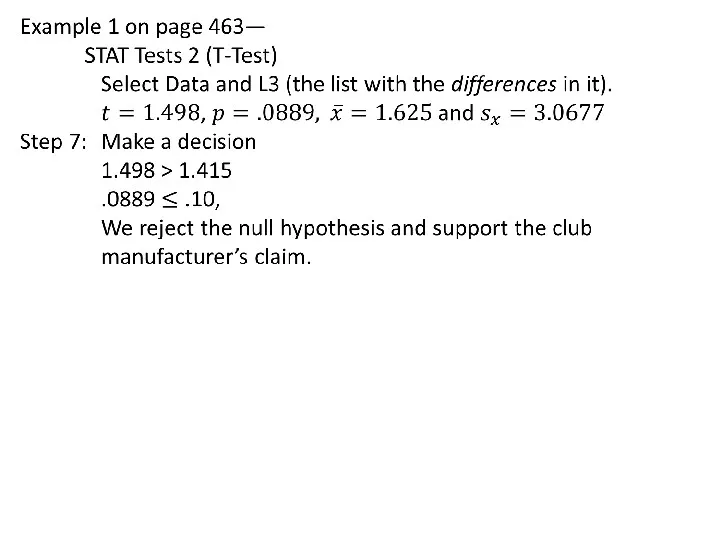
- 8. Example 1 on page 463— Step 6: Determine the standardized test statistic and/or the p-value. STAT
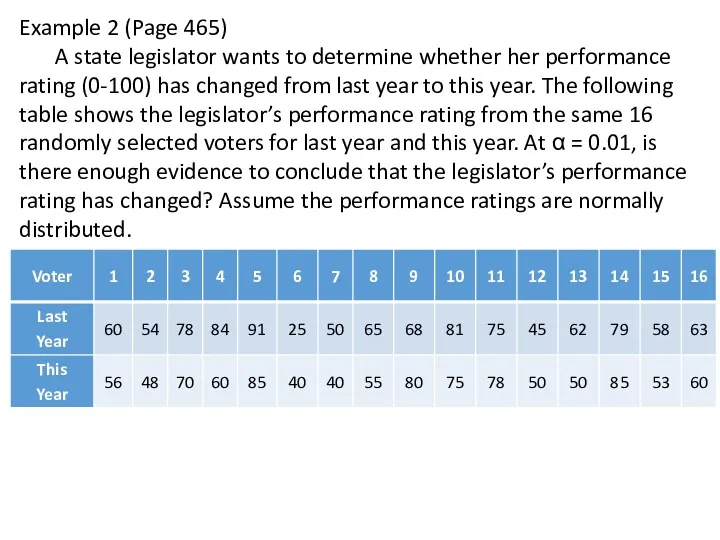
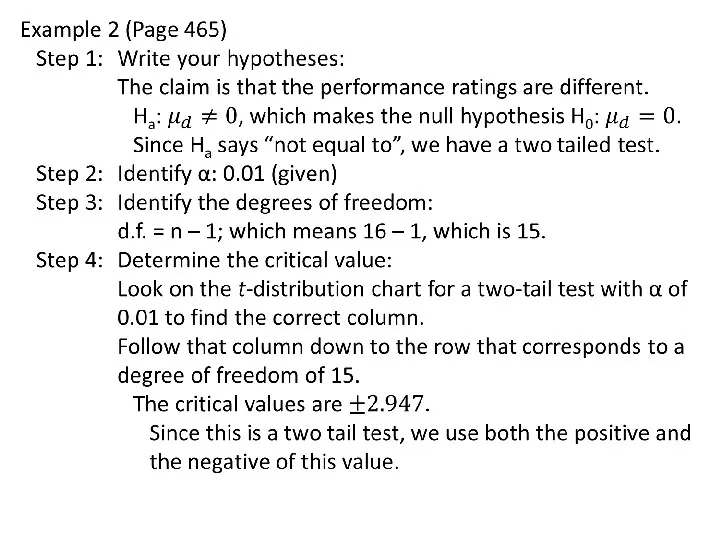
- 10. Example 2 (Page 465) A state legislator wants to determine whether her performance rating (0-100) has
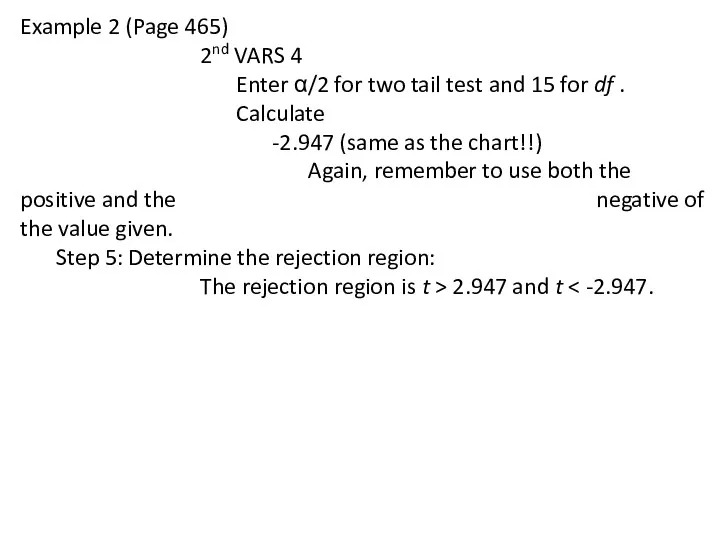
- 12. Example 2 (Page 465) 2nd VARS 4 Enter α/2 for two tail test and 15 for
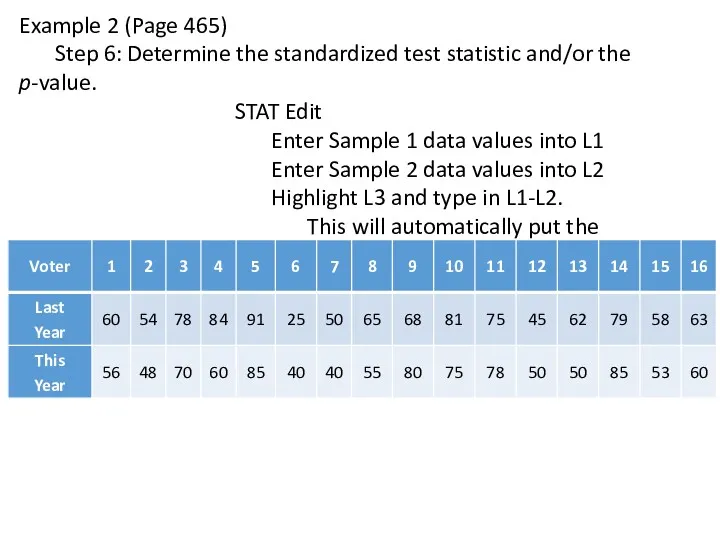
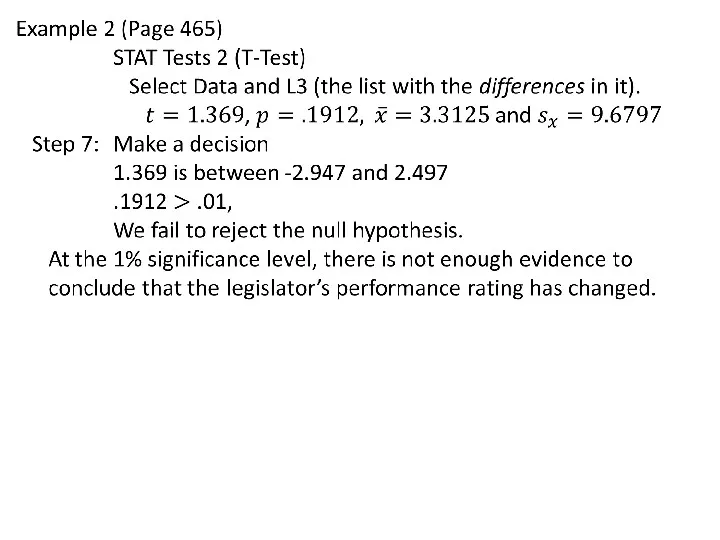
- 13. Example 2 (Page 465) Step 6: Determine the standardized test statistic and/or the p-value. STAT Edit
- 16. Скачать презентацию
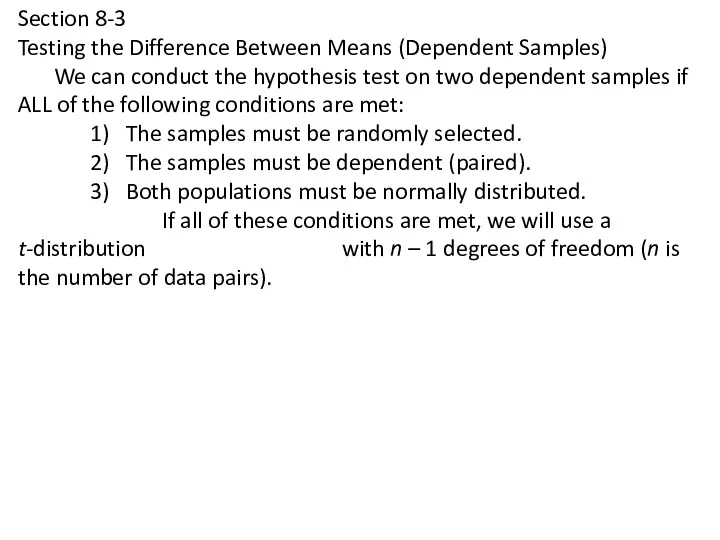
Section 8-3
Testing the Difference Between Means (Dependent Samples)
We can conduct the
Section 8-3
Testing the Difference Between Means (Dependent Samples)
We can conduct the
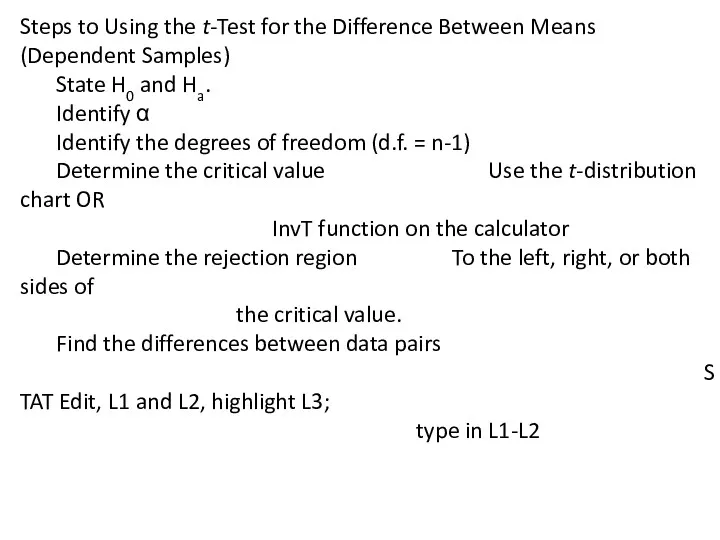
Steps to Using the t-Test for the Difference Between Means (Dependent
Steps to Using the t-Test for the Difference Between Means (Dependent
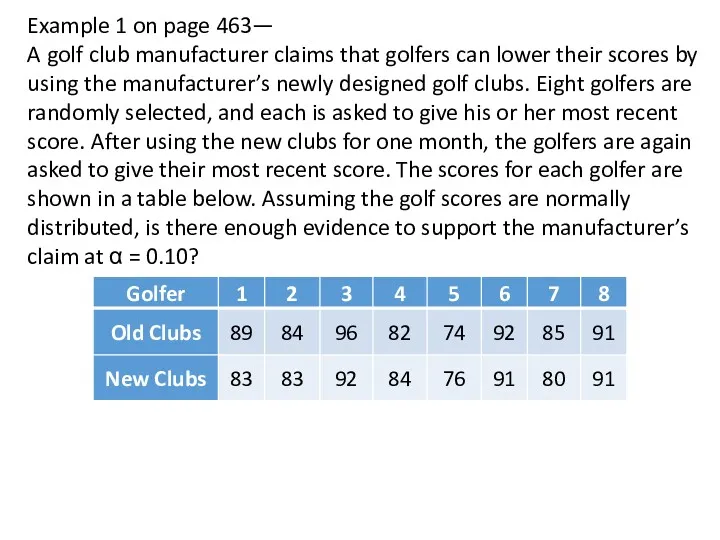
Example 1 on page 463—
A golf club manufacturer claims that golfers
Example 1 on page 463—
A golf club manufacturer claims that golfers

Example 1 on page 463—
2nd VARS 4
Enter 1 - α for
Example 1 on page 463—
2nd VARS 4
Enter 1 - α for
Example 1 on page 463—
Step 6: Determine the standardized test statistic and/or
Example 1 on page 463—
Step 6: Determine the standardized test statistic and/or
Example 2 (Page 465)
A state legislator wants to determine whether her
Example 2 (Page 465)
A state legislator wants to determine whether her
Example 2 (Page 465)
2nd VARS 4
Enter α/2 for two tail test
Example 2 (Page 465)
2nd VARS 4
Enter α/2 for two tail test
Example 2 (Page 465)
Step 6: Determine the standardized test statistic and/or the
Example 2 (Page 465)
Step 6: Determine the standardized test statistic and/or the
 Слайды к занятию
 задачи с величинами
 Уравнение линии на плоскости
 Практика. Решение системы уравнений
 Интеллектуально познавательная игра Умники и умницы
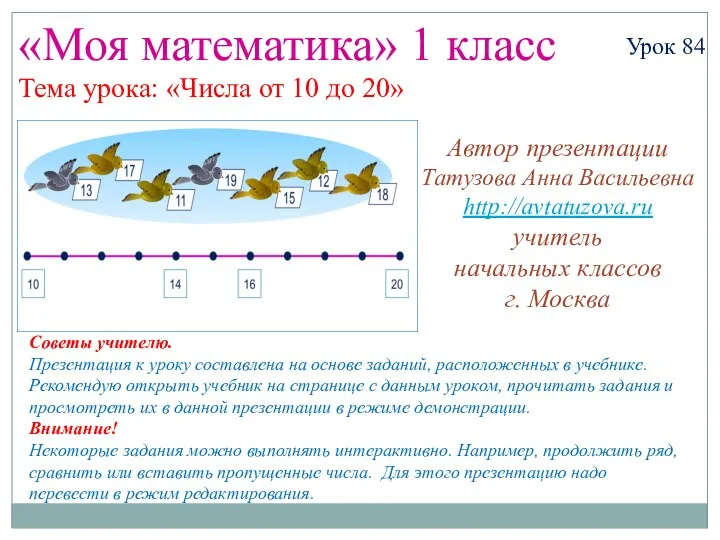 Математика. 1 класс. Урок 84. Числа от 10 до 20 - Презентация
 Суд над кривыми
 Игровые технологии на уроках математики
 умножение на единицу и нуль
 Производная. Устные упражнения
 Свойства сложения. (5 класс)
 Приёмы формирования УУД учащихся 4 класса в рамках ФГОС по предмету Математика
 Считаем быстро и правильно
 презентация к уроку математики 3 класс (система Занкова)
 Урок 15. Точечная оценка числовой характеристики случайной величины, ее свойства
 Скорость. Единицы скорости. Взаимосвязь между скоростью, временем и расстоянием
 Презентация Играем и учимся со счетными палочками
 Система задач по геометрии, как средство развития пространственного мышления
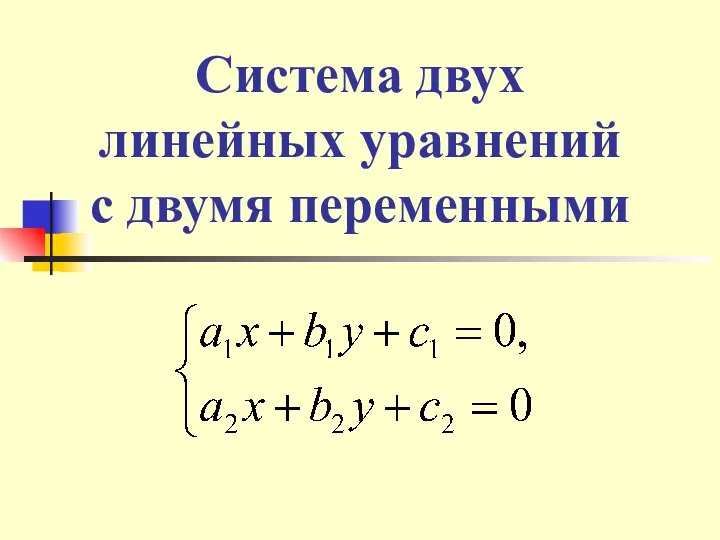 Система двух линейных уравнений с двумя переменными a1 x b1 y c1 0, a2 x b2 y c2 0
 Презентация к уроку математики по теме Единица измерения длины - сантиметр (УМК Школа России)
 презентация для 3 класса
 Проект Математика на кухне ЧАСТЬ 1
 Нескучная математика
 Запись числа в десятичной системе счисления
 Комбинаторика. Разбор возможных вариантов
 Презентация Система заданий по формированию регулятивных УУД на уроках математики в 1 классе, комментарий к слайдам
 Методическая разработка урока - мастерской Что нам стоит дом построить по теме Площадь фигур
 Упрощение выражений и порядок выполнения действий